
Price has moved higher but today’s candlestick closed red.
There are still at least two hourly Elliott wave counts for the main daily Elliott wave count. The alternate Elliott wave count has reduced in probability.
Summary: In the short term, it looks like a bounce may unfold over the next day or so to about 1,248. This may present an opportunity to join a short term downwards trend for more aggressive traders.
It is possible though that the bounce may not occur, although this looks less likely today. If price begins to move lower and exhibits an increase in momentum and volume, then the bounce may not happen.
The main wave count expects a deep pullback to a target at 1,197 – 1,192. This may be met in 5 or 18 sessions if intermediate wave (2) exhibits a Fibonacci duration of 21 or 34 days.
New updates to this analysis are in bold.
Last monthly and weekly charts are here. Last historic analysis video is here.
Grand SuperCycle analysis is here.
MAIN ELLIOTT WAVE COUNT
DAILY CHART – DETAIL
Click chart to enlarge.
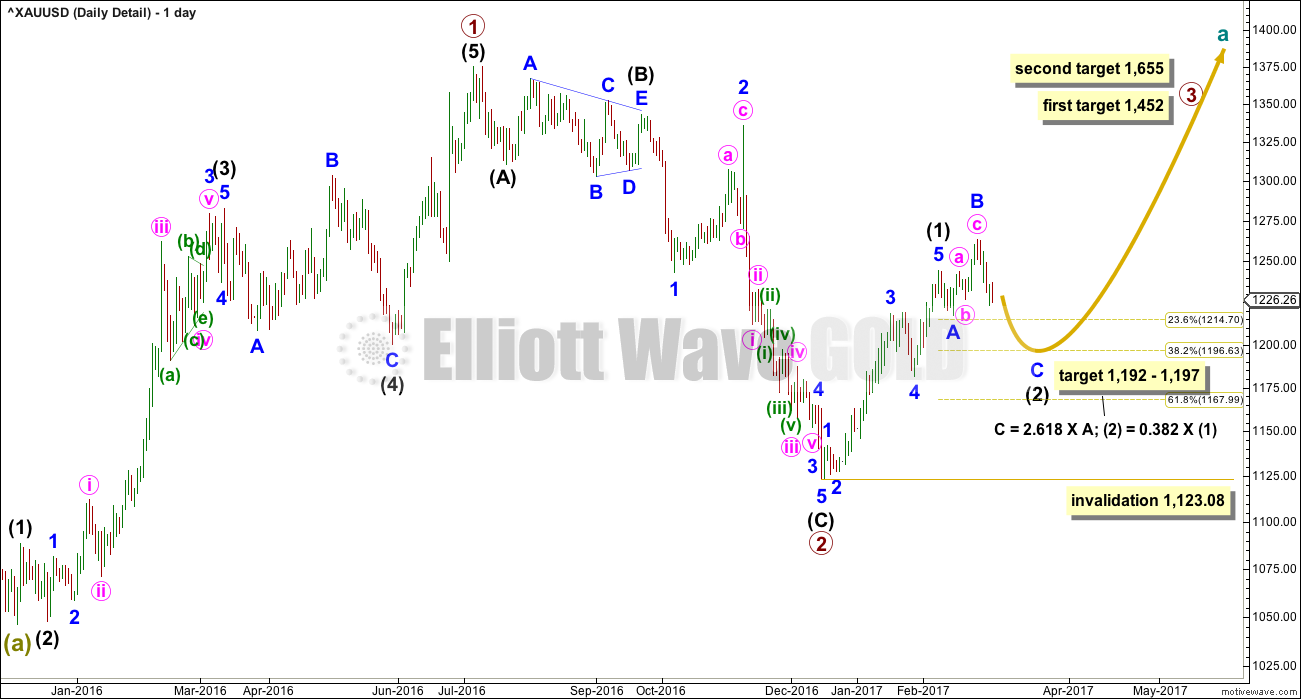
This daily chart shows all detail of upwards movement from the low in December 2015.
There is more than one way to see the first upwards wave. Review weekly charts (linked to above) to see alternates.
The upwards wave labelled primary wave 1 on this wave count can be seen as either a three or a five. Alternates detailed in last historical analysis look at the possibility that it is a three. This main wave count looks at the possibility that it is a five, which has a slightly better fit.
Primary wave 2 is a very deep 0.77 zigzag. Primary wave 2 lasted 116 days compared to 152 days for primary wave 1. The proportion and depth of primary wave 2 looks right. It should be over here.
Primary wave 3 must subdivide as a five wave impulse. Within primary wave 3, intermediate wave (2) may not move beyond the start of intermediate wave (1) below 1,123.08.
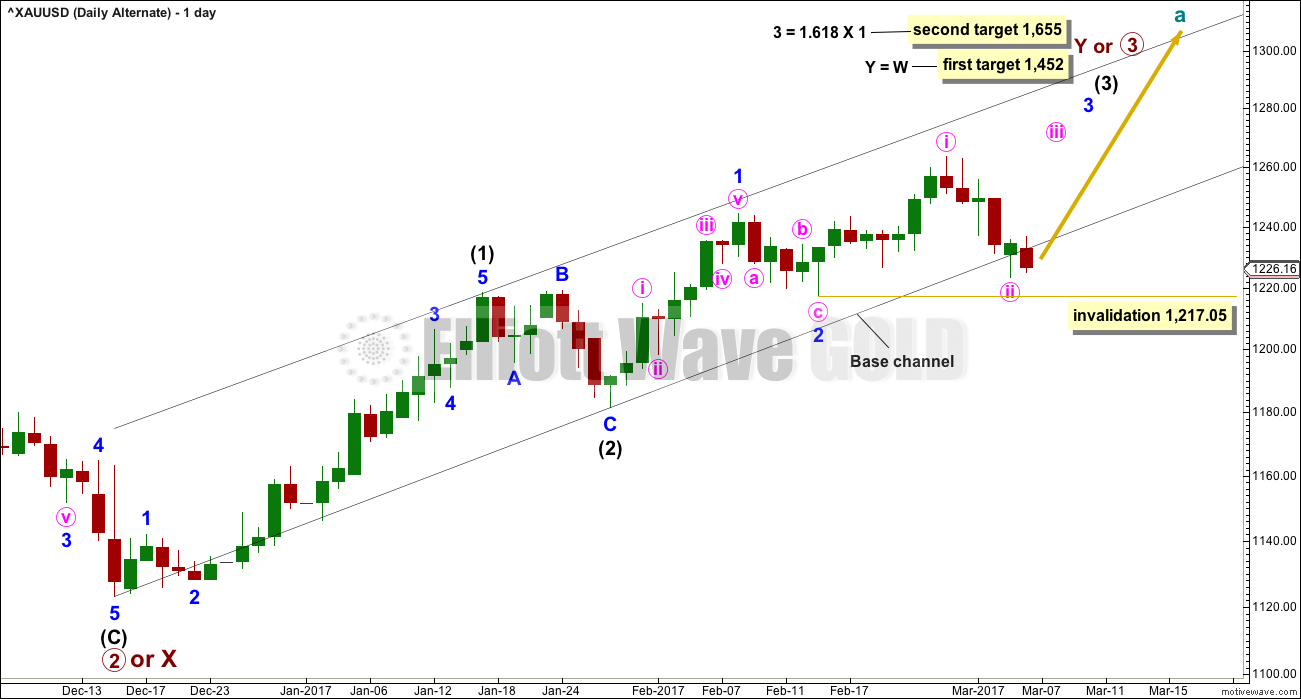
DAILY CHART
Click chart to enlarge.
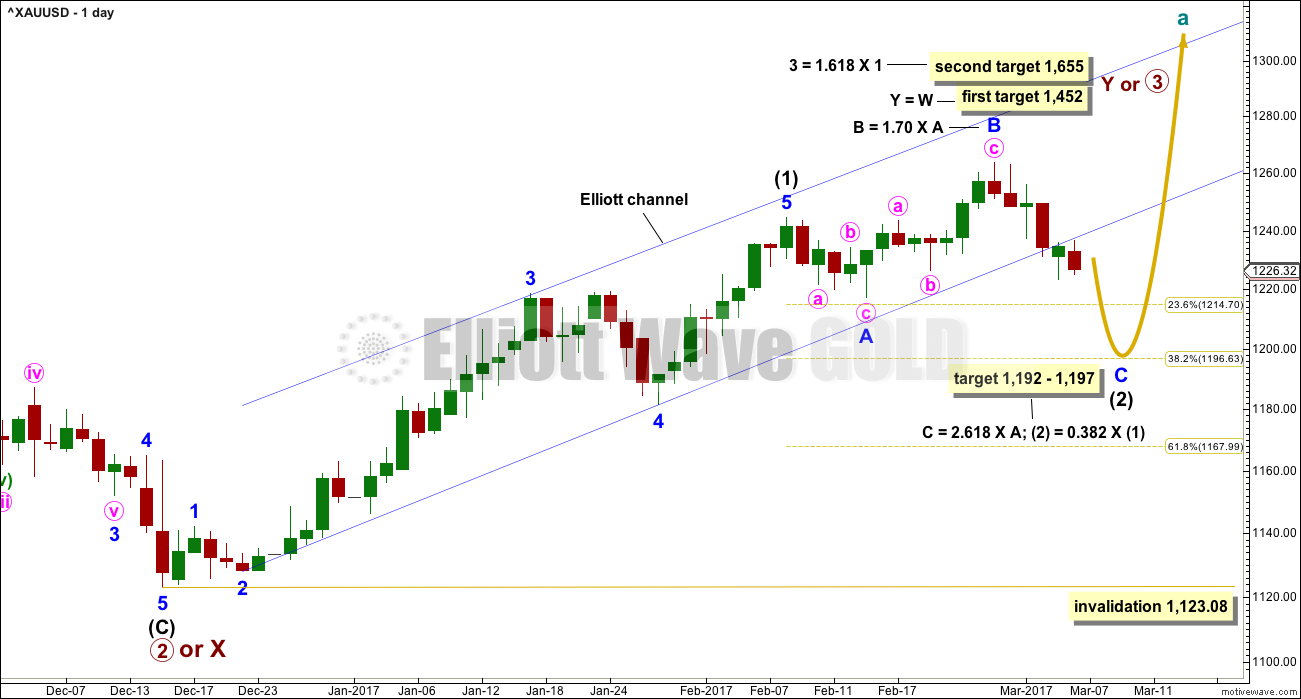
Intermediate wave (1) is a complete five wave impulse lasting 39 days. Intermediate wave (2) so far looks like an expanded flat, which are very common structures. The most likely point for it to end would be close to the 0.618 Fibonacci ratio of intermediate wave (1) at 1,197. This is also close to where minor wave C would reach the most common Fibonacci ratio to minor wave A at 1,192, so this target zone has a good probability.
Minor wave C must subdivide as a five wave structure. It would be extremely likely to make at least a slight new low below the end of minor wave A at 1,217.05 to avoid a truncation and a very rare running flat.
So far intermediate wave (2) has lasted 18 sessions. If it exhibits a Fibonacci duration, it may total 21 or 34 sessions and that would see it continue now for a further 3 or 16 sessions.
Intermediate wave (2) may not move beyond the start of intermediate wave (1) below 1,123.08.
HOURLY CHART
Click chart to enlarge.
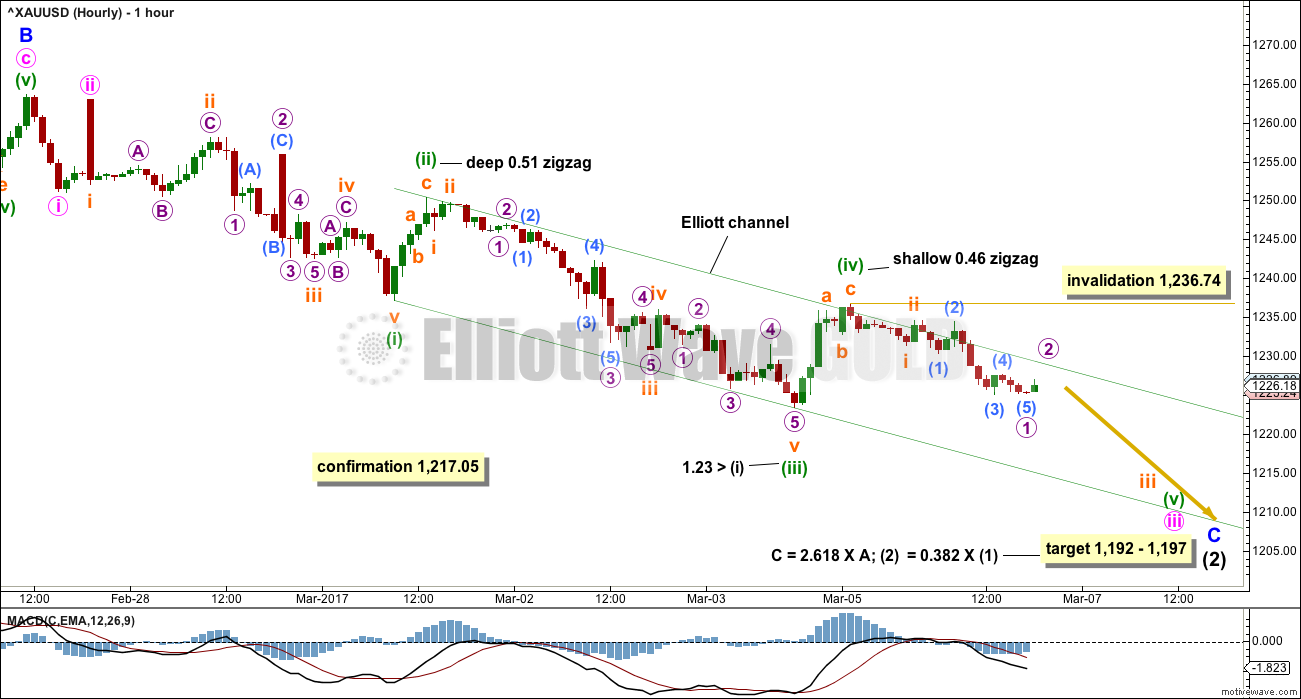
Minor wave C must subdivide as a five wave structure, either an impulse or an ending diagonal. It does look more likely that an impulse is developing at this stage, but it is not possible to rule out a diagonal.
Minute waves i and ii are seen still as complete. Minute wave iii is seen still as incomplete.
Minute wave iii may only subdivide as an impulse. It is common for Gold to exhibit very strong extended fifth waves within its third wave impulses. Look out for minuette wave (v) to be very strong, possibly ending with a selling climax.
Monday’s session shows weakness. MACD does not indicate an increase in momentum. This weakness reduces the probability of this first hourly chart to less than the second hourly chart below. It would be my judgement today that this first hourly chart now has a probability of about 30%.
If minuette wave (iii) is over as labelled on this chart, then it is reasonably close to equality in length with minuette wave (i), close enough to say they exhibit a Fibonacci ratio. Importantly, minuette wave (iii) is longer than minuette wave (i), so the core Elliott wave rule stating a third wave may not be the shortest is met. What this means is that minuette wave (v) is not limited in length now by minuette wave (iii). It may be extended.
Within minuette wave (v), no second wave correction may move beyond the start of its first wave above 1,236.74.
If this wave count is right, then each time the upper edge of the channel is touched represents an opportunity to join the short term downwards trend.
SECOND HOURLY CHART
Click chart to enlarge.
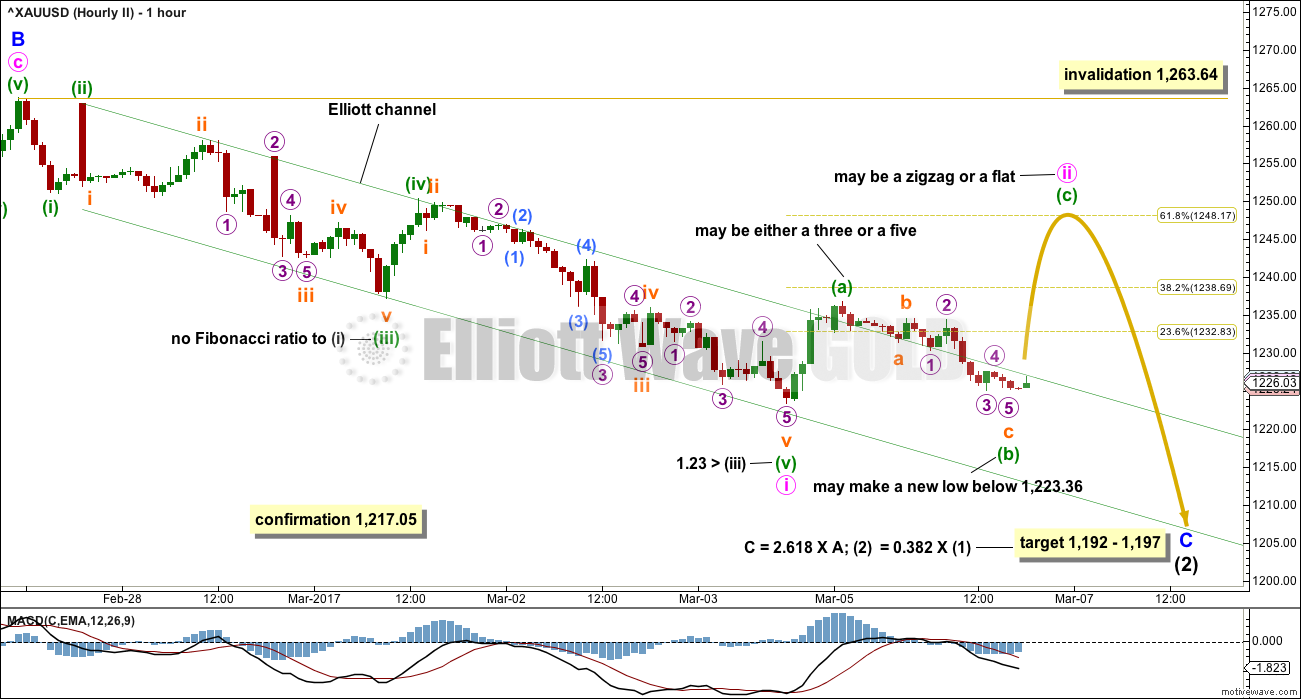
It is possible that a five wave impulse downwards completed on Friday. This may be minute wave i within the impulse of minor wave C.
Minute wave ii may correct to about the 0.618 Fibonacci ratio at 1,248. Second waves are most commonly deep.
Minute wave ii may be any corrective structure except a triangle. If it is an expanded flat or combination, then it may include a new low below its start, below 1,223.36.
The small upwards wave labelled minuette wave (a) looks to be too brief and too shallow to be minute wave ii in its entirety. This is more likely just minuette wave (a).
Minuette wave (a) may be seen as either a five wave impulse or a three wave zigzag. If it is a five, then minuette wave (b) may not move beyond its start. If it is a three, then minuette wave (b) may make a new low below its start.
The most likely point for minute wave ii to end would still be the 0.618 Fibonacci ratio.
So far minuette wave (b) has not made a new low below the start of minuette wave (a). Minuette wave (b) shows weakness with MACD indicating weak momentum and volume today light. This is typical of B waves. The weakness supports the second hourly chart over the first.
It would be my judgement today that this second hourly chart has about a 70% probability.
ALTERNATE ELLIOTT WAVE COUNT
DAILY CHART
Click chart to enlarge.
Minute wave ii may not move beyond the start of minute wave i below 1,217.05.
The black base channel about intermediate waves (1) and (2) should provide support to lower degree second wave corrections along the way up. Minute wave ii should be over here. The fact today that it is not providing support indicates this alternate wave count has reduced in probability. The probability today is judged to be too low to provide an hourly chart for it because that would give it too much weight.
If the lower edge of this base channel is breached, then this alternate wave count may be discarded prior to invalidation with a new low below 1,217.05.
At this stage, the lower edge of the base channel is overshot but not breached. A breach would constitute a full daily candlestick below and not touching the lower edge.
TECHNICAL ANALYSIS
WEEKLY CHART
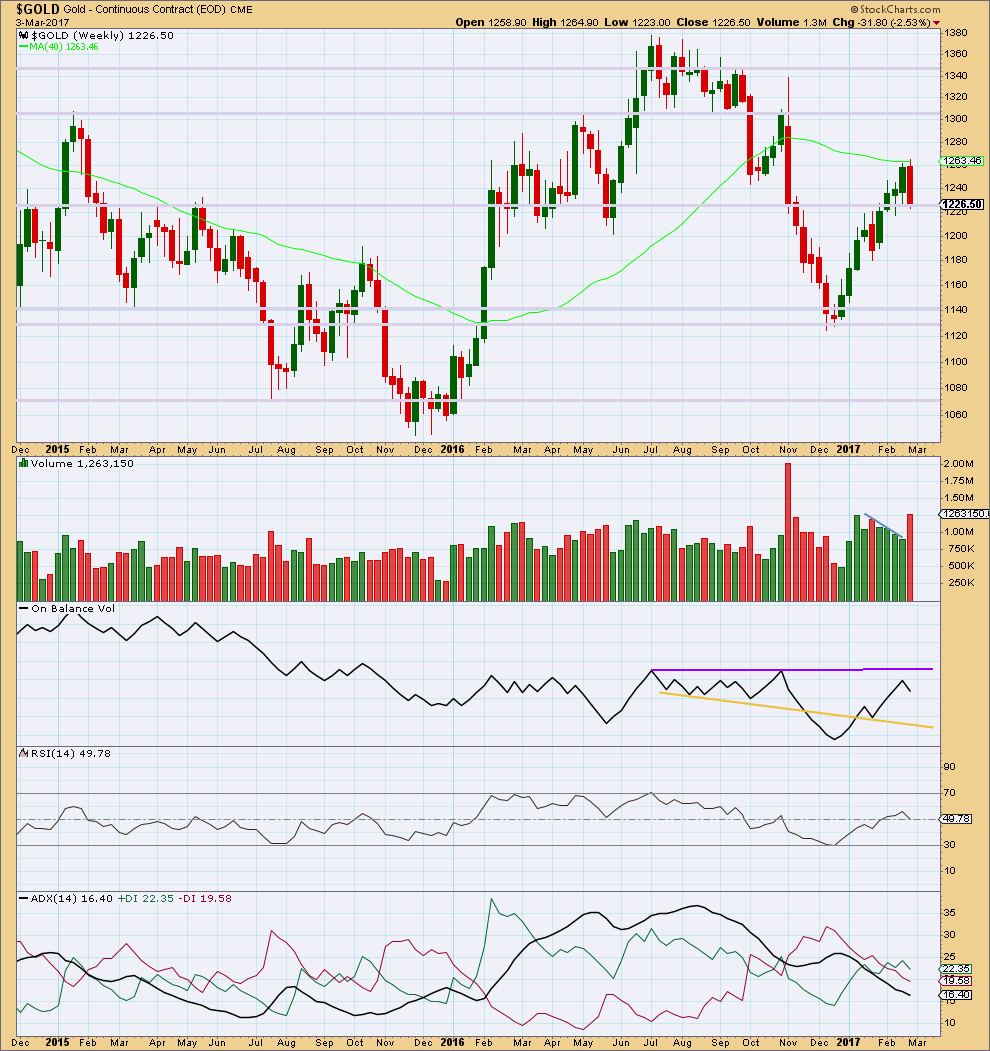
Click chart to enlarge. Chart courtesy of StockCharts.com.
The prior four upwards weeks are all green and showed a decline in volume. Now last week is red and shows a strong increase in volume. Last weekly candlestick completes a bearish engulfing candlestick pattern, the most reliable reversal pattern.
This indicates strongly that upwards movement is over for now. Either sideways or downwards movement from here is a reasonable expectation.
On Balance Volume has still not found resistance.
ADX still indicates the market is not yet trending at the weekly time frame.
DAILY CHART
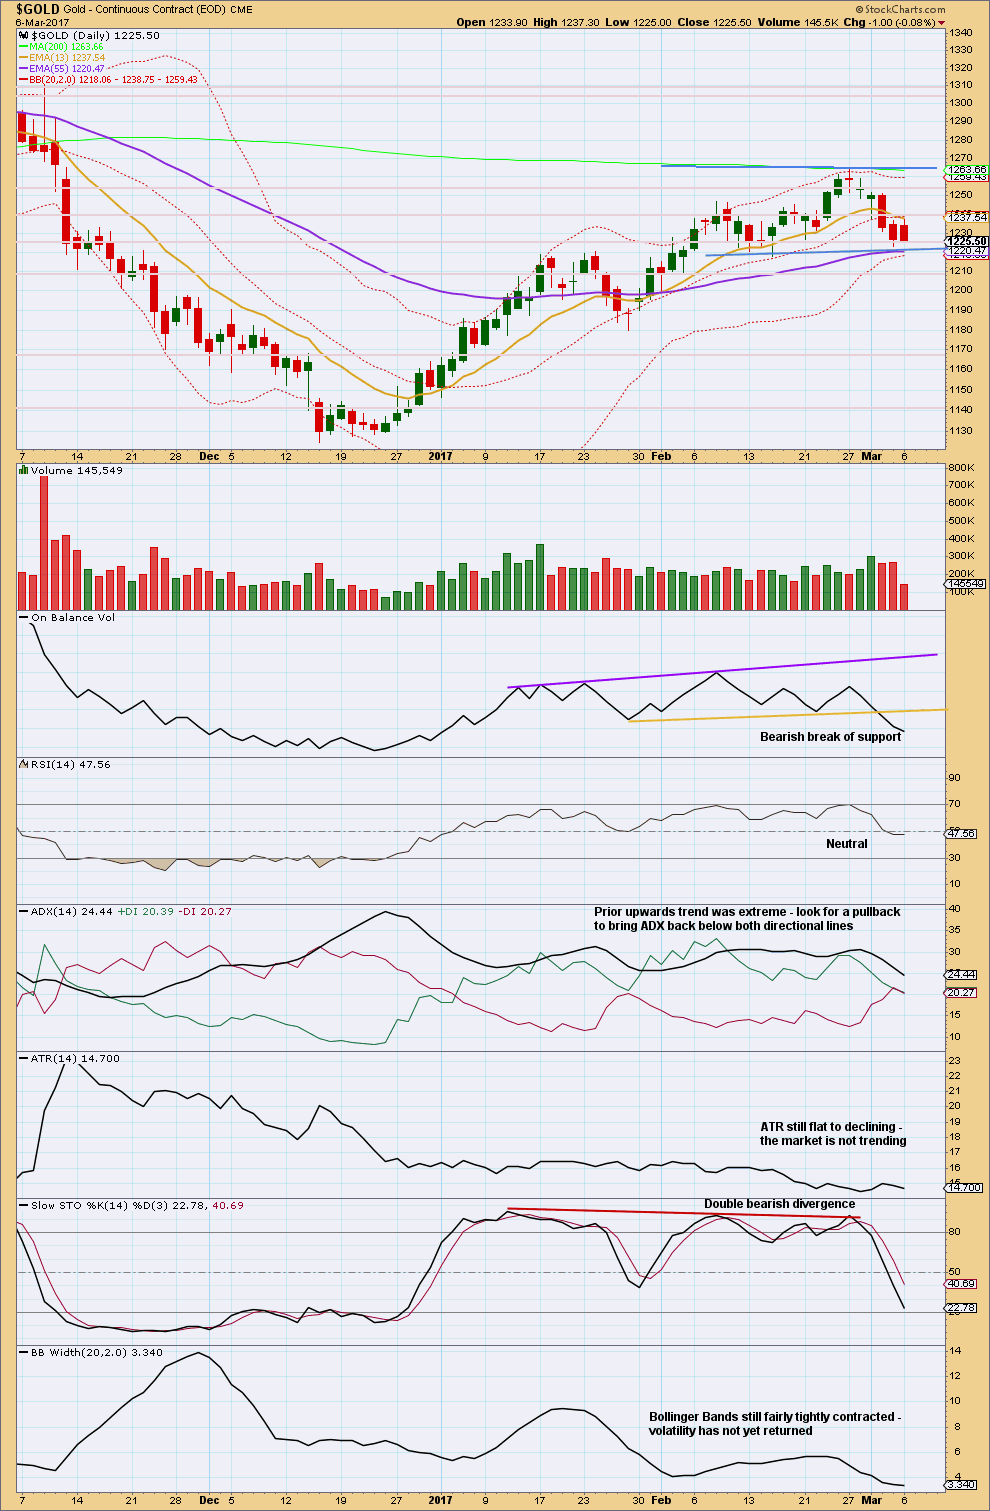
Click chart to enlarge. Chart courtesy of StockCharts.com.
There is strong support for price about 1,220, the lower edge of the prior consolidation.
Monday saw a higher high and a higher low, the definition of upwards movement. But the candlestick has closed red and the balance of volume during the session was down. Lighter volume during the session does not support the fall in price.
ADX is still not down below the directional lines. This pullback likely has further to go and this too is bearish.
Stochastics is not yet oversold and this too is bearish.
Bollinger Bands are contracting further. If this is a counter trend movement, then that makes sense. This is neither bullish nor bearish.
On Balance Volume now is giving a very clear bearish signal. This should be taken very seriously. This supports the main Elliott wave count strongly over the alternate.
GDX
DAILY CHART
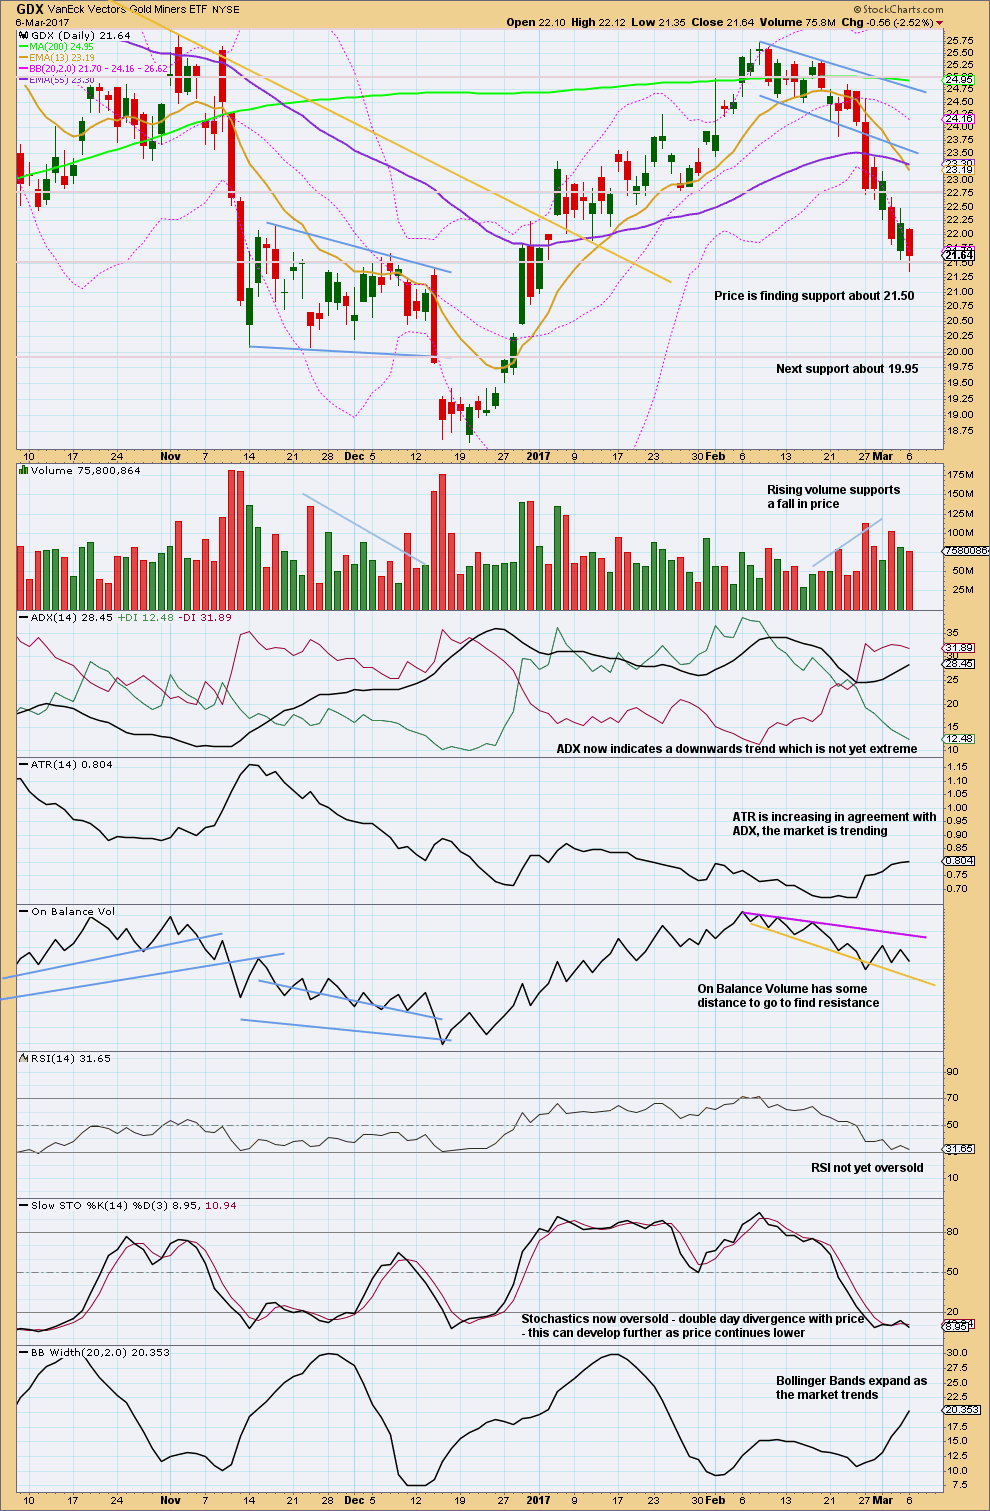
Click chart to enlarge. Chart courtesy of StockCharts.com.
Price has moved lower the last two days, now on declining volume. Sometimes GDX does this; the market is falling of its own weight. If this pattern persists, then expect a consolidation or trend change.
This chart remains overall fairly bearish. Expect next support about 19.95.
This analysis is published @ 08:08 p.m. EST.
First hourly chart updated:
Each time price comes up to touch the upper edge of the channel may present an opportunity to join the new short term downwards trend.
This is for more risk tolerant aggressive traders only. Reduce position size to only 1-3% of equity, always use a stop. This is a counter trend movement, the larger trend on the daily chart level is up. So trading against the trend is more risky here.
This counter trend movement may continue for a few days, so for a few days the short term trend is down.
If this hourly chart is the right one then look out for a strong increase in momentum downwards. For Gold’s third wave impulses it quite often exhibits swift sharp fifth waves. Subminuette v of minuette (v) of minute iii may be a strong extension, ending with a selling climax.
The alternate daily chart is invalidated. A deeper pullback now looks extremely likely to continue lower.
The focus now is on the first and second hourly charts. Which one is right? Are there other ways to label this new wave down? When will a bounce happen?
At this stage the second hourly chart has now substantially decreased in probability. The first has increased.
The second now may see an expanded flat unfolding for minute ii. But minuette (b) is now 1.67 X minuette (a). This is longer than the common length of up to 1.38 but not yet at the maximum acceptable limit of 2. But it’s close to 2. So the probability is reducing.
“Vault 7” …this will likely turn out to be the most globally significant news of our lifetime. The Achilles heal of the Deep State is perhaps finally exposed.
Hi Lara,
I know you can’t update Trading Room until Friday, but when you do, I am putting a vote in for the US Dollar on a Daily and Wkly basis, if possible.
Thanks much…
Sure. It’s got a beautiful trend line we can use to enter long. It’s trending up.
Helo Lara, will you be updating the US oil analysis this week?
Yes, I’ll be updating it today.
Is it possible wave c of flat be truncated by less than $6? Instead of expanded flat it becomes running flat??? May be I do not understand flats.
I feel there is huge resistance at 1220 going back to Nov of 2016.
Thanks
It’s possible, but when running flats turn up the truncation is normally small.
A running flat with a large truncation is not something that I have ever seen happen.
The probability is so ridiculously low it shouldn’t be considered.
I’m looking for 1215.09, the 1.618 retrace of subminuette a, for the 2nd Hourly Count. Thereafter, it ought to rise by 2.618 to the 1248 – 1250 region.
As it stands, the Main Count is already too tortuous. It is so tedious to count down to the lower degree waves.
Maybe expanded flat for minute ii?
1223 -> 1237 -> (1220) -> ?1247
Looks like the spike down in Silver I was expecting is underway. I would not be surprised to see an intra-day reversal. I continue to ladder into long trades on the move down….
A look at GDXJ
https://www.tradingview.com/x/hNCkrsG5/
Thanks for that update. Not sure if gold is going to bounce or not, but that gives a good entry point should that scenario unfold.
GDX – no clear signs that the bottom is in, but it could be in or getting close.
https://www.tradingview.com/x/MWsZBLM2/
There doesn’t appear to be any significant divergence on the GDX daily chart yet. Looking at the hourly chart, we see a possible bullish descending wedge, yet price appears to have broken below a trend line with multiple touches going back to mid November.
RSI is showing some positive divergence and STOC is showing very slight positive divergence. OBV may be in a falling wedge also. This could be bullish short term if price breaks above the falling trend line and back above the horizontal resistance.
https://www.tradingview.com/x/uUqUbD3P/
Thank you Lara. Your word is like a Gold.
Love It.
🙂 You’re welcome Papudi