
Today’s Trading Room looks at US Oil only.
To learn what the Trading Room is about see first Trading Room analysis here.
Trading Room will focus on classic technical analysis. Elliott wave analysis will be for support and for targets / invalidation points.
US Oil (WTI Crude – Spot)
TECHNICAL ANALYSIS
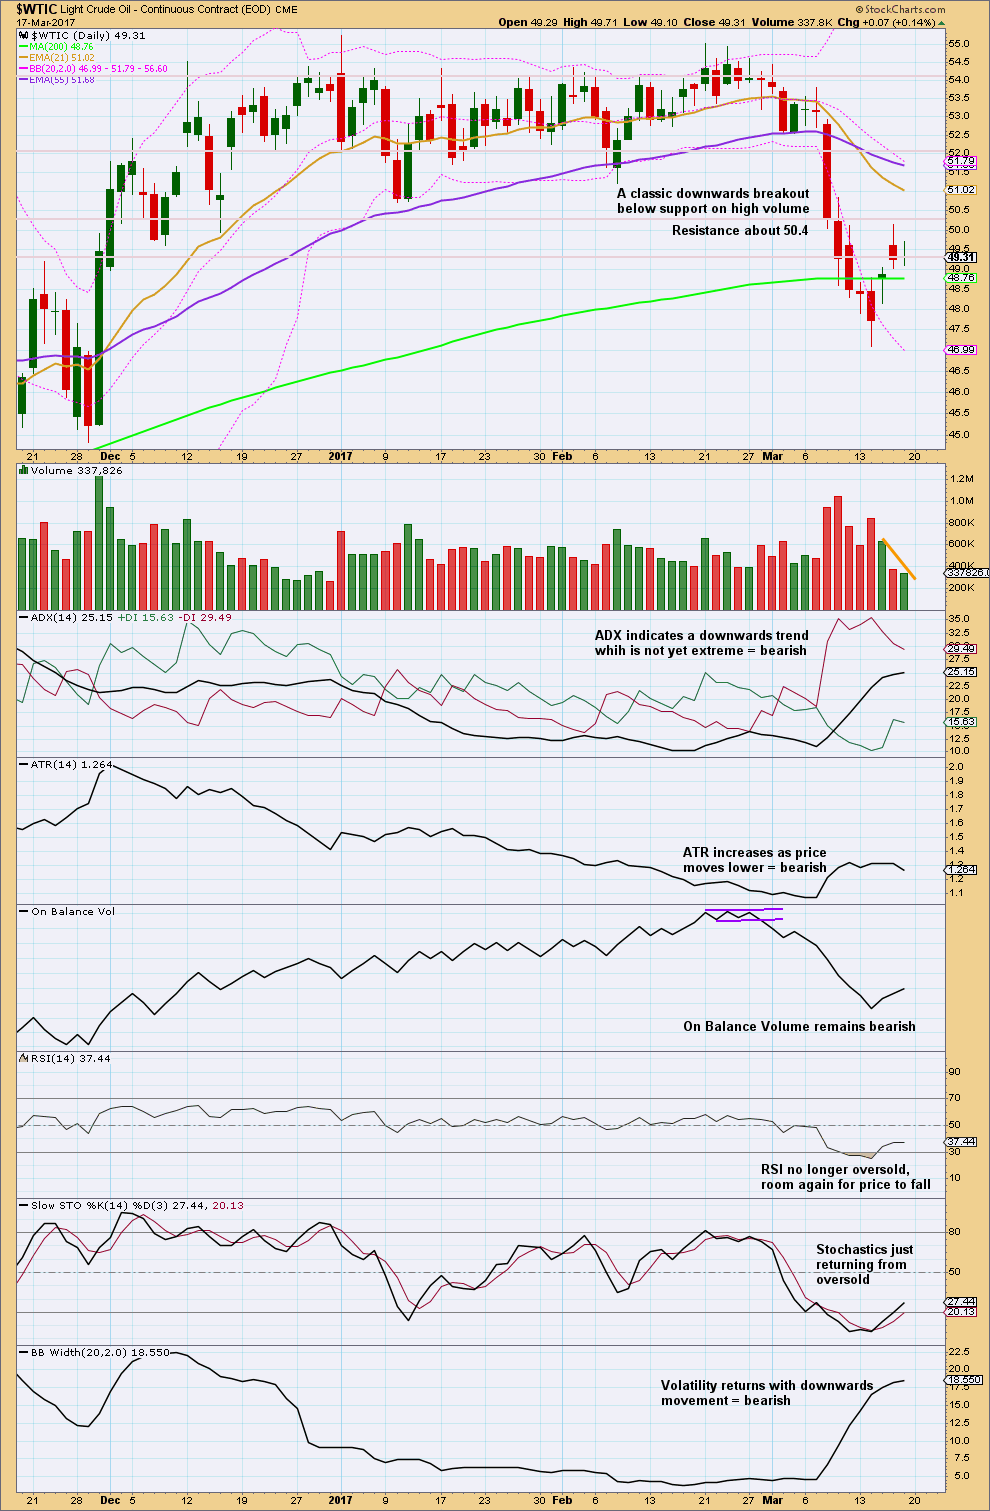
Click chart to enlarge. Chart courtesy of StockCharts.com.
US Oil is in a clear downwards trend that is not yet extreme. There will be corrections along the way; price does not move in a straight line. Corrections within a trend present an opportunity to join the trend. The challenge is to find when the correction is over.
Price was previously range bound for a long period of time with support about 51.22 to 50.70. On the 8th of March price broke below support on a strong downwards day with strong volume. This was a classic downwards breakout.
It looks now like Oil is in a small correction, curving up to find resistance at prior support about 50.70.
ELLIOTT WAVE ANALYSIS
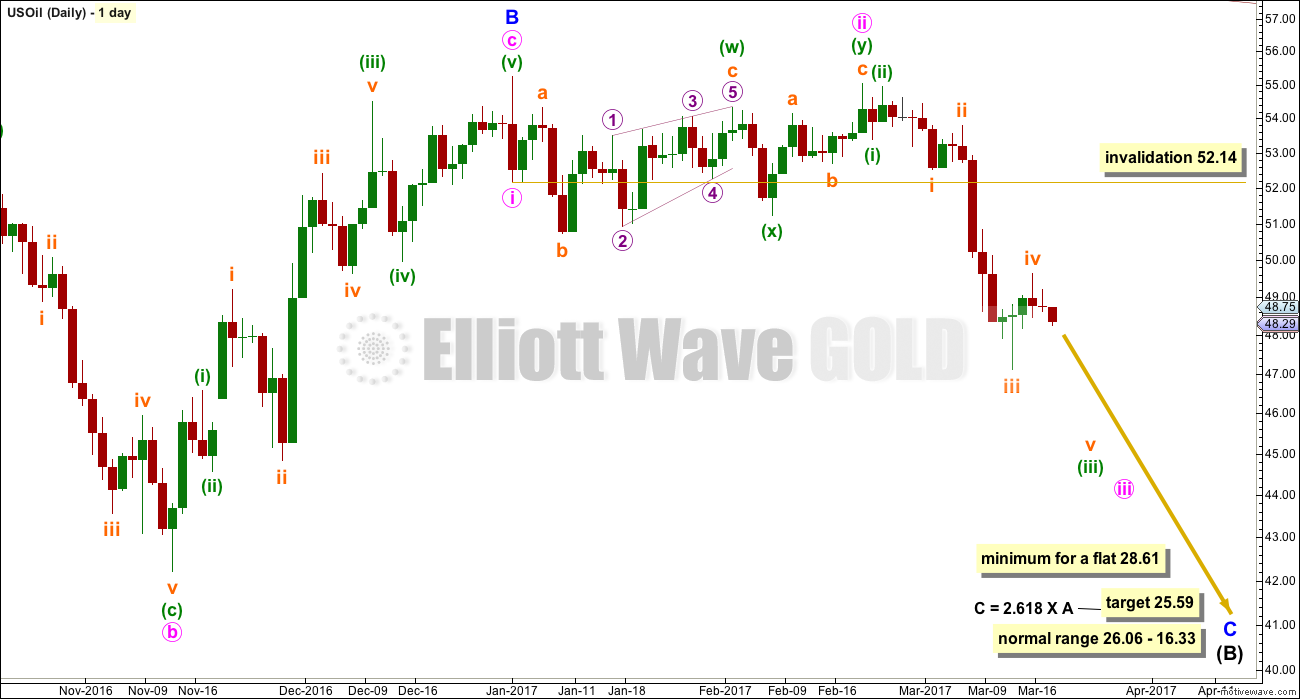
Click chart to enlarge.
A larger flat correction may be unfolding for a fourth wave (EWG members should refer to the US Oil monthly chart for the bigger picture here). Within a flat correction, intermediate wave (B) must retrace a minimum 0.9 length of intermediate wave (A) at 28.61.
Trading advice for members only: [wlm_private “GOLD Daily YT|GOLD Daily NT|GOLD Daily NTGR|GOLD DAILY 6M NT|GOLD DAILY 6M YT|GOLD DAILY 6M NT GFR|GOLD Plus Daily YT|GOLD Plus Daily NT|OIL SILVER Weekly YT|OIL SILVER Weekly NT|GOLD Plus Daily 6M NT|GOLDPLUSDAY6M|OIL SILVER Weekly 6M NT|GOLDPLUSDAY1M|GOLDPLUSDAY1MYT|GOLDDAY6M|GOLDDAY1M|GOLDDAY1MYT|OILSILVERWEEK6M|OILSILVERWEEK1M|OILSILVERWEEK1MYT”]Stops for short positions may be set back within the prior consolidation zone, about 50.75. Targets may be 28.61. Be prepared to have an underwater position for up to about three days if the small correction continues. More patient traders may like to set stops higher about 51.25.[/wlm_private]
DISCLAIMER
As always, it is essential that anyone using this analysis for trading advice manages risk carefully. Follow my two Golden Rules:
1. Always use a stop.
2. Never invest more than 1-5% of equity on any one trade.
Trading is about probabilities, not certainties. Failure to follow my two Golden Rules of trading indicates failure to manage risk.
Accept that this analysis may be wrong. It is impossible for any analyst to predict with certainty what a market will do next.
TRADING ROOM SUMMARY TABLES
OPEN POSITIONS
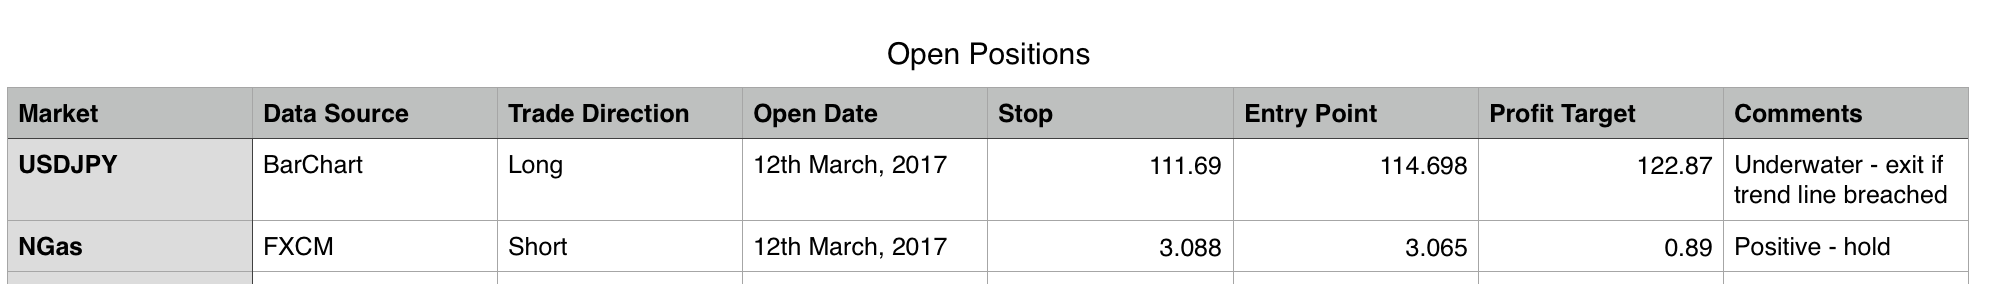
Click table to enlarge.
CLOSED POSITIONS
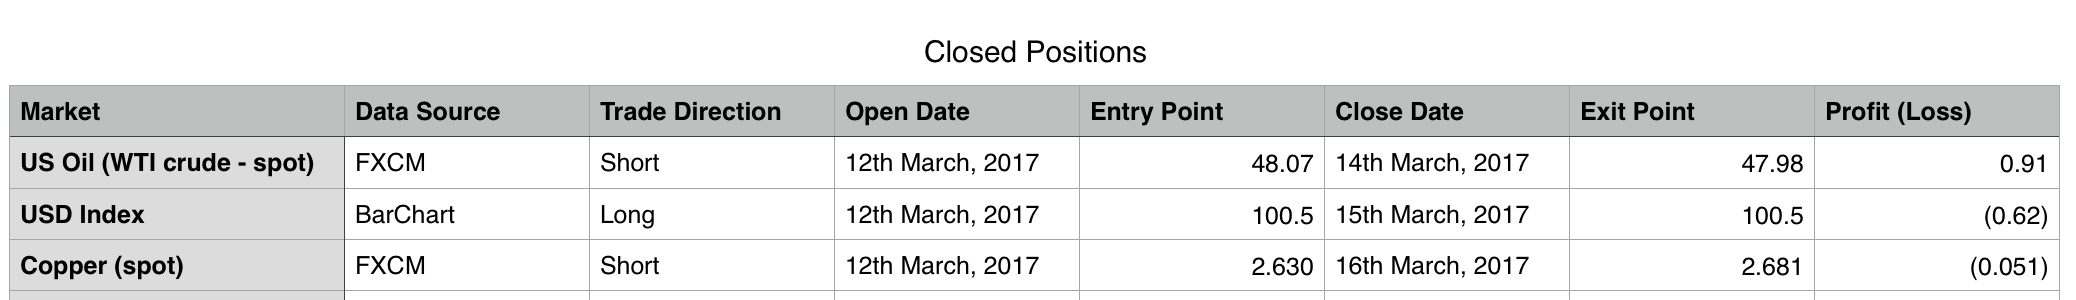
Click table to enlarge.
RECOMMENDATIONS
[wlm_private “GOLD Daily YT|GOLD Daily NT|GOLD Daily NTGR|GOLD DAILY 6M NT|GOLD DAILY 6M YT|GOLD DAILY 6M NT GFR|GOLD Plus Daily YT|GOLD Plus Daily NT|OIL SILVER Weekly YT|OIL SILVER Weekly NT|GOLD Plus Daily 6M NT|GOLDPLUSDAY6M|OIL SILVER Weekly 6M NT|GOLDPLUSDAY1M|GOLDPLUSDAY1MYT|GOLDDAY6M|GOLDDAY1M|GOLDDAY1MYT|OILSILVERWEEK6M|OILSILVERWEEK1M|OILSILVERWEEK1MYT”]
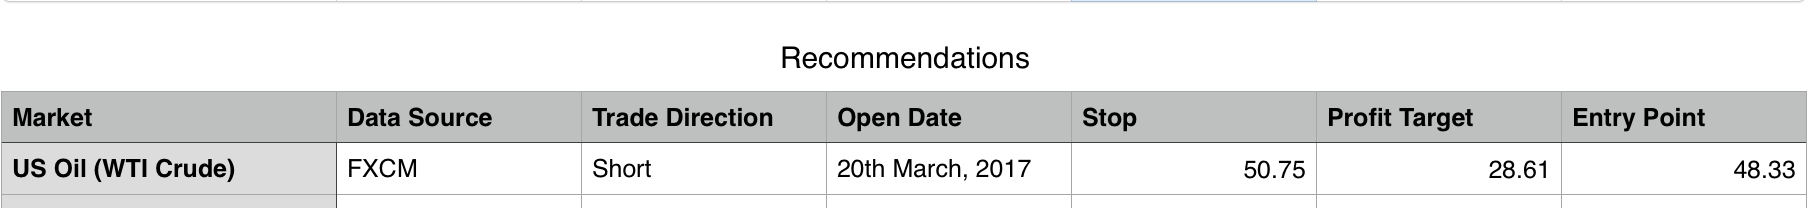
Click table to enlarge.[/wlm_private]
This analysis is published @ 02:16 a.m. EST.