
Today’s Trading Room looks at Copper, USD Index and DAX.
To learn what the Trading Room is about see first Trading Room analysis here.
Trading Room will focus on classic technical analysis. Elliott wave analysis will be for support and for targets / invalidation points.
Copper
TECHNICAL ANALYSIS
Click chart to enlarge. Chart courtesy of StockCharts.com.
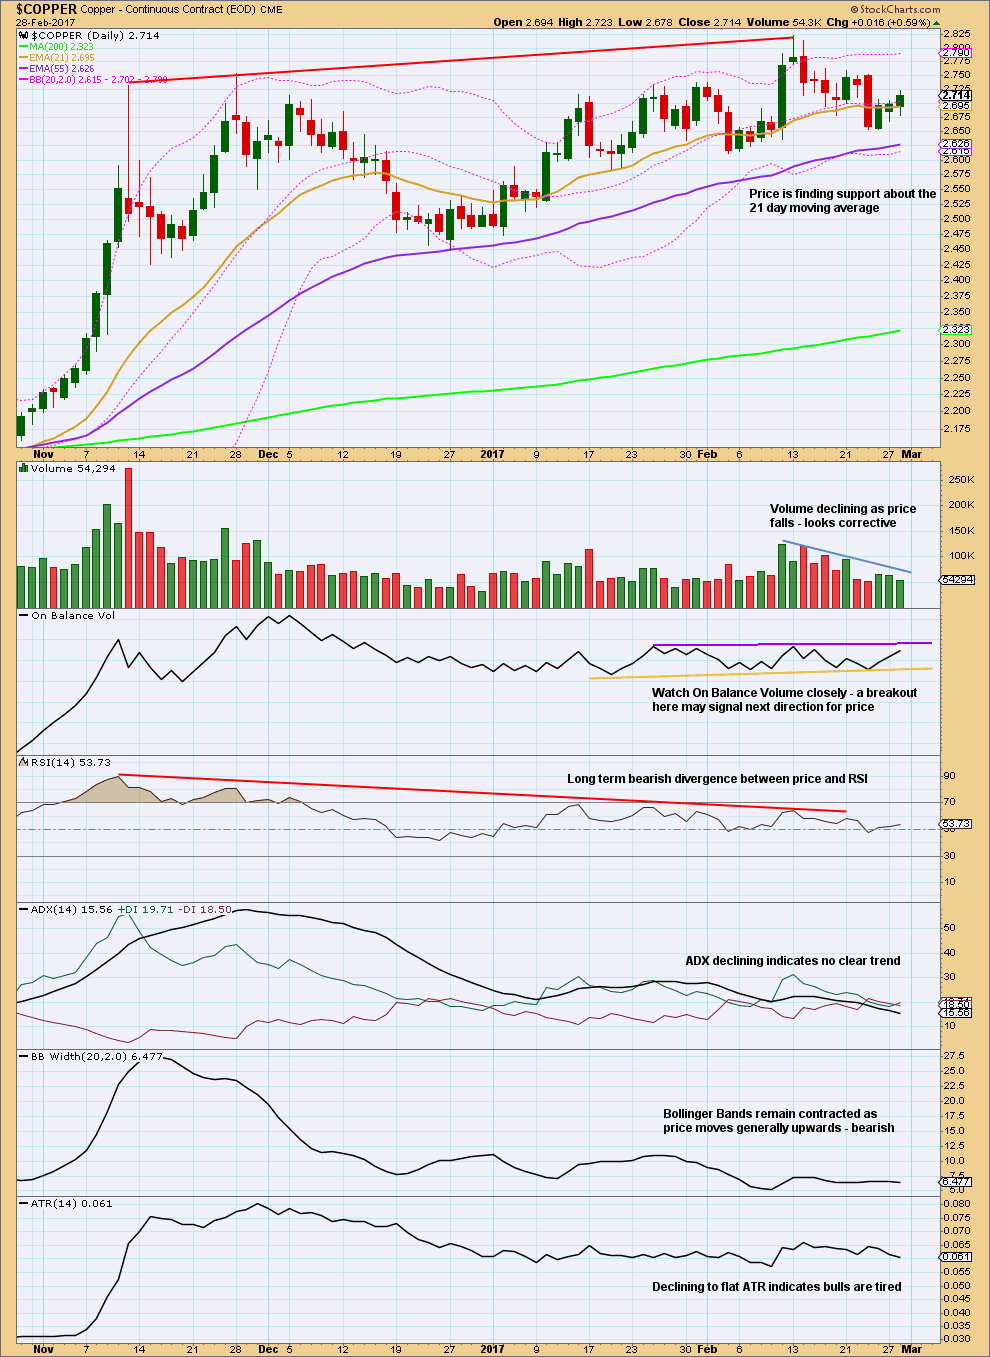
This analysis is overall neutral, neither bullish nor bearish. ADX is now declining after reaching extreme. Divergence with price and RSI (red lines) is bearish. Either a larger consolidation or a trend change is a reasonable expectation at this time, but no trend change has yet been indicated.
Volume is so far inconclusive. Sometimes at the beginning of a bear move volume can be light as the market falls of its own weight. However, light and declining volume does not support the fall in price so far.
TREND LINE ANALYSIS
Click chart to enlarge.
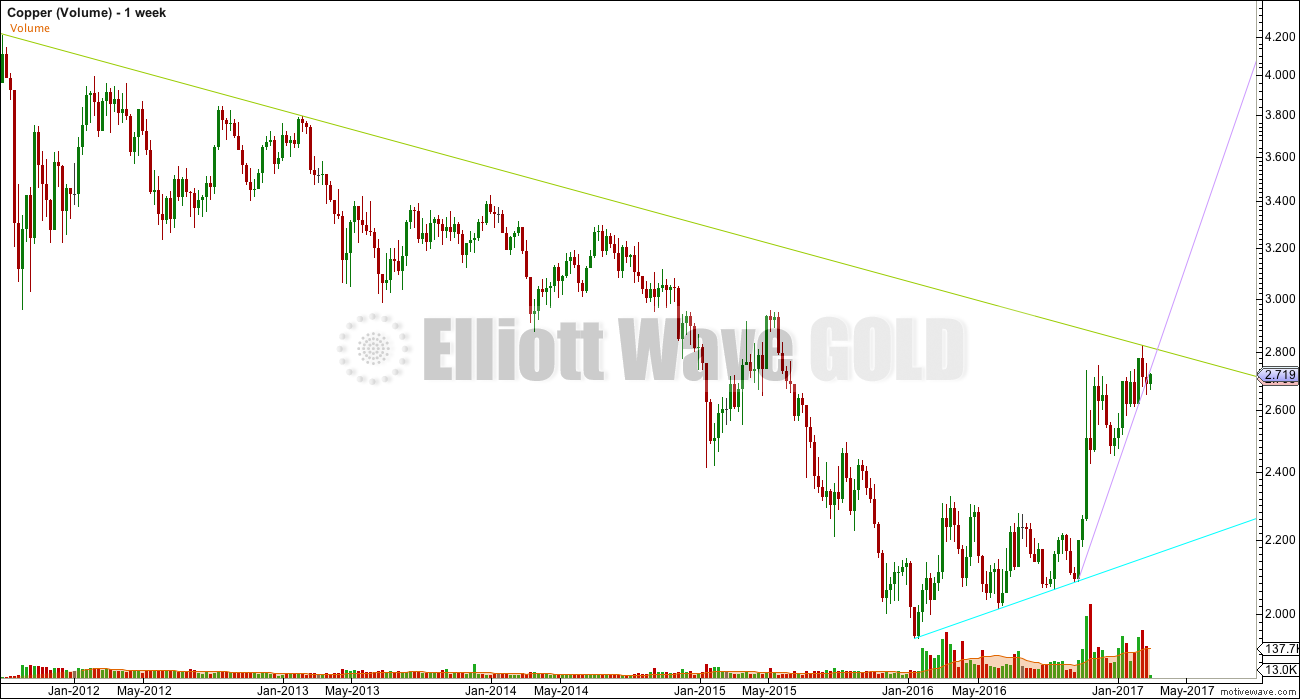
The long term green line was perfectly touched just three weeks ago. This may provide strong resistance. The lilac line has now been breached (this is seen more clearly on the chart below). However, this lilac line is too steep for reasonable technical significance. That is the risk at this time with this analysis.
ELLIOTT WAVE ANALYSIS
Click chart to enlarge.
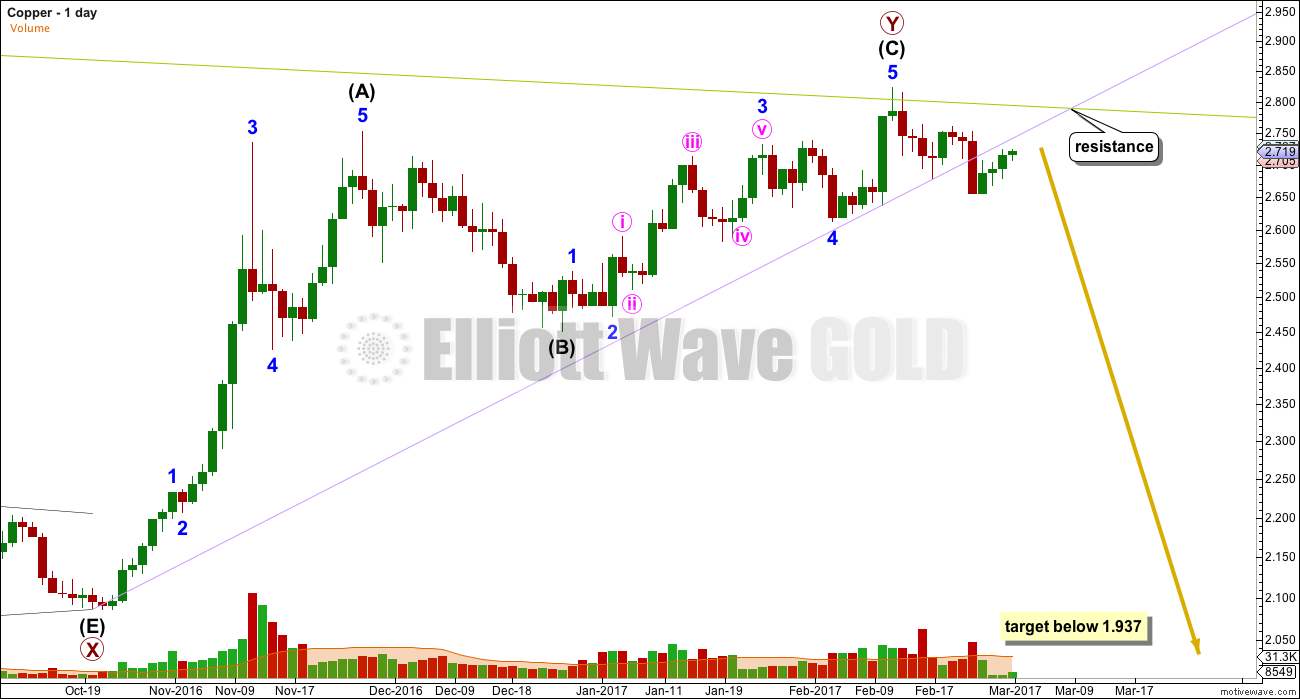
The lilac line has been breached and price has now turned up to find resistance there. If the green line holds, then this lilac line should too.
Trading advice for members only: [wlm_private “GOLD Daily YT|GOLD Daily NT|GOLD Daily NTGR|GOLD DAILY 6M NT|GOLD DAILY 6M YT|GOLD DAILY 6M NT GFR|GOLD Plus Daily YT|GOLD Plus Daily NT|OIL SILVER Weekly YT|OIL SILVER Weekly NT|GOLD Plus Daily 6M NT|GOLDPLUSDAY6M|OIL SILVER Weekly 6M NT|GOLDPLUSDAY1M|GOLDPLUSDAY1MYT|GOLDDAY6M|GOLDDAY1M|GOLDDAY1MYT|OILSILVERWEEK6M|OILSILVERWEEK1M|OILSILVERWEEK1MYT”]If entering short here, stops may be set just above the last high on the 13th of February at 2.823. Give the market room to move, and be prepared to have an underwater position for one to three days. A target may be 1.937, in the first instance, although this may be too optimistic. If price moves down and away strongly, then move stops to breakeven to reduce risk. Always follow my two Golden Rules.[/wlm_private]
USD Index
TECHNICAL ANALYSIS
Click chart to enlarge. Chart courtesy of StockCharts.com.
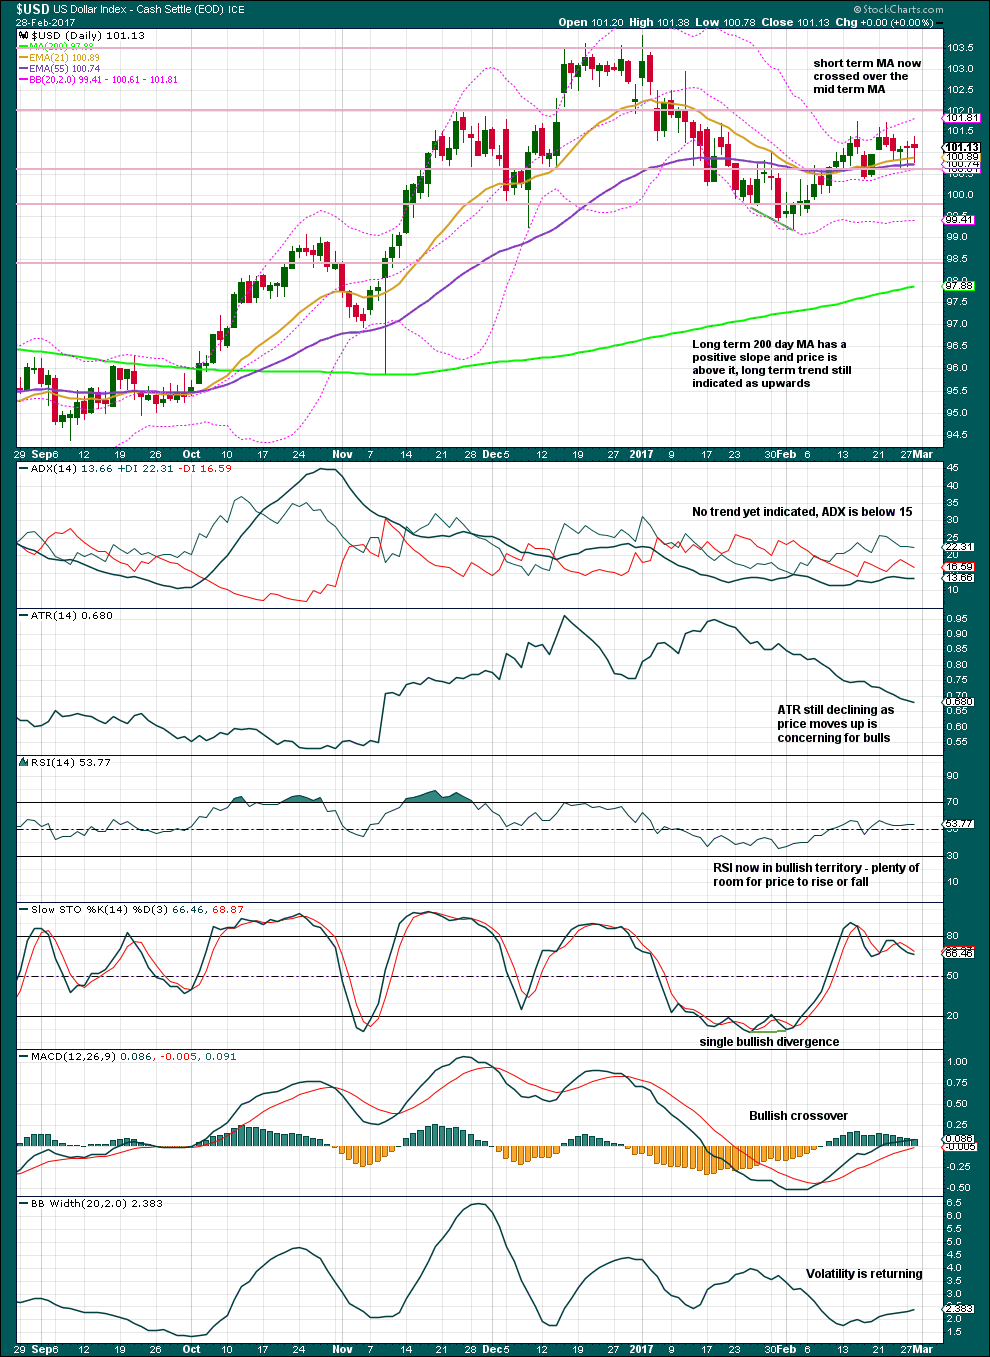
This market so far is moving upwards as has been expected. I am publishing this chart again today because at this time it may be offering a good opportunity to join a trend in the relatively early stages.
ADX is below 15, so no trend is yet indicated. ATR is still declining. These two indicators together signal caution about a potential upwards trend.
RSI is neutral. MACD and Bollinger Bands are bullish.
I particularly want to draw attention to the long lower wicks of the last three daily candlesticks. These are bullish.
ELLIOTT WAVE ANALYSIS
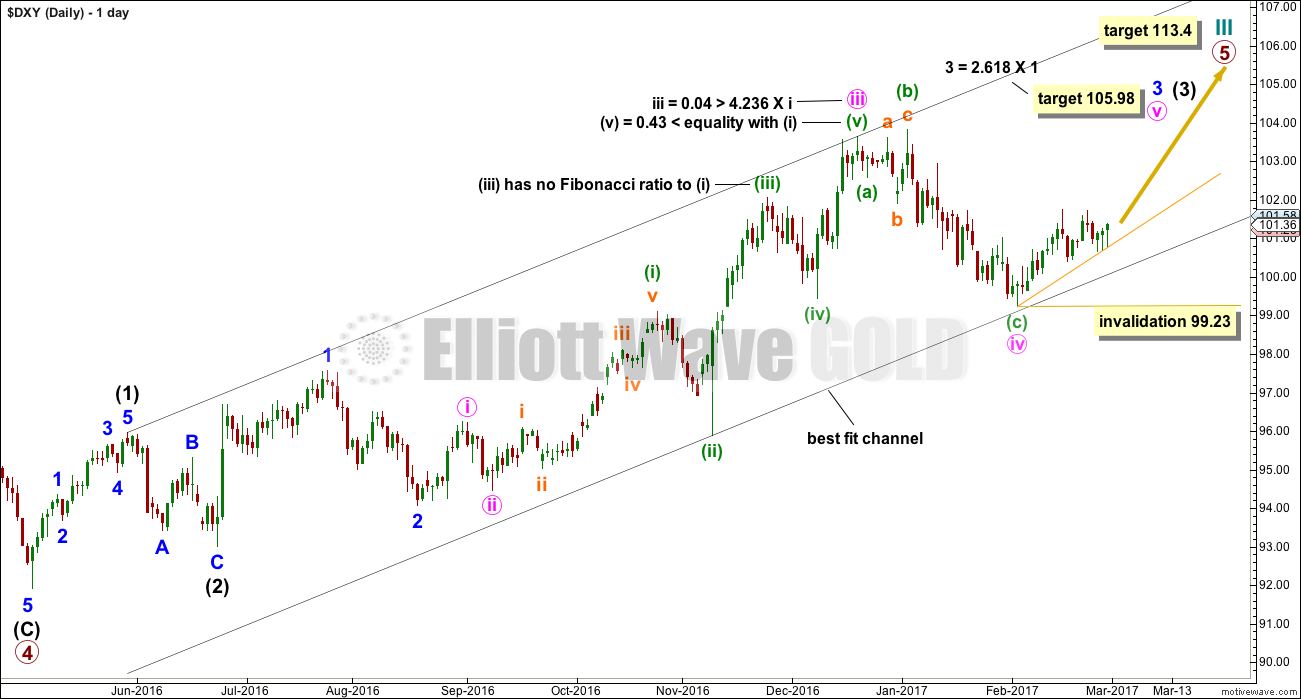
Click chart to enlarge.
This chart is the same as the last published daily Elliott wave chart for USD Index with the exception of the short term support line which is slightly redrawn. Notice the long lower wicks on the last three daily candlesticks and how they all sit neatly on the trend line.
Trading advice for members only: [wlm_private “GOLD Daily YT|GOLD Daily NT|GOLD Daily NTGR|GOLD DAILY 6M NT|GOLD DAILY 6M YT|GOLD DAILY 6M NT GFR|GOLD Plus Daily YT|GOLD Plus Daily NT|OIL SILVER Weekly YT|OIL SILVER Weekly NT|GOLD Plus Daily 6M NT|GOLDPLUSDAY6M|OIL SILVER Weekly 6M NT|GOLDPLUSDAY1M|GOLDPLUSDAY1MYT|GOLDDAY6M|GOLDDAY1M|GOLDDAY1MYT|OILSILVERWEEK6M|OILSILVERWEEK1M|OILSILVERWEEK1MYT”]If entering long here, stops may be set either just a little below the trend line (with the risk of a whipsaw stopping the position out before price turns back up) or more properly just below 99.23. Allow the market some room to move because the trend line may not be perfect. Adjust position size down if setting stops further away, so that the Golden Rules are met. Initial profit target may be 105.98.[/wlm_private]
DAX
TECHNICAL ANALYSIS
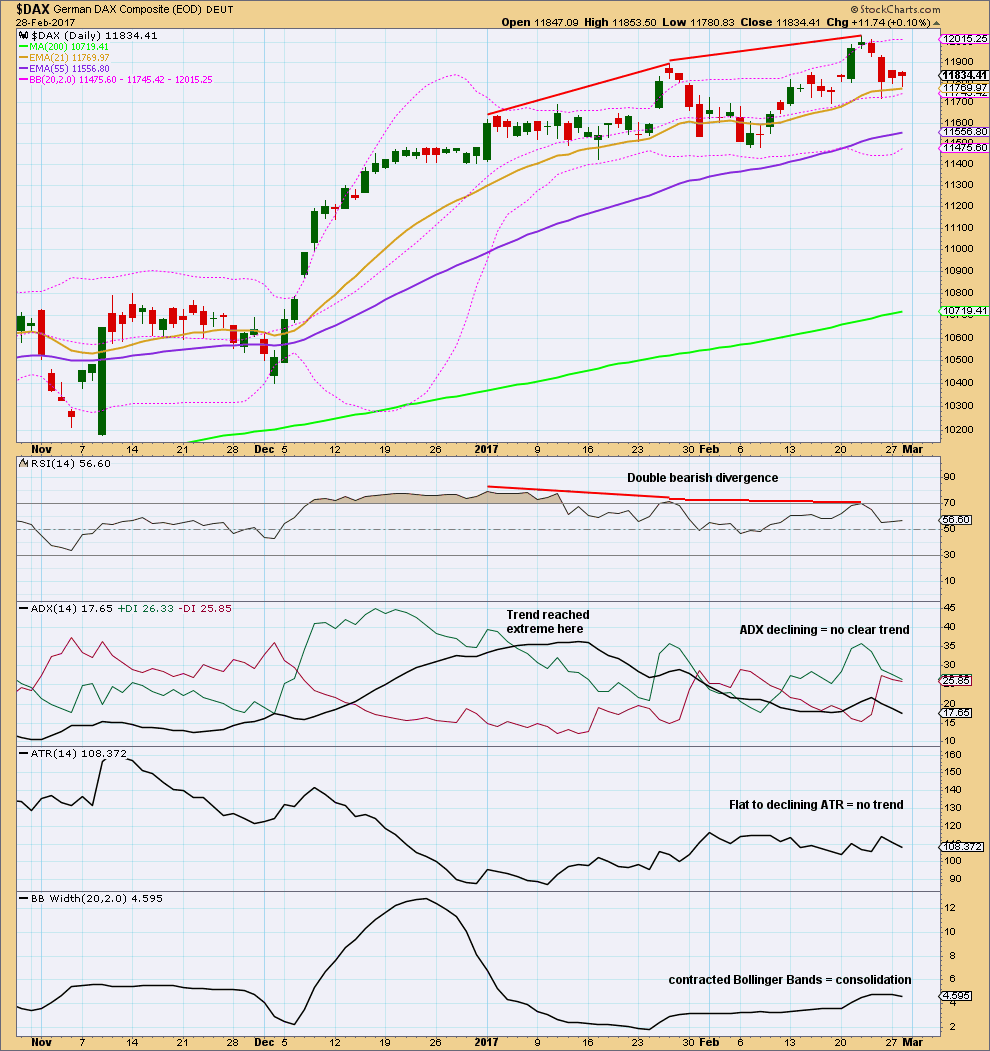
Click chart to enlarge. Chart courtesy of StockCharts.com.
Analysis of DAX is presented in response to a reader’s request and not because it offers a good opportunity at this time.
Some larger sideways consolidation or a deeper pullback here is a reasonable conclusion after ADX reached extreme and RSI exhibited double bearish divergence over a reasonable period of time. At this time, it looks like DAX is in a consolidation with an upwards bias. The risk here is a deeper pullback may develop.
VOLUME ANALYSIS
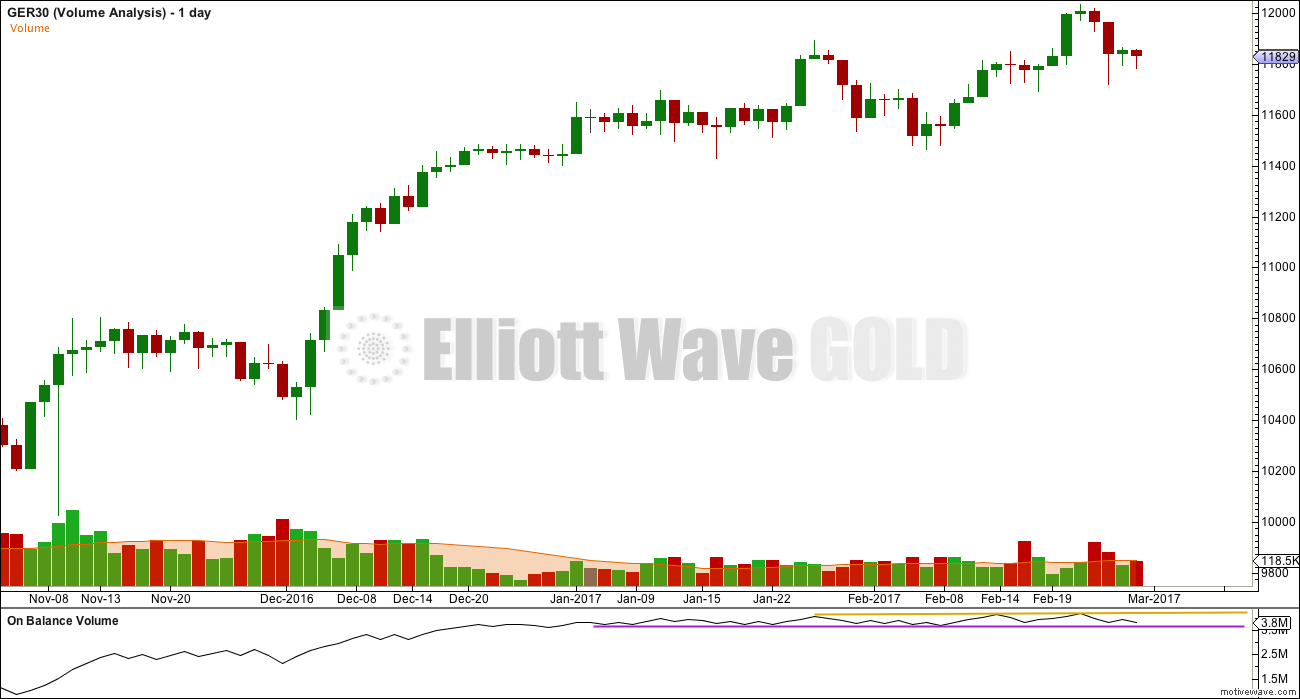
Click chart to enlarge.
StockCharts do not offer volume data for international indices. This is FXCM volume data.
Watch On Balance Volume closely over coming days. If it breaks out of the current range, that may precede the next direction for price.
Strongest volume of recent days is for downwards days. This is bearish.
ELLIOTT WAVE ANALYSIS
QUARTERLY CHART

Click chart to enlarge.
A Super Cycle fifth wave may be completing. Super Cycle (IV) may have been a large contracting triangle, or it may have been a more brief zigzag (alternate weekly chart below).
MONTHLY CHART
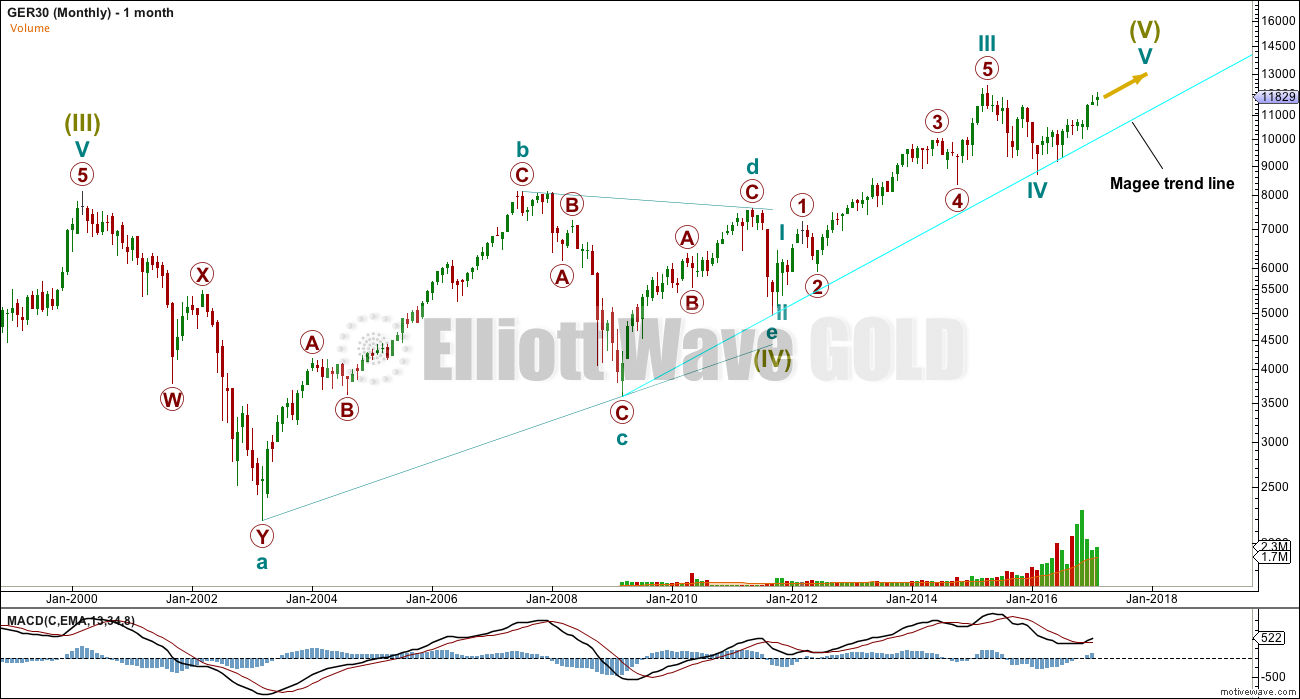
Click chart to enlarge.
The triangle fits, but it is not supported by MACD hovering about zero. This is not a requirement but does add confidence when it occurs.
WEEKLY CHART
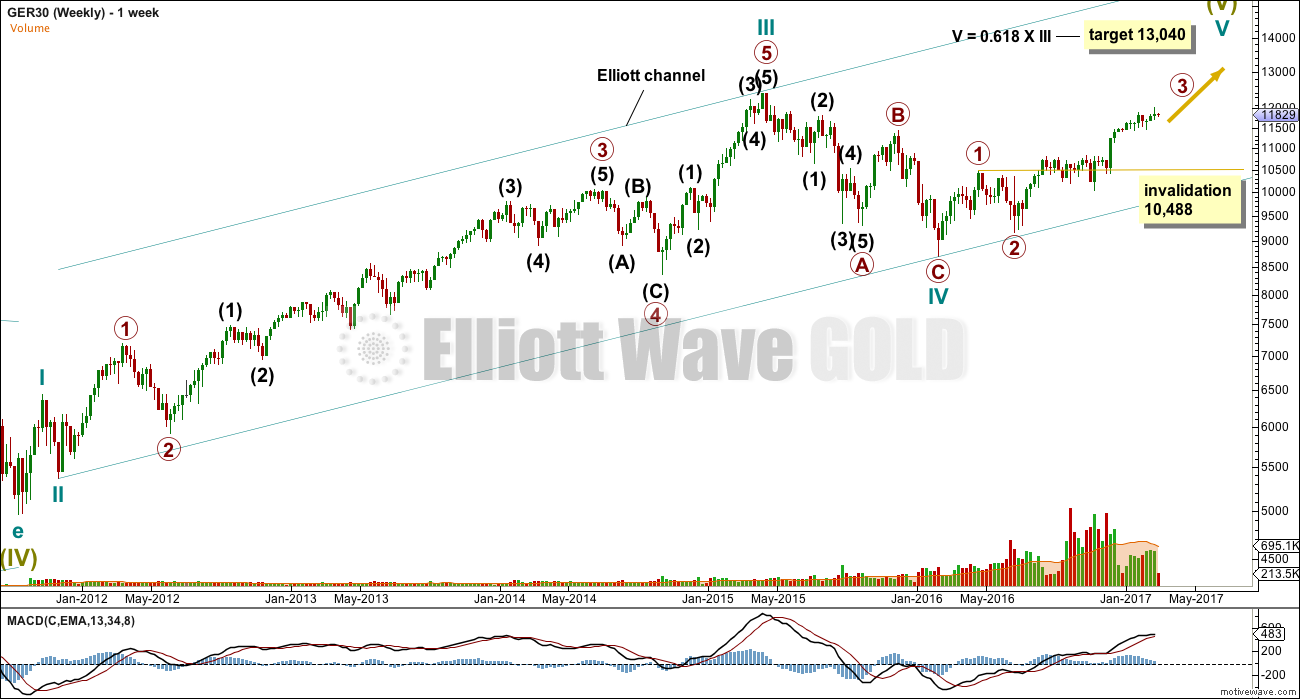
Click chart to enlarge.
The weekly chart shows all of Super Cycle wave (V) to date. Primary wave 4 may not move into primary wave 1 price territory below 10,488.
DAILY CHART
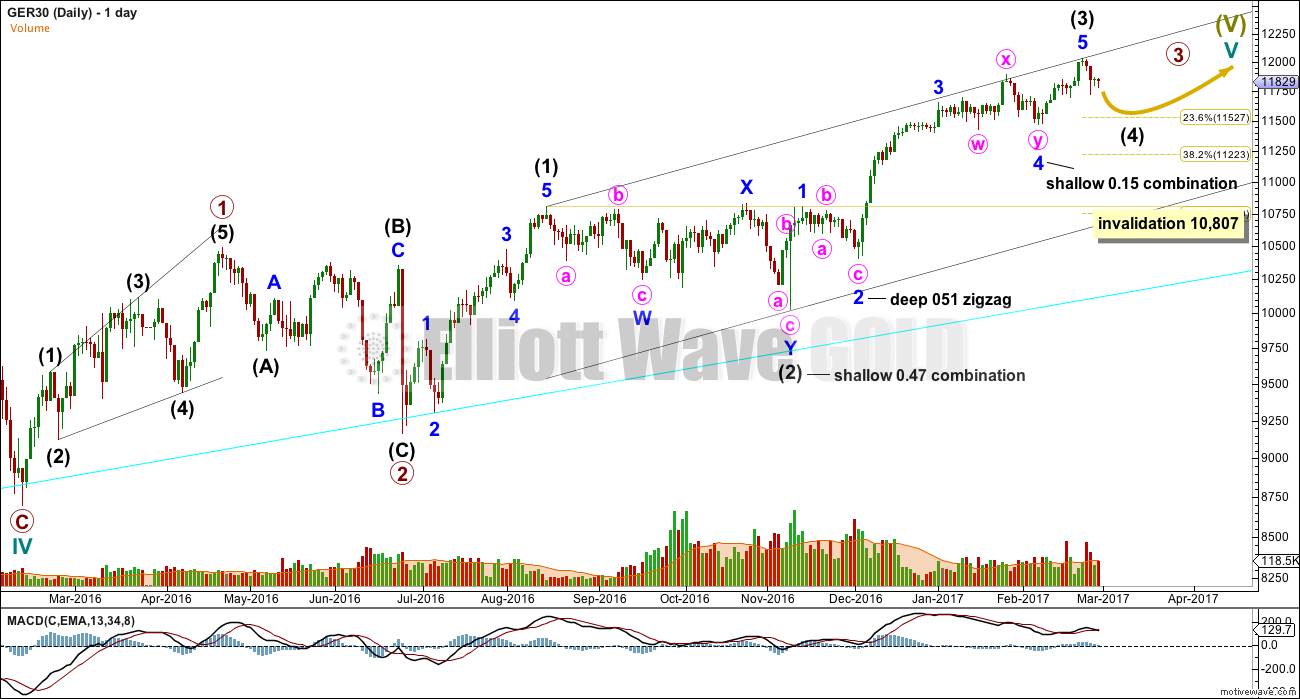
Click chart to enlarge.
A correction for intermediate wave (4) may not move into intermediate wave (1) price territory below 10,807. Intermediate wave (3) may be over. This is supported by classic technical analysis. A deeper pullback may occur here, maybe to the 0.236 Fibonacci ratio about 11,527. That would see intermediate wave (4) end within the price territory of the fourth wave of one lesser degree.
It is my conclusion at this time that DAX does not offer a good trading opportunity. The upwards trend looks stretched at this time, so a pullback may occur. If it does, then at its end it may offer an opportunity to join the upwards trend.
ALTERNATE MONTHLY CHART
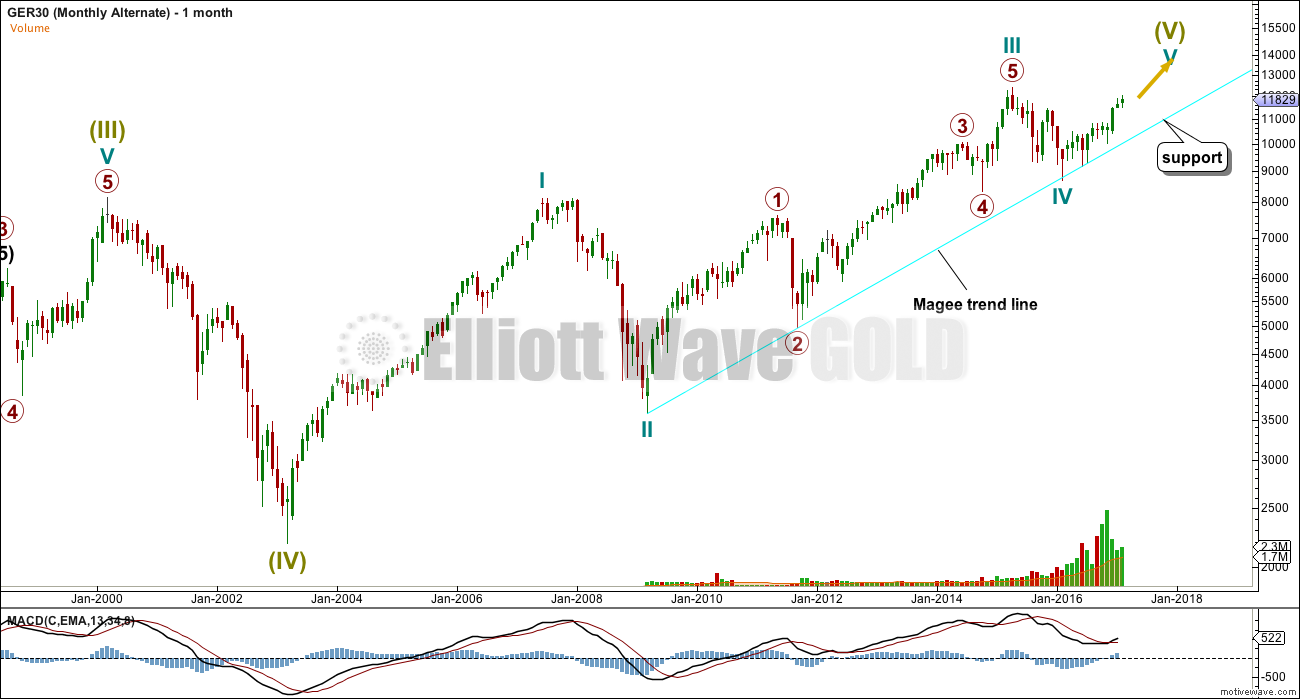
Click chart to enlarge.
The conclusion for the short term may be the same even if the triangle is wrong. Cycle wave IV may have been a quicker zigzag. Cycle wave V may still be within the final fifth wave up. The daily chart would be the same for this idea.
DISCLAIMER
As always, it is essential that anyone using this analysis for trading advice manages risk carefully. Follow my two Golden Rules:
1. Always use a stop.
2. Never invest more than 1-5% of equity on any one trade.
Trading is about probabilities, not certainties. Failure to follow my two Golden Rules of trading indicates failure to manage risk.
Accept that this analysis may be wrong. It is impossible for any analyst to predict with certainty what a market will do next.
This analysis is published @ 01:12 a.m. EST on 1st March, 2017.