
Upwards movement continues as expected. Members have been advised to move stops up now to protect some profit. Profit targets are still the same. A new channel on the hourly chart will be used to manage long positions.
Summary: The strongest move is still most likely ahead. The target may be reached in a few more days.
New updates to this analysis are in bold.
Grand SuperCycle analysis is here.
Last monthly and weekly charts are here.
MAIN ELLIOTT WAVE COUNT
DAILY CHART
Click chart to enlarge.
This daily chart will suffice for both weekly charts.
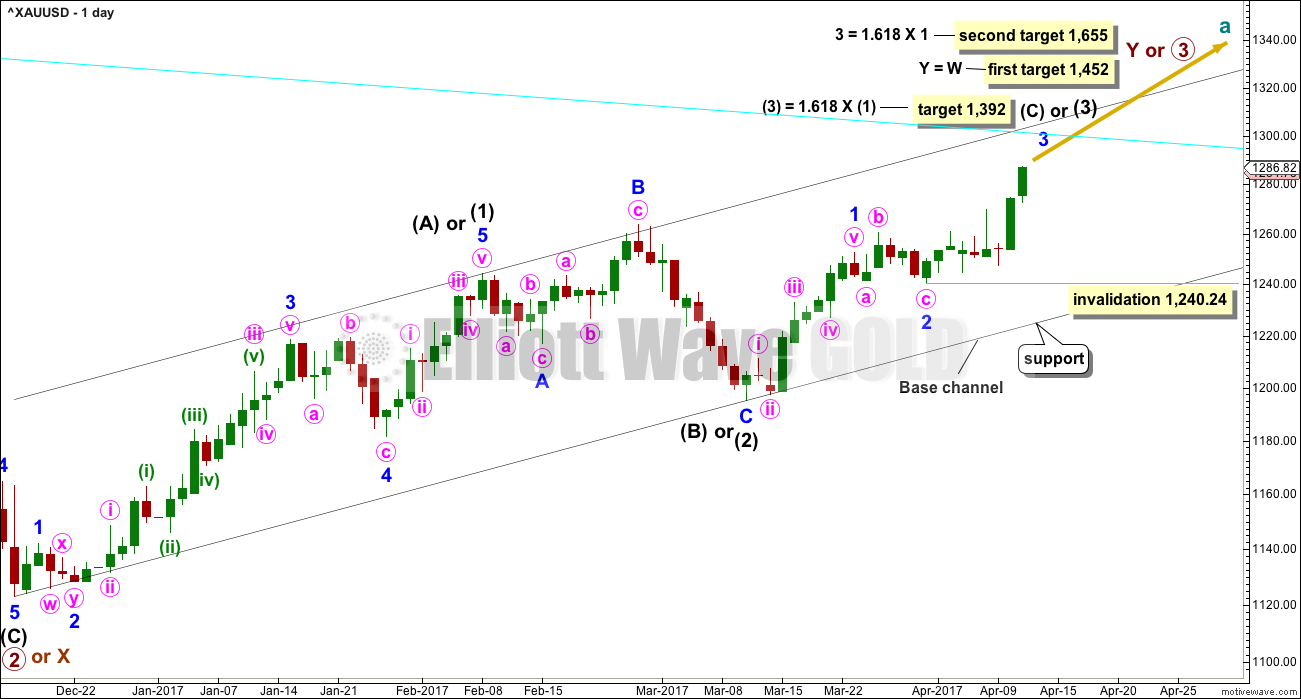
Upwards movement at primary degree is either a third wave (first weekly chart) to unfold as an impulse, or a Y wave (second weekly chart) to unfold as a zigzag. If upwards movement is a zigzag for primary wave Y, then it would be labelled intermediate waves (A) – (B) and now (C) to unfold.
Intermediate wave (1) or (A) is a complete five wave impulse lasting 39 days. Intermediate wave (2) or (B) looks like an expanded flat, which is a very common structure.
So far, within intermediate wave (3) or (C), minor waves 1 and 2 are now complete. Minor wave 3 looks to have begun. Within minor wave 3, no second wave correction may move beyond its start below 1,240.24.
A cyan trend line is added to all charts. Draw it from the high in October 2012 to the high in July 2016. This line has been tested five times. When price gets back up to this line, it is likely to offer strong resistance.
The cyan trend line is still some distance away. This may be where minor wave 3 ends, or it may be only where minute wave iii within minor wave 3 ends.
HOURLY CHART
Click chart to enlarge.
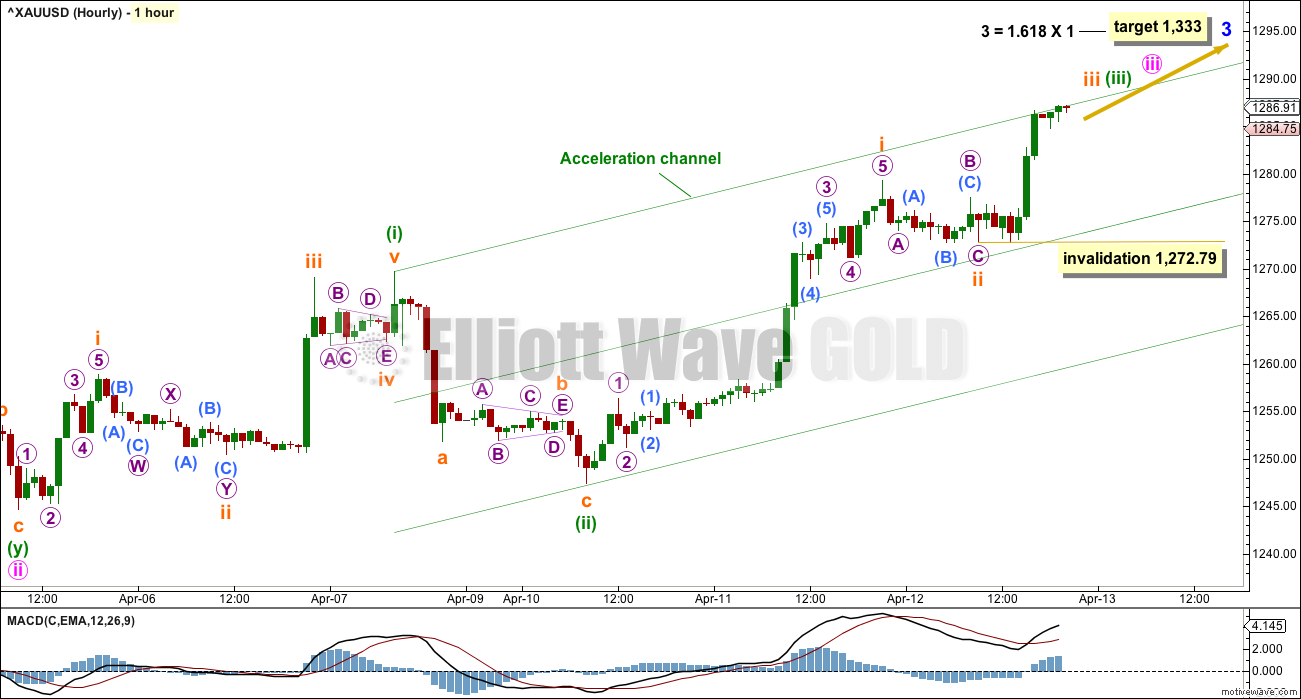
The middle of the third wave may pass in the next 24 hours if my labelling of this hourly chart is correct. There is a little weak divergence at the high for Wednesday on the hourly chart, but this high does not look like the end of subminuette wave iii.
Draw an acceleration channel about minuette wave (iii). As price moves higher keep redrawing the channel: the first trend line from the last high to the high of minuette wave (i) and a parallel copy on the low of minuette wave (ii), then a mid line.
Price may now sit within the upper half of this channel.
The upcoming corrections for subminuette wave iv, minuette wave (iv), and minute wave iv are all expected to be brief and shallow. If minor wave 3 ends with a blowoff top, then minute wave iv may be very brief and shallow; it may not show up on the daily chart.
If this wave count is correct, then each time price comes down to the mid line of the channel may present another opportunity to join the upwards trend.
Gold often exhibits strong extended third waves, and even stronger fifth waves. One or more of minor wave 3, intermediate wave (3) or primary wave 3 may end with blow off tops. The strongest upwards movement for this wave count is still ahead.
For the short term, micro wave 1 may not move beyond the start of micro wave 1 below 1,272.79.
TECHNICAL ANALYSIS
WEEKLY CHART
Click chart to enlarge. Chart courtesy of StockCharts.com.
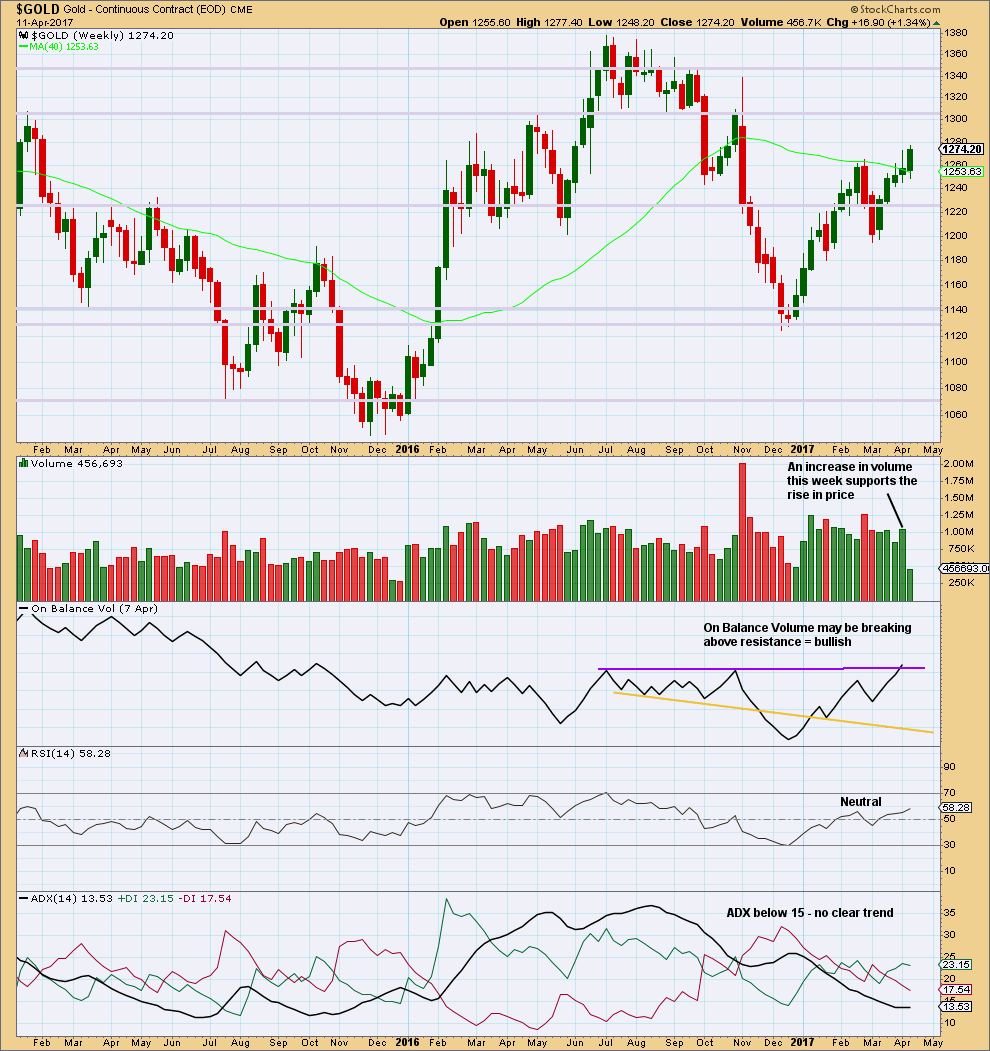
The relatively long upper wicks of the last two weekly candlesticks are a little bearish. The increase in volume last week is bullish.
The purple trend line on On Balance Volume has been carefully drawn to be as conservative as possible, sitting along the prior two highs. This trend line has a very shallow slope and is reasonably long held. It has only been tested twice before. It has some reasonable technical significance. Last week it is slightly breached offering a reasonable bullish signal. However, for the signal to have more weight it needs a clearer breach.
DAILY CHART
Click chart to enlarge. Chart courtesy of StockCharts.com.
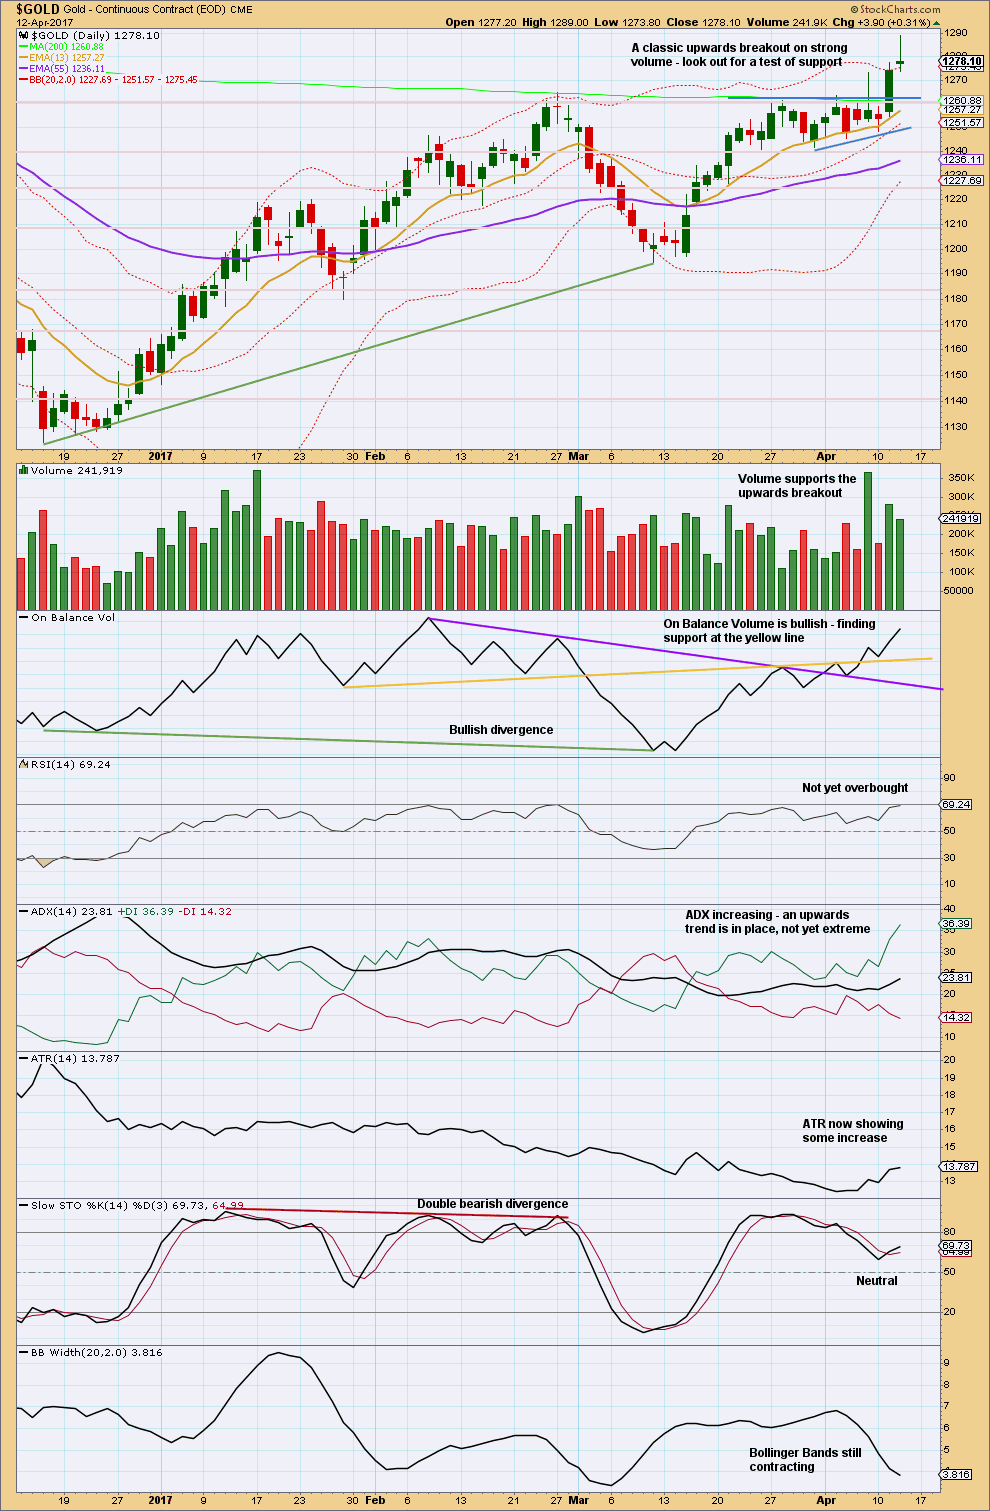
I do not have confidence in the data from StockCharts for the daily candlestick for the 12th of April. As the session ended, I did not see a spike down to 1,278, which is their close, and creates the long upper wick on their candlestick.
Technical analysis of today’s candlestick will use BarChart data which more closely mirrors how I saw the session end.
If the candlestick on BarChart data is correct, then it is bullish. If volume for StockCharts data is correct, then bulls did not have support from volume during this session. However, for one day of lighter volume this is not necessarily a cause for concern. Notice that during the last rise from 15th December, 2016, to 17th January, 2017, there were days with lighter volume but overall volume increased as price moved higher. It does not have to be a consistent increase for a bull trend to be healthy.
On Balance Volume remains bullish.
RSI is not yet overbought, but this may move into overbought and then become more extreme during a third wave for Gold. Look back at February 2016 and see how RSI behaved there. It reached extreme in the early stage of the third wave and reached very extreme over 85 at the end with the blowoff top.
RSI will be considered in conjunction with ADX. ADX is not yet extreme, nor is RSI. There is still plenty of room for this upwards trend to continue here.
Stochastics is not overbought.
Again, the only concern today is contracting Bollinger Bands. It is expected they should begin to expand strongly now.
TRADING ADVICE
Stops may be moved up to 1,240.24 *edit: 1,272.79 to protect a reasonable profit. Each time price comes down towards the mid line of the parallel channel on the hourly chart may present another opportunity to join the trend.
Profit targets may be set at 1,333 in the first instance.
As always, risk management is the single most important aspect of trading. Take it seriously. My two Golden Rules are:
1. Always use a stop.
2. Invest only 1-5% of equity on any one trade.
GDX
DAILY CHART
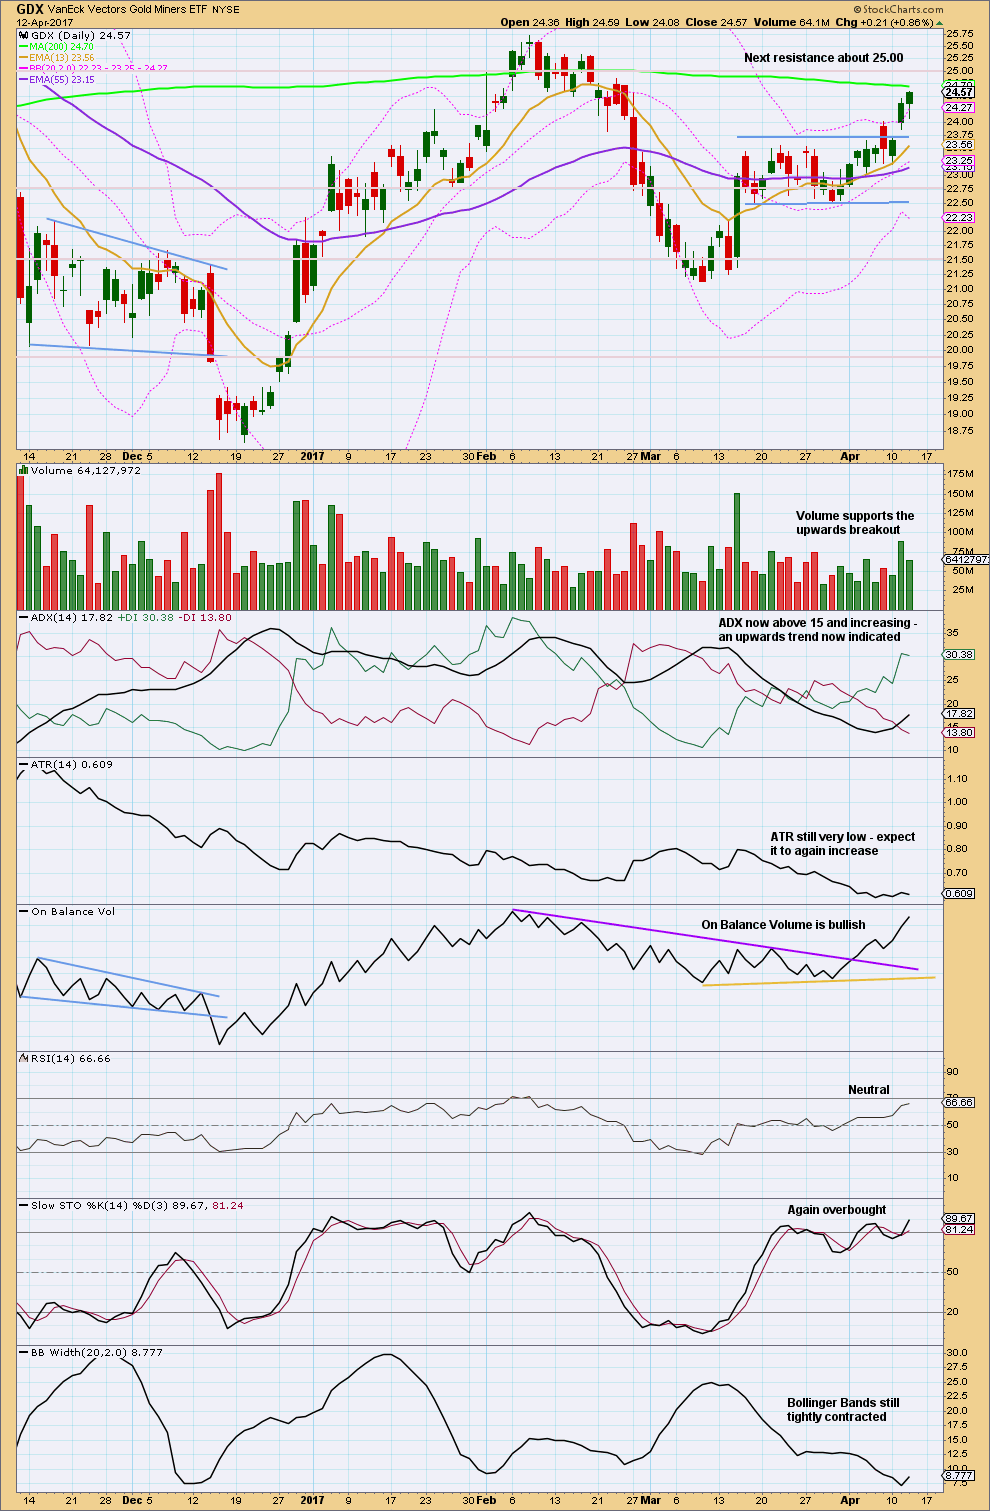
Click chart to enlarge. Chart courtesy of StockCharts.com.
Next resistance is at the 200 day moving average, then about 25.00.
Look for price to possibly curve down to test support at prior resistance, about 23.75. This does not always happen, but it happens often enough for it to be a tendency to look out for.
Although Stochastics is overbought, this oscillator may remain extreme for long periods of time during a strong trend.
This trend still looks young despite Stochastics being overbought. RSI is not yet extreme and ADX is not extreme. Today’s longer lower wick on the daily candlestick looks bullish.
This analysis is published @ 09:45 p.m. EST.
So, I know that GDXJ is very frustrating for most, but let’s keep a bigger picture in mind. I have it trending in a channel FWIW. I entered into a couple calls the last few minutes today, I think there’s a brilliant chance of hitting the upper side of the channel next week. GL to all.
Have a lovely Easter everybody. Spend it with those you love and have a great rest.
I’ll expect Good Friday to be quiet with the NYSE closed. Will still analyse Gold, but it may not move much.
Comment on Trading Room trades (and Oil):
Copper should still be nicely positive. If anyone isn’t short here then consider entering short. Today’s green candlestick has a long upper wick, that’s a bit bearish. I’ll expect Copper to come down to at least touch the lower edge of this blue channel.
For Copper the target may be too optimistic. I’ll be watching for signs of weakness along the way down. Invalidation point moved down. Profitable shorts opened close to that point may move stops to breakeven to eliminate risk.
Oil:
The small best fit channel is now overshot, not properly breached. The long upper wick on the last green daily candlestick is bearish.
Shorts may have stops either just above the invalidation point (ideal) or just above the high of 12th April which was at 53.76.
Target minimum 28.61, may be too optimistic, but it may not. That’s what it is for now anyway.
With a green daily candlestick here there’s a wee bounce, a good time to jump in.
As always, remember my two Golden Rules:
1. Always use a stop.
2. Invest only 1-5% of equity on any one trade.
Risk management is the most important aspect of trading. Take it very seriously please folks.
Another small correction, this one remaining within the upper half of the acceleration channel.
If any members are looking for opportunities to join the trend, use corrections.
Pull stops up to just below 1,272.79 to protect some profits. If adding to long positions this is where stops should be.
A word about stops: they should be set (in a bull market) low enough to allow the market room to move. We could calculate the range of daily volatility (% of movement) for Gold and set it just below the extreme of that. We could use Bollinger Bands which follow the same general idea. We could use Elliott wave invalidation points, but that assumes I’ve got the wave count (on the hourly chart) right, and sometimes I get it wrong.
Whatever we do we need to give the market room to move. We don’t want long positions to be taken out by a whipsaw. If you’re like me then you hold positions overnight when the market is in a good trend, to capture as much of the trend as you can. So where you set stops is really important.
One of my favourite techniques is the simplest. A support line shouldn’t be breached, if it is we may have the end of the bull run. I prefer to use this at the daily chart level for a trend expected to last weeks, so far for Gold that’s too low, it hasn’t developed a good one yet. So for now I’d rather use the hourly chart level.
At this stage stops could be set in the lower half of the acceleration channel. Not yet below the lower edge, because given Gold’s typical behaviour price will ramp up strongly to the end of a third wave.
As the channel steepens then we may need to set stops below the lower edge, give the market more room to move.
Hi Lara, what is a good way to calculate the range of daily volatility?
That’s AWESOME! Thanks John 🙂
The correlation is a strong positive one, but yes, sometimes it weakens.
Yeah I’m particularly surprised with GDXJ because of its strong move into the close yesterday. Kind of demoralizing considering that’s my gold long instrument. All I can think of is that this is a subminuette ii wave.
A huge move is coming for sure. BB’s have not been this contracted since December of 2015; hopefully it’s not a big move down
No. It is micro 2 of subminuette 3.
Target 1282.47 (0.382 Fib) or more likely 1278.78 (0.618 Fib).
It should now be in its c wave down.
I was talking about GDXJ… sorry about the confusion. They are obviously on different wave counts.
For GDXJ, it might be minuette or even minute ii. Dreamers take on it is much appreciated as always.
Oh oh. The be wave just refuses to die.
The gap between GDX and GDXJ just keeps widening. I really don’t know what to think of this. Anyone in this forum ever seen this before?
Problems for GDXJ????? http://www.cnbc.com/2017/04/12/how-an-etf-gets-too-big-for-its-index.html
I actually read this 2 days ago when it was first published on etf.com. Read “the bottom line” at the end of the article. While it is not the ideal situation, the liquidity is great and overall I don’t see it as a reason not to invest or trade GDXJ.
It is of course possible that with CNBC picking up the article, that lead to the unexplained selling today. I still think GDXJ will get it together very soon and outperform GDX. For now it’s frustrating for sure. 😟
Of course I could be wrong…
The higher it’s volume the easier it is to do an Elliott wave count on.
However, individual equities still don’t have enough volume. Not even AAPL.
Which is why I don’t do Elliott wave counts on them. That’s why I focus on the big commodities like Gold, Oil and Silver, and equities like the S&P500.
I’ve added the correlation between GDX and GDXJ at the end of the GDX chart. They have a strong positive correlation.
Bollinger bands constricted. Big move coming. Bribe Easter bunny with chocolate.
Yes and don’t be shocked for an intital drastic fake out!
FANTASTIC!!!!
Lara did you really mean stops @ 1240.24 ?
And also a look at copper it almost covered yesterdays loss
Oh my goodness…. no!
Thank you Roopa. That’s a terrible mistake. So sorry everybody.
I meant to move stops up to the invalidation on today’s hourly chart, 1,272.79
GDX and HUI 90 minute and Daily look from EWI is bullish
P.S. EWI is having a free open house for their pro services this week
Elliott Wave is complicated and it’s always good to be open to different ideas. At this time, EWI appears to have a similar bullish outlook as Lara on Gold.
P.S. EWI pro services is having a free open house for the public this week.
Thanks for sharing dreamer
The upward breakouts from the symmetrical triangles for Gold, Silver, and GDX look very strong.
…and look at the $USD, it back tested the neckline of it’s H&S pattern before moving strongly lower. If the $USD can break below it’s symmetrical triangle in the coming days, that would further support the move up in precious metals & miners!
https://www.tradingview.com/x/YHpvbJa0/
For those of you that trade or watch GDXJ (or JNUG), you know that the junior miners have been under performing. This is frustrating and somewhat problematic for the strength of this move up.
I find GDXJ more difficult to analyze than GDX due to it’s high volatility. That said, I did spend some time trying to make sense of the recent movement.
GDXJ appears to finally be starting to accelerate upwards. If this is a correct interpretation, then expect GDXJ and JNUG to start outperforming GDX in the coming days and weeks.
https://www.tradingview.com/x/RPLojPtA/
That looks like a really solid wave count Dreamer. Thank you very much for sharing.
Thanks Lara. I appreciate you taking a look 👀
GDX is making nice upward progress
https://www.tradingview.com/x/nhswbzAx/