
Upwards movement continues and price has remained within the upper half of the channel on the hourly chart, which was expected at this stage.
Trading advice is given to members to manage long positions towards the end of this week.
Summary: In the short term, a shallow consolidation may unfold for Friday and Monday while NYSE is closed for Easter. Thereafter, the upwards trend may be expected to continue because it is not yet extreme and the Elliott wave structure is incomplete. A blow off top is fairly likely to be ahead, maybe to the end of next week. The target for now is still at 1,333. If it is adjusted, it may be moved higher.
New updates to this analysis are in bold.
Grand SuperCycle analysis is here.
Last monthly and weekly charts are here.
MAIN ELLIOTT WAVE COUNT
DAILY CHART
Click chart to enlarge.
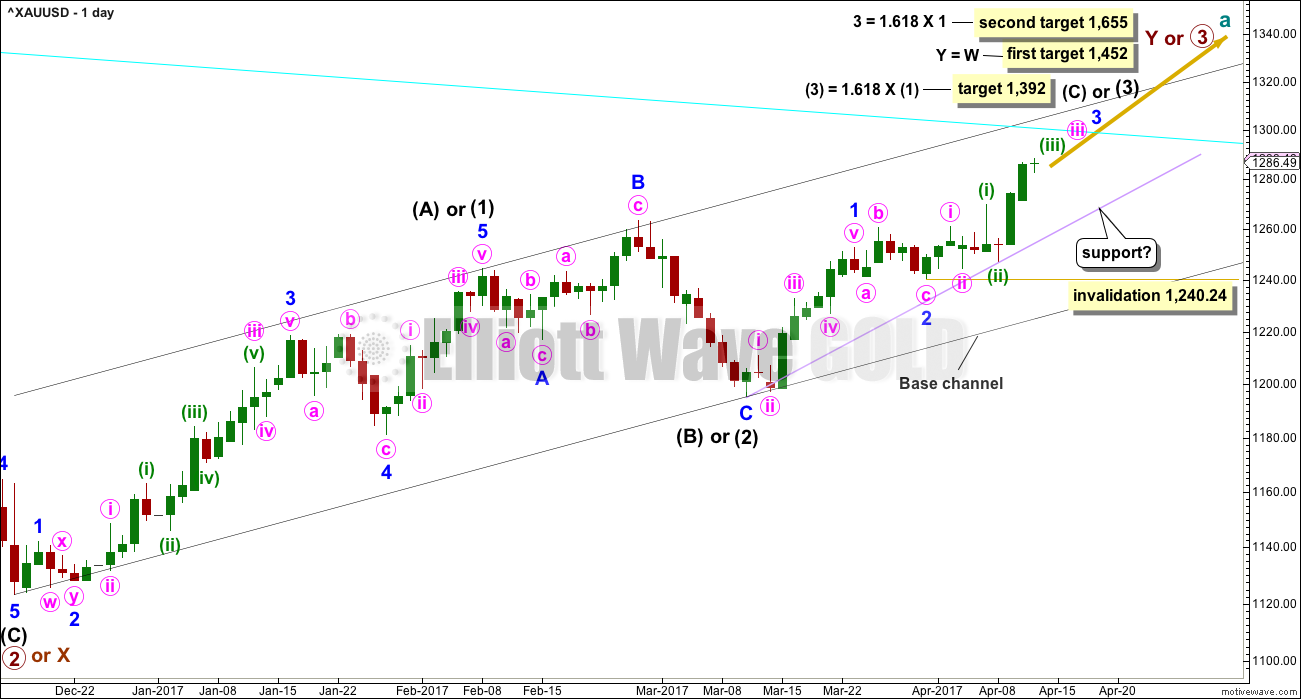
This daily chart will suffice for both weekly charts.
Upwards movement at primary degree is either a third wave (first weekly chart) to unfold as an impulse, or a Y wave (second weekly chart) to unfold as a zigzag. If upwards movement is a zigzag for primary wave Y, then it would be labelled intermediate waves (A) – (B) and now (C) to unfold. It is most likely a third wave because cycle wave a is most likely to subdivide as an impulse.
Intermediate wave (1) or (A) is a complete five wave impulse lasting 39 days. Intermediate wave (2) or (B) looks like an expanded flat, which is a very common structure.
So far, within intermediate wave (3) or (C), minor waves 1 and 2 are now complete. Minor wave 3 looks to have begun. Within minor wave 3, no second wave correction may move beyond its start below 1,240.24.
A cyan trend line is added to all charts. Draw it from the high in October 2012 to the high in July 2016. This line has been tested five times. When price gets back up to this line, it is likely to offer strong resistance.
The cyan trend line is still some distance away. This may be where minor wave 3 ends, or it may be only where minute wave iii within minor wave 3 ends.
HOURLY CHART
Click chart to enlarge.
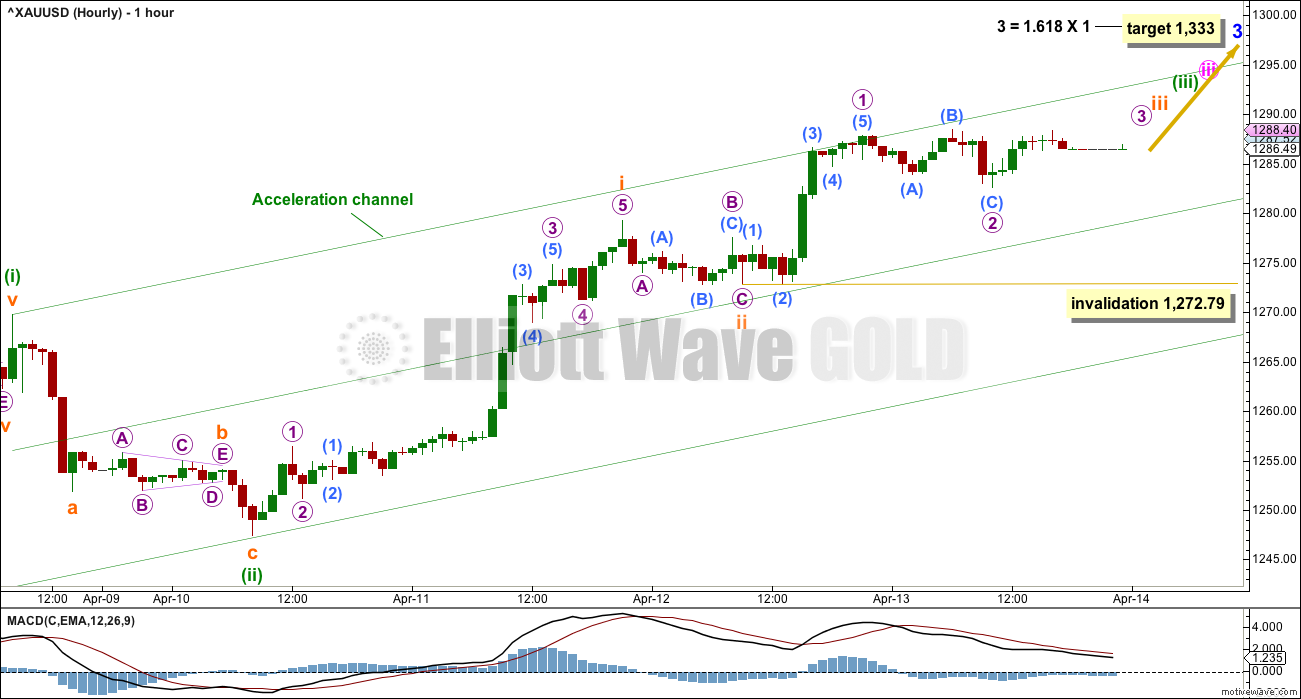
The middle of the third wave may not yet have passed. It may pass tomorrow or Monday, but with these days being public holidays that seems unlikely. The alternate hourly chart below may actually have a higher probability. The end target remains the same.
If the middle of the third wave has not yet passed, then within it micro wave 2 may not move beyond the start of micro wave 1 below 1,272.79. However, for micro wave 2 to continue lower or even sideways would begin to be disproportionate. It is most likely that micro wave 2 is over for this first hourly chart.
If price moves sideways or slightly lower, then the second hourly chart would be preferred.
The acceleration channel is the same as the Elliott channel on the alternate hourly chart.
SECOND HOURLY CHART
Click chart to enlarge.
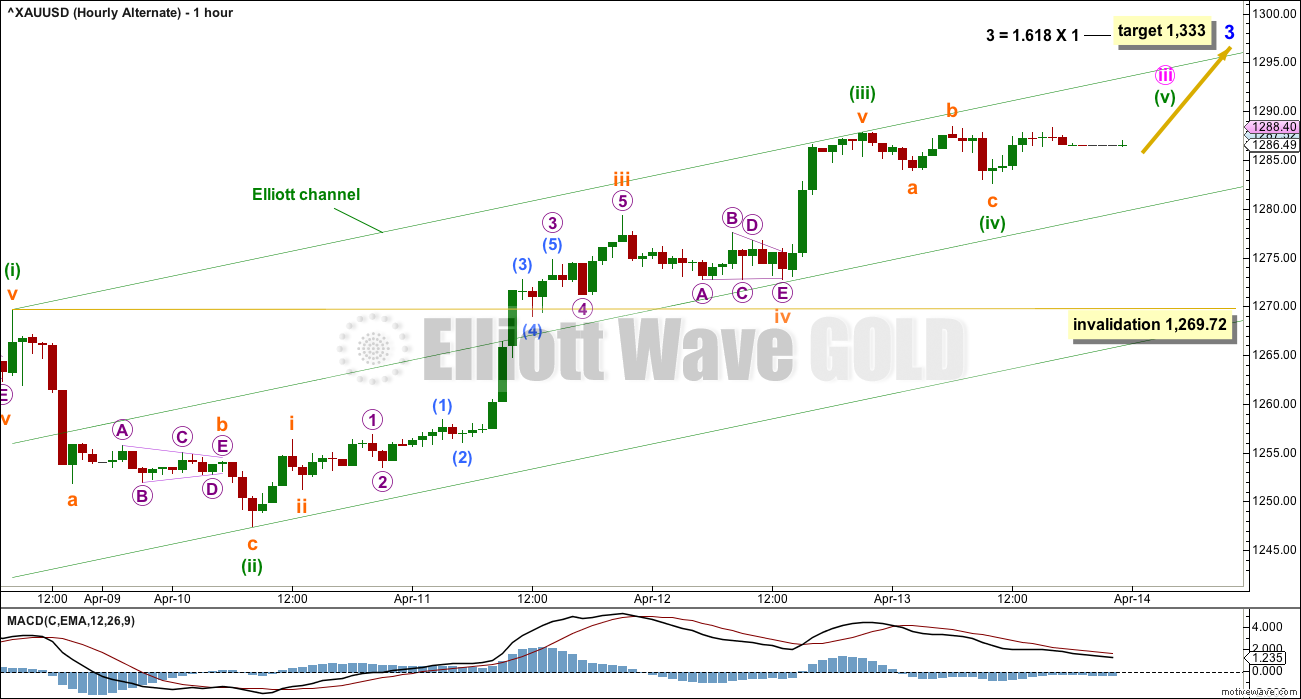
It is possible that the middle of the third wave has passed, but strongest movement would still be expected to be ahead. The strongest portion of upwards movement may be minuette wave (v), or minute wave v, or minor wave 5. One of these may end with a blow off top.
If minuette wave (iv) is over here, then it may be a completed regular flat correction. If it continues further, it may morph into a combination or a triangle.
Minuette wave (iv) may not move into minuette wave (i) price territory below 1,269.72.
TECHNICAL ANALYSIS
WEEKLY CHART
Click chart to enlarge. Chart courtesy of StockCharts.com.
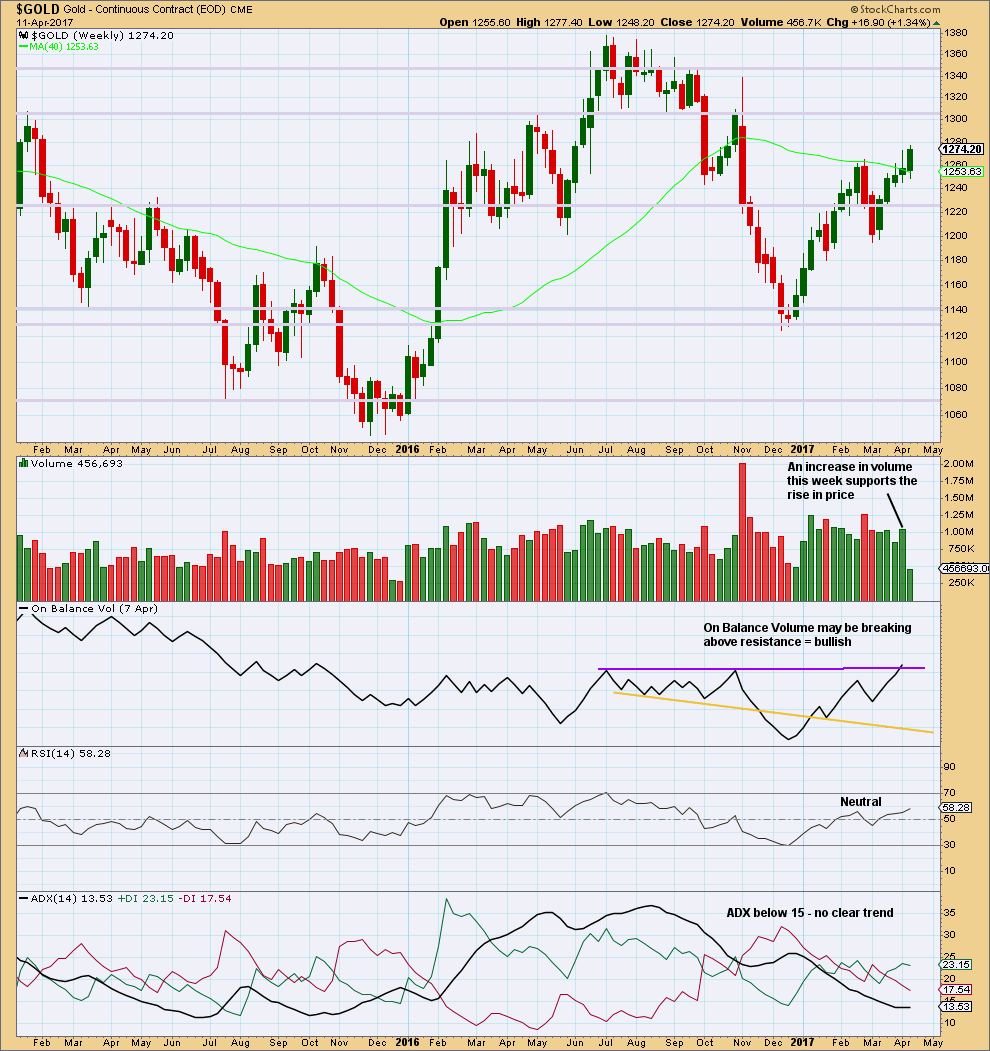
The relatively long upper wicks of the last two weekly candlesticks are a little bearish. The increase in volume last week is bullish.
The purple trend line on On Balance Volume has been carefully drawn to be as conservative as possible, sitting along the prior two highs. This trend line has a very shallow slope and is reasonably long held. It has only been tested twice before. It has some reasonable technical significance. Last week it is slightly breached offering a reasonable bullish signal. However, for the signal to have more weight it needs a clearer breach.
DAILY CHART
Click chart to enlarge. Chart courtesy of StockCharts.com.
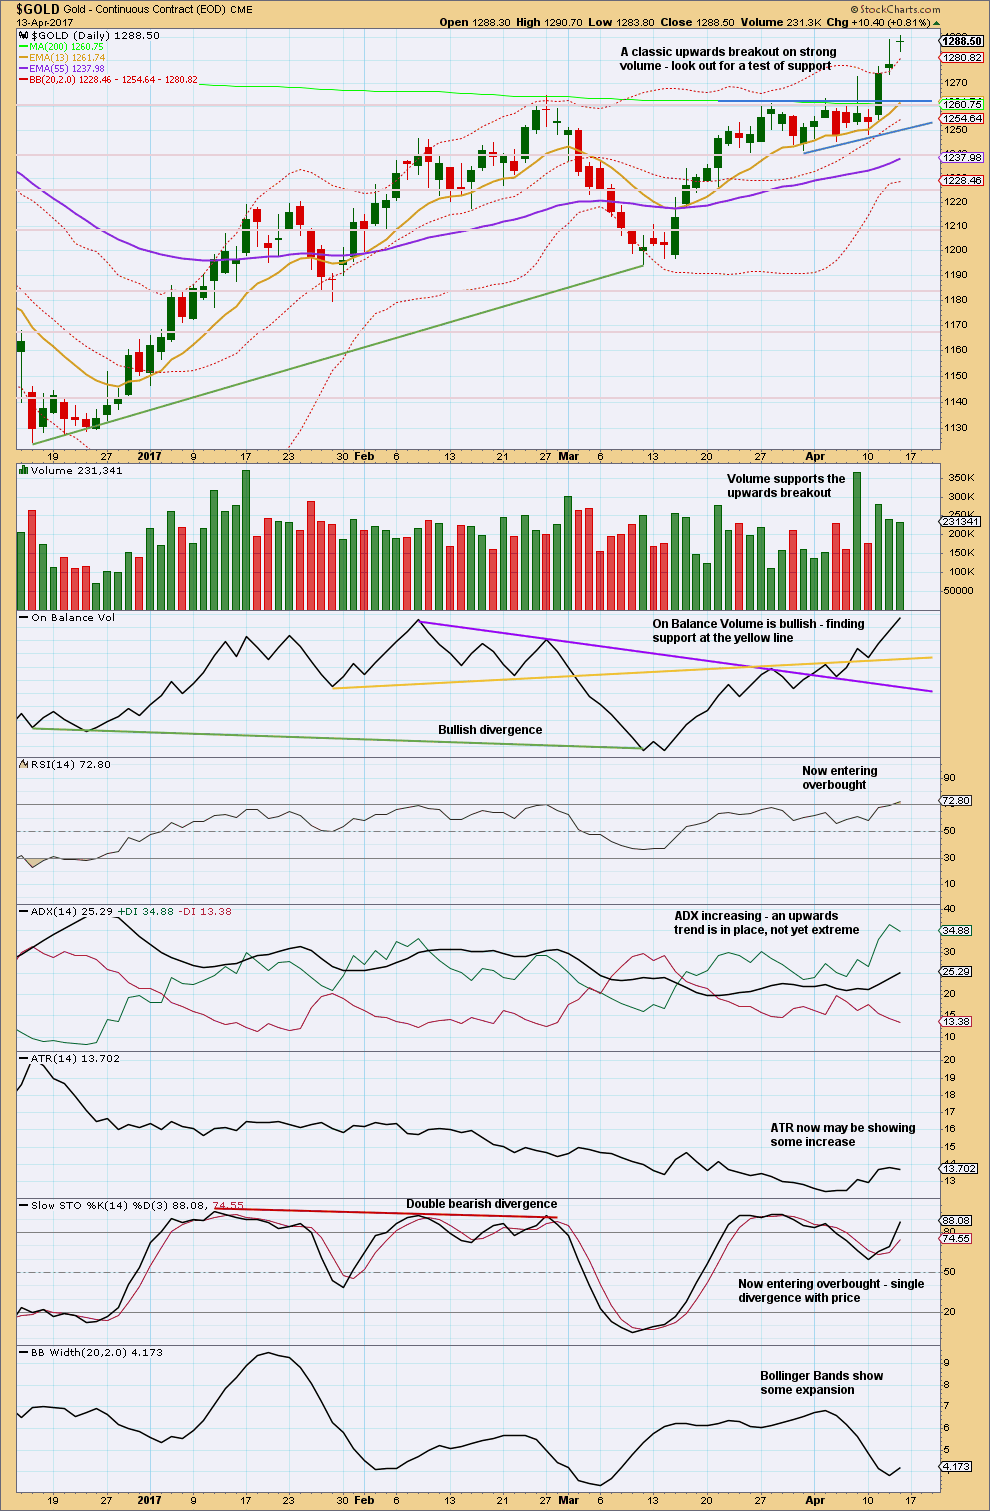
I do not have confidence in the data from StockCharts for the daily candlestick for the 12th of April. As the session ended, I did not see a spike down to 1,278, which is their close, and creates the long upper wick on their candlestick.
Technical analysis of yesterday’s candlestick will use BarChart data which more closely mirrors how I saw the session end.
BarChart data also shows an increase in volume for the last three upwards sessions, whereas StockCharts data shows a decline in volume. The third wave study below shows that some decline in volume during the early stages of a big third wave is entirely possible.
The doji for Thursday represents a pause and is not a reversal signal. It may be followed by a shallow consolidation before price moves higher. Only if it is followed by a strong red daily candlestick, may it be part of a reversal signal, an evening doji star.
Gold has broken above a prior strong resistance zone at 1,265. If price does come down back to this area, it should now provide strong support.
On Balance Volume is bullish. ADX is bullish. Bollinger Bands today are bullish.
The full daily candlestick above the upper edge of Bollinger Bands is a concern. Price may yet continue higher, but it is reasonably likely that tomorrow may see some shallow consolidation to resolve this.
TRADING ADVICE
Stops may be moved up to 1,269.72 to protect a reasonable profit, or members may prefer to set stops just below the mid line of the parallel channel on the hourly chart (this risks being whipsawed out only to see price move strongly higher). Each time price comes down towards the mid line of the parallel channel on the hourly chart may present another opportunity to join the trend.
Profit targets may be set at 1,333 in the first instance.
As always, risk management is the single most important aspect of trading. Take it seriously. My two Golden Rules are:
1. Always use a stop.
2. Invest only 1-5% of equity on any one trade.
GDX
DAILY CHART
Click chart to enlarge. Chart courtesy of StockCharts.com.
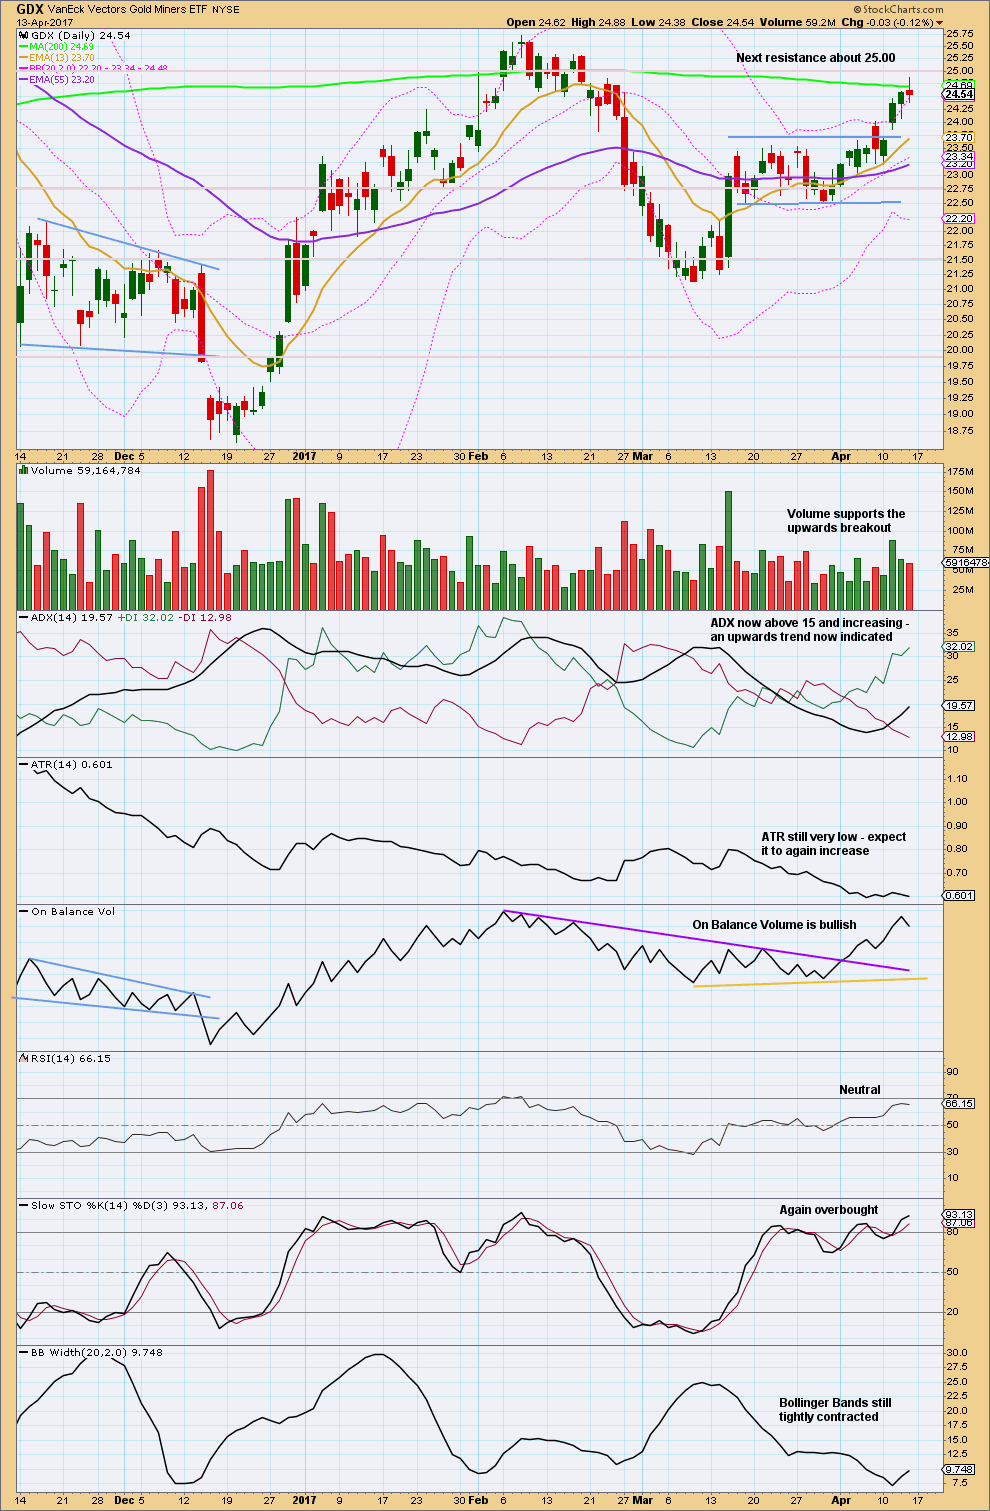
The 200 day moving average may be providing some resistance for Thursday. The doji represents a pause and should not be read as a reversal signal.
Downwards movement during Thursday’s session has the balance of volume lower. Coming with a decline in volume, downwards movement did not have support from volume during Thursday’s session. This is at least slightly bullish.
RSI and ADX are not yet extreme. Expect this trend to continue.
Look for price to possibly curve down to test support at prior resistance, about 23.75. This does not always happen, but it happens often enough for it to be a tendency to look out for.
Although Stochastics is overbought, this oscillator may remain extreme for long periods of time during a strong trend.
This trend still looks young despite Stochastics being overbought. RSI is not yet extreme and ADX is not extreme. Today’s longer lower wick on the daily candlestick looks bullish.
STUDY OF A THIRD WAVE IN $GOLD
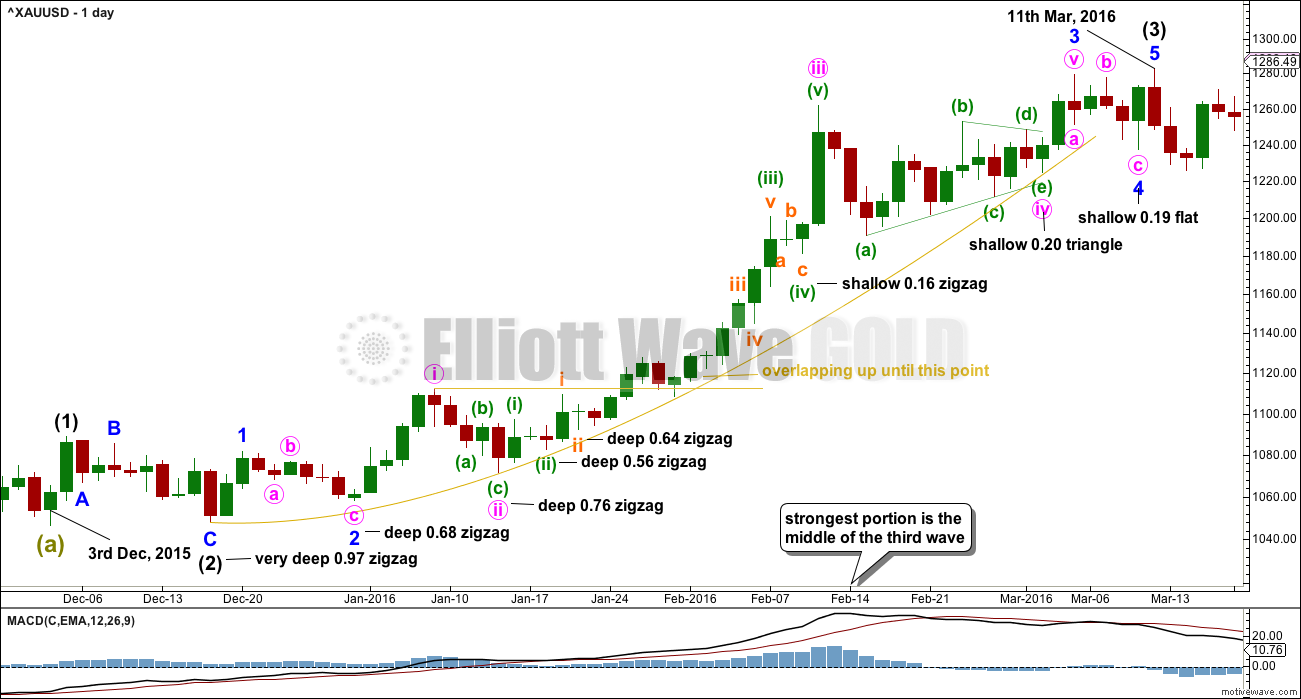
Click chart to enlarge.
This third wave spans 59 trading days.
It was not until the 40th day that the overlapping ended and the third wave took off strongly.
The middle of the third wave is the end of minute wave iii, which ended in a blow off top.
There is excellent alternation between second and fourth wave corrections.
This third wave began with a series of five overlapping first and second waves (if the hourly chart were to be added, it would be seven) before momentum really builds and the overlapping ends.
The fifth wave of minuette wave (v) is the strongest portion.
This third wave curves upwards. This is typical of Gold’s strong impulses. They begin slowly, accelerate towards the middle, and explode at the end. They do not fit neatly into channels. In this instance, the gold coloured curve was used.
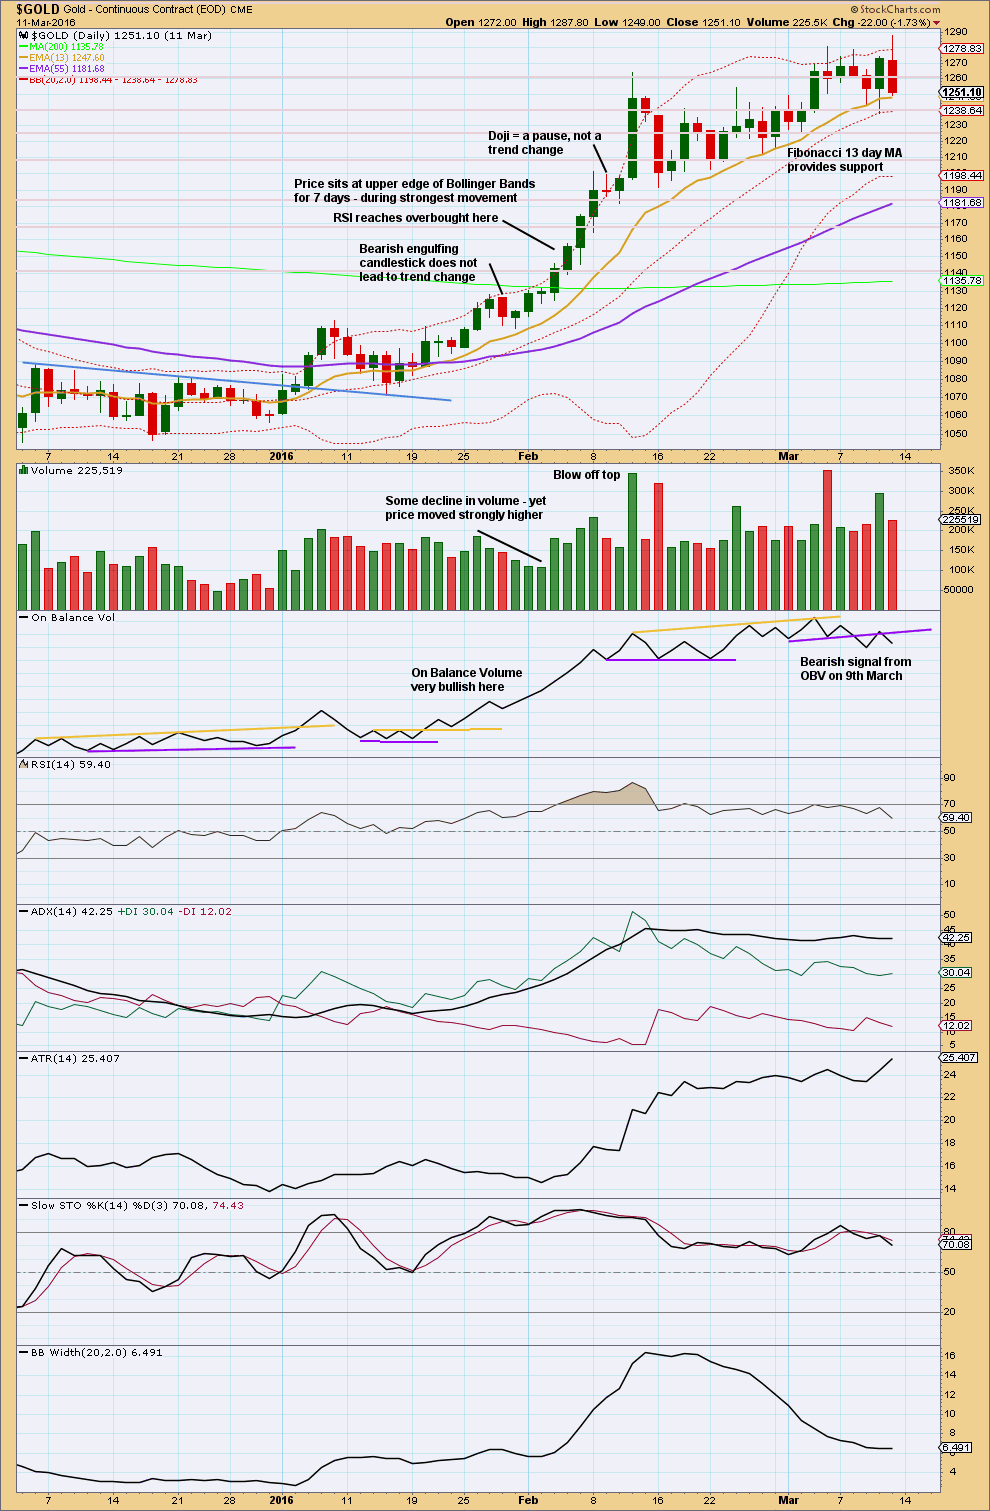
Click chart to enlarge. Chart courtesy of StockCharts.com.
This trend began after a long consolidation period of which the upper edge is bound by the blue trend line. After the breakout above the blue trend line, price curved back down to test support at the line before moving up and away.
RSI reaches overbought while price continues higher for another five days and RSI reaches above 85. The point in time where RSI reaches overbought is prior to the strongest upwards movement.
ADX reached above 35 on the 9th of February, but price continued higher for another two days.
The lesson to be learned here: look for RSI to be extreme and ADX to be extreme at the same time, then look for a blow off top. Only then expect that the middle of a big third wave is most likely over.
The end of this big third wave only came after the blow off top was followed by shallow consolidation, and more highs. At its end RSI exhibited strong divergence with price and On Balance Volume gave a bearish signal.
Third waves require patience at their start and patience at their ends.
This analysis is published @ 01:25 a.m. EST on 14th April, 2017.
I’m going to discard the first hourly chart today in favour of this one.
I’m going to label minute iii as complete. Now Gold needs to see a shallow correction for minute iv to resolve some divergence appearing at the 12 hourly chart level.
Minute ii was a very deep 0.78 zigzag. It lasted only one day. Minute iv should be a very shallow correction. It may be a flat, combination or triangle most likely. These are all sideways movements.
I’m holding onto my long position, without the target being met and without the blowoff top seen yet I do not think this is the time to exit.
Look at the third wave study I published above. After the overlapping ended I can see three trading days in there which could have shaken out bullish positions.
I can’t make the same comments though for JUST, DUST, GDX or GDXJ. They’ll have their own wave counts.
JDST is typically more volatile that DUST but the BB compression we are seeing in JDST is ridiculous. It looks like there is some behind the scenes skullduggery. That kind of compression usually results in an explosive price movement but if DUST does not similarly break out it confirms something suspicious is going on. A lot of folk have been buying the leveraged ETF and that often provides and attractive target for this sort of thing unfortunately.
NUGT or DUST are maybe harder to trade and related to this note:
<>
Go down and duck………. noone want to get sold.
The miners are being manipulated it would appear. I put nothing past the banksters and this would not be the first time. They will throw in the towel when miners manage to close above the 200 dma and they may even back-test, but make no mistake, they are eventually going much higher. Silver has already back tested its 200 dma but GLD has not so those levels are worth watching before we get our undies all in a bunch…. 🙂
I know the feeling…. 🙂
I’m in the same boat John. GDXJ is the only long position I have on gold. I really don’t know what to do at this point. Volume has been low today and Friday. I’m definitely contemplating rolling over my position to GDX or gold itself, but I’m under water 🙁
Hourly alternate chart for Gold updated:
It looks like minuette wave (iv) may be complete as a regular flat correction. This gives nice alternation with the zigzag of minuette wave (ii).
If this count is correct then within minuette wave (v) no second wave correction may move beyond the start of it’s first wave below 1,282.56.
I’m wary though of moving stops on long positions up that high at this time though. Leave room for the market to move, I wouldn’t want a whipsaw to take out long positions at this stage in the bull run with a likely blowoff top ahead.
It’s much harder to get positioned towards the end of Gold’s third waves than it is at the beginning.
Thanks for the chart updates. Much appreciated!
Lara,
Based on your main hourly count, is this still a viable option that we finished a Wave iv or nearly finished and moving into v of (iii)? Internals seems Ok? And also its bouncing off the center line.
Thanks
Lara,
As you posted an update above is good . Thanks
Updated daily charts for USD Index:
It invalidated my last EW count. From the last high labelled intermediate wave (3) it now has a three down, that’s why this is the main wave count. The trend should still be up.
The channel is new. Price has found support again right at this trend line.
Alternate daily chart:
What if cycle III is over? The three down does not support this idea. Support at the lower edge of the channel doesn’t either.
A new trend at cycle degree should last one to several years. Cycle wave II lasted 112 weeks; just over 2 years. It should begin with a big five down.
The first wave down may be complete, labelled minor wave 1. Minor wave 2 may be an expanded flat and may not move beyond the start of minor wave 1 above 103.82.
Dreamer – I’m preparing the weekly Trading Room post and I’m looking at Cocoa as you suggested.
ATM I don’t see it yet having a low in place necessarily. Price is bearish, it has some support from volume, On Balance Volume is very bearish, ADX is bearish and not extreme, RSI isn’t yet oversold, Stochastics is but doesn’t exhibit divergence with price yet, and Bollinger Bands are bearish.
If I was trading this one I’d be entering short, not long.
I’ll keep an eye on it. But for now, I can see it may be closer to the end of it’s bear wave so I wouldn’t want to put it in Trading Room this week.
Thanks for the tip.
I did eat a bunch of chocolate this Easter though, and it was fantastic.
Also, may have found the solution to my head problems. Surf more 🙂 No headaches nor any other issues when I’m out in the water.
Essential minerals. They’re all in the ocean.
Well, I sure have dunked myself well and truly in it for some hours this Easter. Plenty of minerals absorbed 🙂 🙂
Thanks Cyclone Cook!
Excellent. Glad you’re feeling better!
It’s really good to know that you are feeling better from your constant headaches and migraines.
Besides minerals, chocolates also help, especially the black variety.
Thanks for taking a look 👍
GDXJ has suspended creation orders according to to this article. Institutional selling may persist for some time if this is the case in favour of GDX.
http://www.zerohedge.com/news/2017-04-15/junior-gold-miner-etf-suspends-creation-orders-due-shortage-underlying-instruments
Same for JNUG, The 3x levered cousin of the GDXJ, announced on Thursday after the close, that “effective immediately, daily creation orders in the Direxion Daily Junior Gold Miners Index Bull 3X Shares leveraged exchange traded fund (Ticker: JNUG) are temporarily suspended until further notice.”
Jordan has been rather bearish the last few weeks, but now seems to be turning more bullish.
Video Update: Gold Breakout & False Signals from GDXJ?
https://thedailygold.com/video-update-gold-breakout-false-signals-from-gdxj/
Good video. Thanks Dreamer…
You’re welcome, Ari 😃
GDXJ continues to be a challenging and frustrating beast to analyze and trade.
Word on the internet suggests that the portfolio managers are challenged by too much money flowing into the ETF. Normally that would be a good thing, but when the objectives and guidelines of the prospectus state that the money must be invested in junior miners below X market cap and not to exceed X % of ownership, the fund managers are currently “challenged” because there are limited miners that meet the requirements.
Word on the internet also says that share creation for JNUG has been “halted”. What does that mean and will it impact JNUG? We need to watch the “NAV” value of JNUG to make sure that it doesn’t get too far out of alignment with the actual price of JNUG because if it does and then the fund reopens share creation, the JNUG could be negatively affected as the actual JNUG price comes back in line with the NAV. If demand for JNUG is strong, it could actually trade at a premium to NAV. You can read up more on this online if it interests you. Also, it appears that GDXJ did some fund rebalancing on Thursday, which may have impacted price.
So looking at the EW count of JNUG, there is a lot of overlapping movement. While the price remains above 36.08, the count may still be comprised of multiple 1-2’s, but today I want to share another idea, showing another leading expanding diagonal for Minuette wave 2. This would allow the correction to go all the way down to 35.49 before invalidating.
We’ll need to see more price movement next week to decipher which idea is correct.
Overall, I still think GDXJ will recover and take the lead over GDX in the near future.
https://www.tradingview.com/x/Ms3Siy8Z/
GDX EW update
https://www.tradingview.com/x/n0P5lgNH/
GDXJ and GDX study from late December 2016 low
https://www.tradingview.com/x/H9Mar9ds/
GDXJ and GDX study from 2016 January low
https://www.tradingview.com/x/TIsKKzlS/
http://www.mcoscillator.com/learning_center/weekly_chart/gold_resolves_some_bearish_divergences/
http://www.zerohedge.com/news/2017-04-15/junior-gold-miner-etf-suspends-creation-orders-due-shortage-underlying-instruments
Gold has flatlined for Friday. There’s absolutely nothing new to analyse, so this will be your end of week analysis.
I will record your video later today so it will be published with the whole weekend to review.
For now, I’m off surfing. Cyclone Cook has bought us some fantastic swell! 4ft and barrelling yesterday, but I couldn’t get a barrel. Off to hunt again for one today 🙂
This weekend can you please include the full daily wave count chart from the gold bottom in Dec 2015 to date similar to March 6th post?
Thanks in advance.
Here’s the chart. The intermediate wave (3) on the left is the one I used as a study for the third wave, because it’s the last one within a bull run.
Lara: Nice study of third wave. Thanks.
The current wave count looks similar to 2007 to 2008.
Retired Alf Field’s post on gold wave analysis in 2007 wrote about 3rd of 3rd of wave three.
I added a second symmetrical triangle for Gold based on the “Trump” high in November. Gold appears to be within a few dollars of this trend line. A break above this would be very bullish, but a small consolidation here would make sense.
https://www.tradingview.com/x/xwuKjWzf/