
A shallow consolidation was expected for Friday and Monday.
Monday completes a doji, which is essentially sideways movement, as expected.
Summary: In the short term, a shallow consolidation may unfold for Friday and Monday while NYSE is closed for Easter. Thereafter, the upwards trend may be expected to continue because it is not yet extreme and the Elliott wave structure is incomplete. A blow off top is fairly likely to be ahead, maybe to the end of next week. The target for now is still at 1,333. If it is adjusted, it may be moved higher.
New updates to this analysis are in bold.
Grand SuperCycle analysis is here.
Last monthly and weekly charts are here.
MAIN ELLIOTT WAVE COUNT
DAILY CHART
Click chart to enlarge.
This daily chart will suffice for both weekly charts.
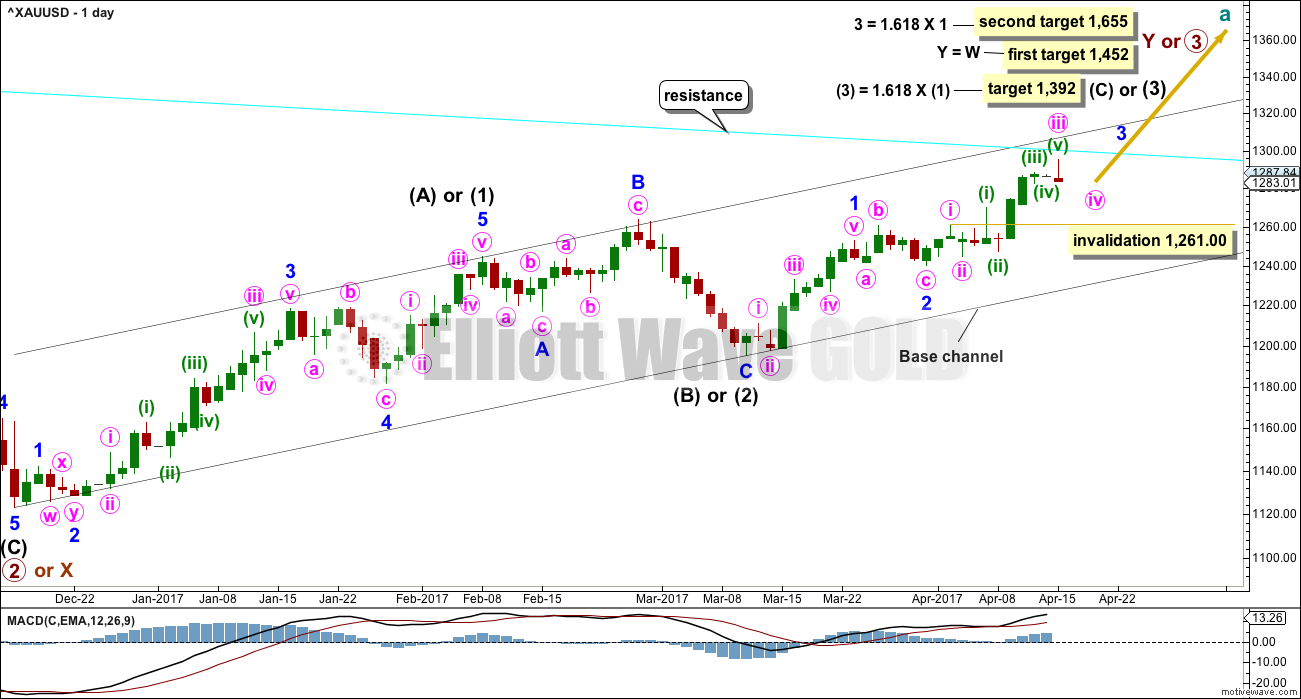
Upwards movement at primary degree is either a third wave (first weekly chart) to unfold as an impulse, or a Y wave (second weekly chart) to unfold as a zigzag. If upwards movement is a zigzag for primary wave Y, then it would be labelled intermediate waves (A) – (B) and now (C) to unfold. It is most likely a third wave because cycle wave a is most likely to subdivide as an impulse.
Intermediate wave (1) or (A) is a complete five wave impulse lasting 39 days. Intermediate wave (2) or (B) looks like an expanded flat, which is a very common structure.
So far, within intermediate wave (3) or (C), minor waves 1 and 2 are now complete. Minor wave 3 looks to have begun. Within minor wave 3, the middle portion for minute wave iii may now be complete. Minute wave iv may not move into minute wave i price territory below 1,261.00.
Minute wave v is expected to be very strong, possibly ending with a blow off top.
A cyan trend line is added to all charts. Draw it from the high in October 2012 to the high in July 2016. This line has been tested five times. Price is finding resistance at the cyan trend line now. If price can break through resistance here after some consolidation, then that may release energy to the upside for the end of minor wave 3.
HOURLY CHART

Click chart to enlarge.
There will be only this one hourly chart today. The other idea published in last analysis no longer looks right.
Minute wave ii was a deep 0.79 double zigzag, which lasted 25 hours, and on the daily chart it shows as only one session.
Given the guideline of alternation, minute wave iv may be expected to most likely be a flat, combination or triangle. All of these structures may include a new high above its start at 1,294.96 as part of the correction. A new high does not indicate minute wave iv is over.
So far a zigzag may have completed lower and this may be only minuette wave (a) of a flat or triangle, or minuette wave (w) of a combination.
If minute wave iv is a flat correction, then minuette wave (b) must retrace a minimum 0.9 length of minuette wave (a) at 1,293.60 (this calculation assumes subminuette wave c of minuette wave (a) is complete and will not move lower).
The normal range of minuette wave (b) within a flat correction would be from 1,294.96 to 1,299.78.
There is no minimum requirement for minuette wave (b) within a triangle, nor minuette wave (x) within a combination. They both only need a three wave structure upwards to complete.
So far minute wave iv has lasted 25 hours. Flats, triangles and combinations are usually longer lasting structures than single and multiple zigzags. Minute wave iv may end within the next session, or it may possibly take a little longer.
The Elliott channel is drawn using Elliott’s first technique: the first trend line is drawn from the ends of minute waves i to iii, then a parallel copy is placed upon the end of minute wave ii. This channel does not perfectly contain the start of minute wave iii, but it may still assist to show where minute wave iv finds support.
Fourth waves are not always contained within these channels though. If minute wave iv moves below the lower pink trend line, then the channel must be redrawn using the second technique when minute wave iv is complete.
TECHNICAL ANALYSIS
WEEKLY CHART
Click chart to enlarge. Chart courtesy of StockCharts.com.
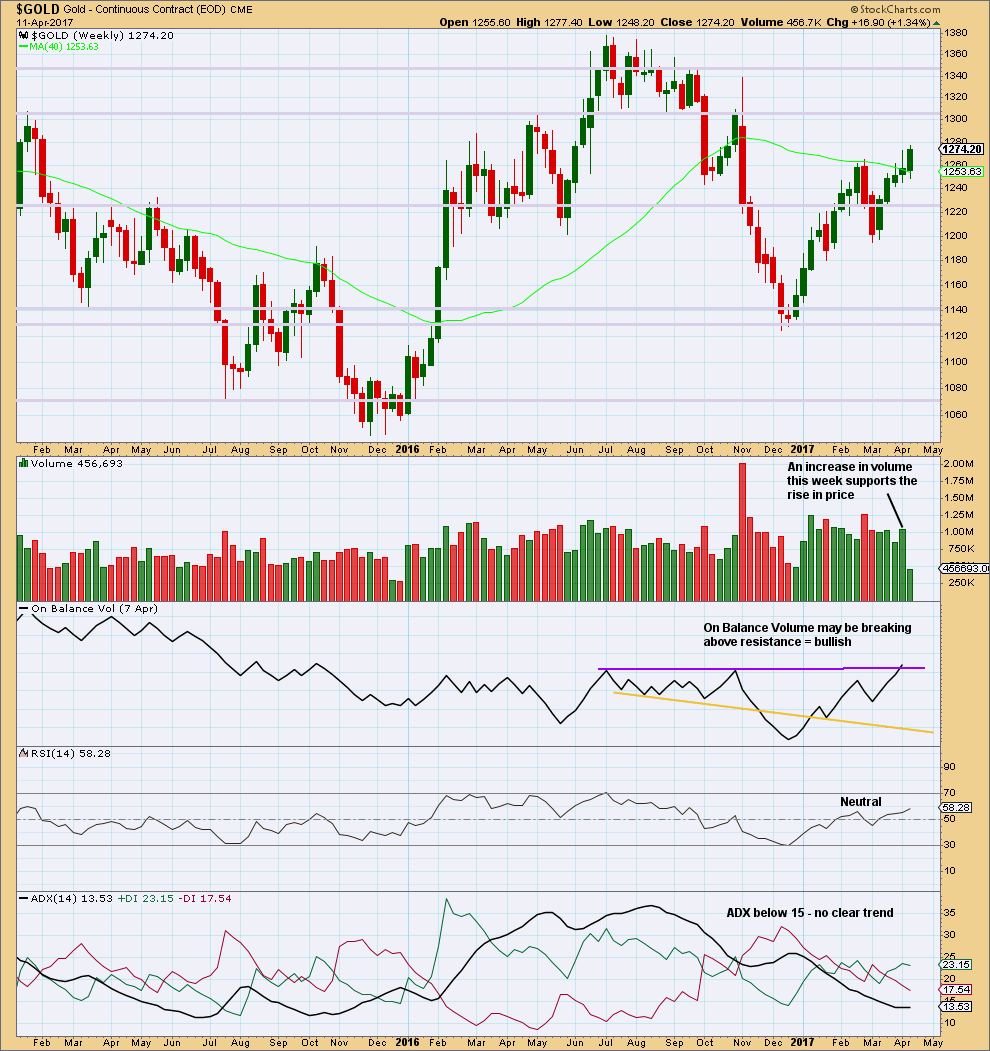
The relatively long upper wicks of the last two weekly candlesticks are a little bearish. The increase in volume last week is bullish.
The purple trend line on On Balance Volume has been carefully drawn to be as conservative as possible, sitting along the prior two highs. This trend line has a very shallow slope and is reasonably long held. It has only been tested twice before. It has some reasonable technical significance. Last week it is slightly breached offering a reasonable bullish signal. However, for the signal to have more weight it needs a clearer breach.
DAILY CHART
Click chart to enlarge. Chart courtesy of StockCharts.com.
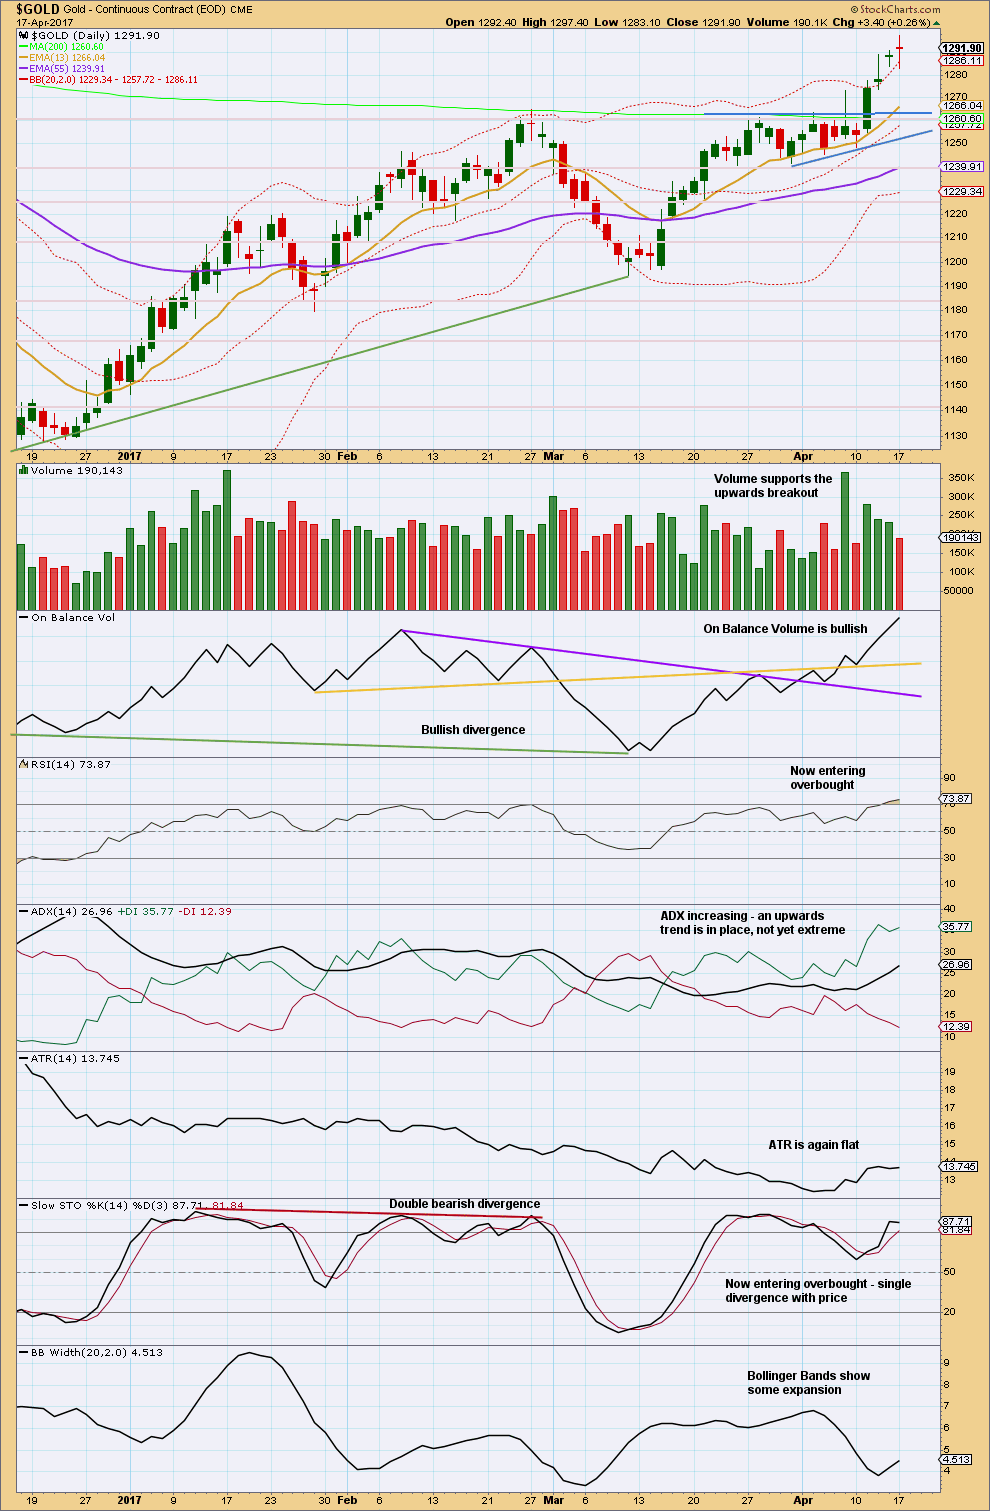
I do not have confidence in the data from StockCharts for the daily candlestick for the 12th of April. As the session ended, I did not see a spike down to 1,278, which is their close, and creates the long upper wick on their candlestick.
The last two upwards days to complete green candlesticks came with some decline in volume. Monday’s session is an outside day and the balance of volume was down. Some further decline in volume does not support the upwards movement for price during Monday’s session.
RSI may remain overbought for some time and may yet become more extreme before a trend change. Stochastics may also remain extreme for long periods of time when Gold has strong trends.
RSI does not yet exhibit divergence with price and ADX is not yet extreme. There is still room for this trend to continue.
TRADING ADVICE
For swing traders who prefer a longer term position stops now technically should be set just below 1,261 to ensure a small consolidation does not close long positions.
Traders who have a shorter time frame may exit long positions to take profit when price moves a little higher within the B or X wave of this correction.
If exiting long positions here, be warned: the strongest upwards movement should still be ahead if this analysis is correct.
Profit targets may be set at 1,333 in the first instance.
As always, risk management is the single most important aspect of trading. Take it seriously. My two Golden Rules are:
1. Always use a stop.
2. Invest only 1-5% of equity on any one trade.
GDX
DAILY CHART
Click chart to enlarge. Chart courtesy of StockCharts.com.
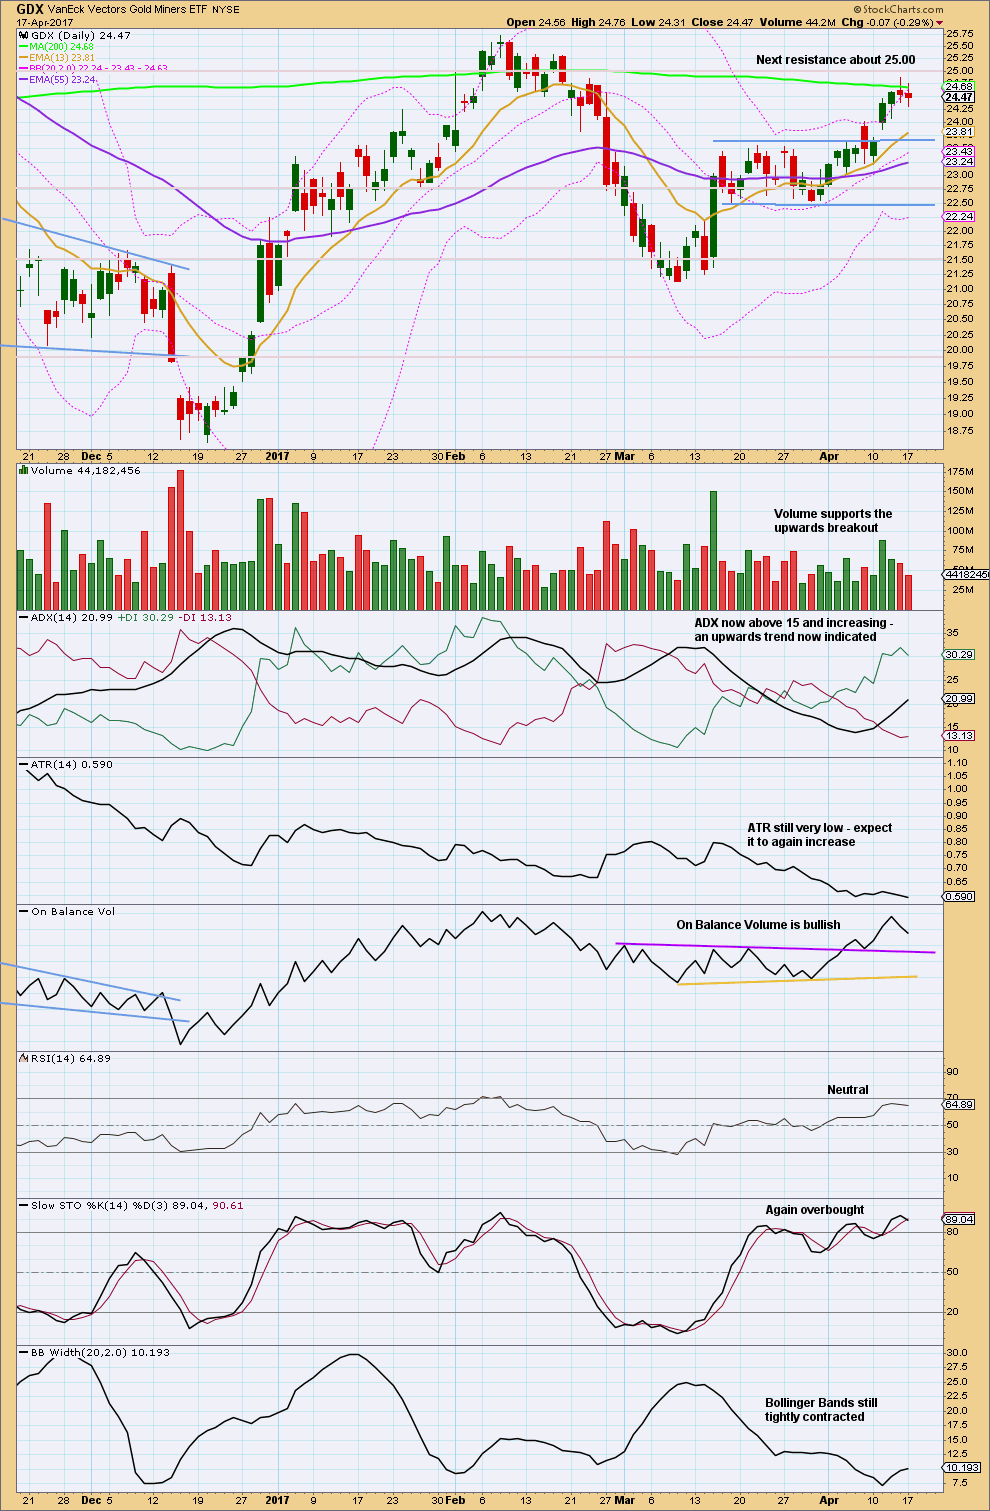
The last two sessions for GDX have seen red daily candlesticks with the balance of volume downwards. During these two sessions volume is declining. The fall in price does not have support from volume and looks more likely to be a small pullback.
There is no candlestick reversal signal at the high.
Trend lines for On Balance Volume are adjusted today.
Overall, this chart remains bullish to slightly neutral. Expect the trend to continue. Downwards movement along the way may be corrections within the trend.
STUDY OF A THIRD WAVE IN $GOLD
Click chart to enlarge.
This study of a third wave will be left in daily analysis until the current third wave is either proven to be wrong (invalidated) or it is complete.
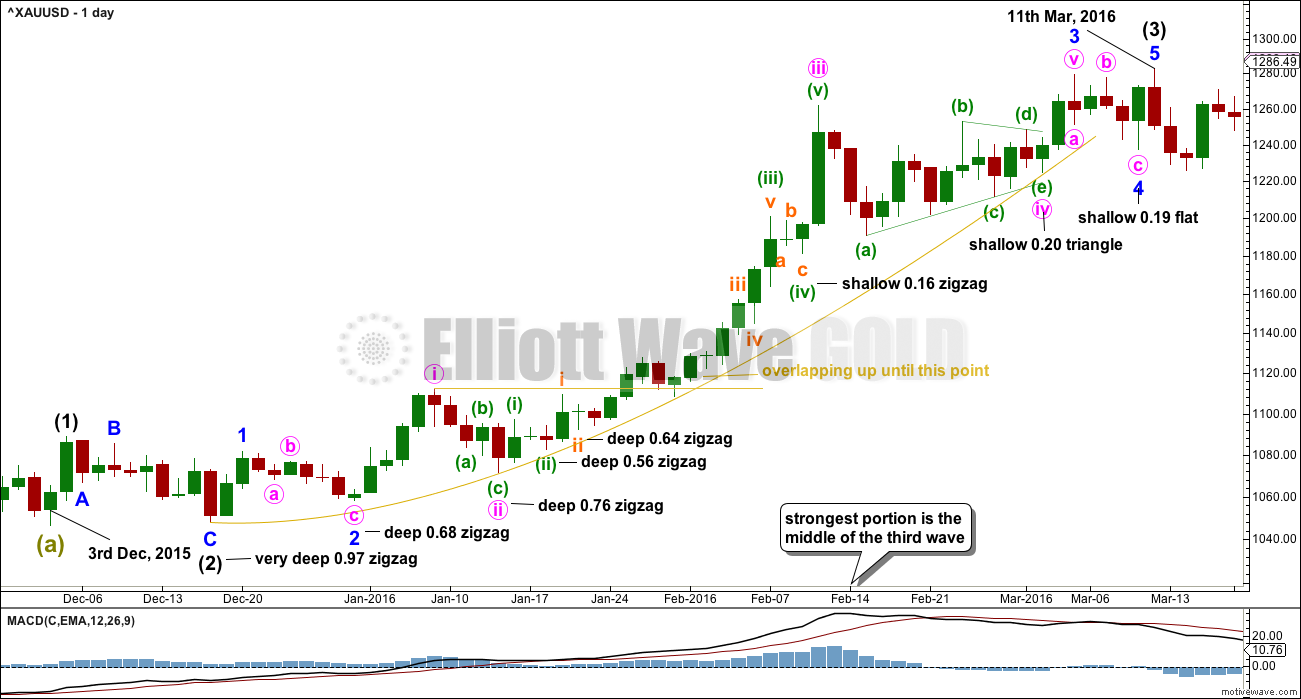
This third wave spans 59 trading days.
It was not until the 40th day that the overlapping ended and the third wave took off strongly.
The middle of the third wave is the end of minute wave iii, which ended in a blow off top.
There is excellent alternation between second and fourth wave corrections.
This third wave began with a series of five overlapping first and second waves (if the hourly chart were to be added, it would be seven) before momentum really builds and the overlapping ends.
The fifth wave of minuette wave (v) is the strongest portion.
This third wave curves upwards. This is typical of Gold’s strong impulses. They begin slowly, accelerate towards the middle, and explode at the end. They do not fit neatly into channels. In this instance, the gold coloured curve was used.
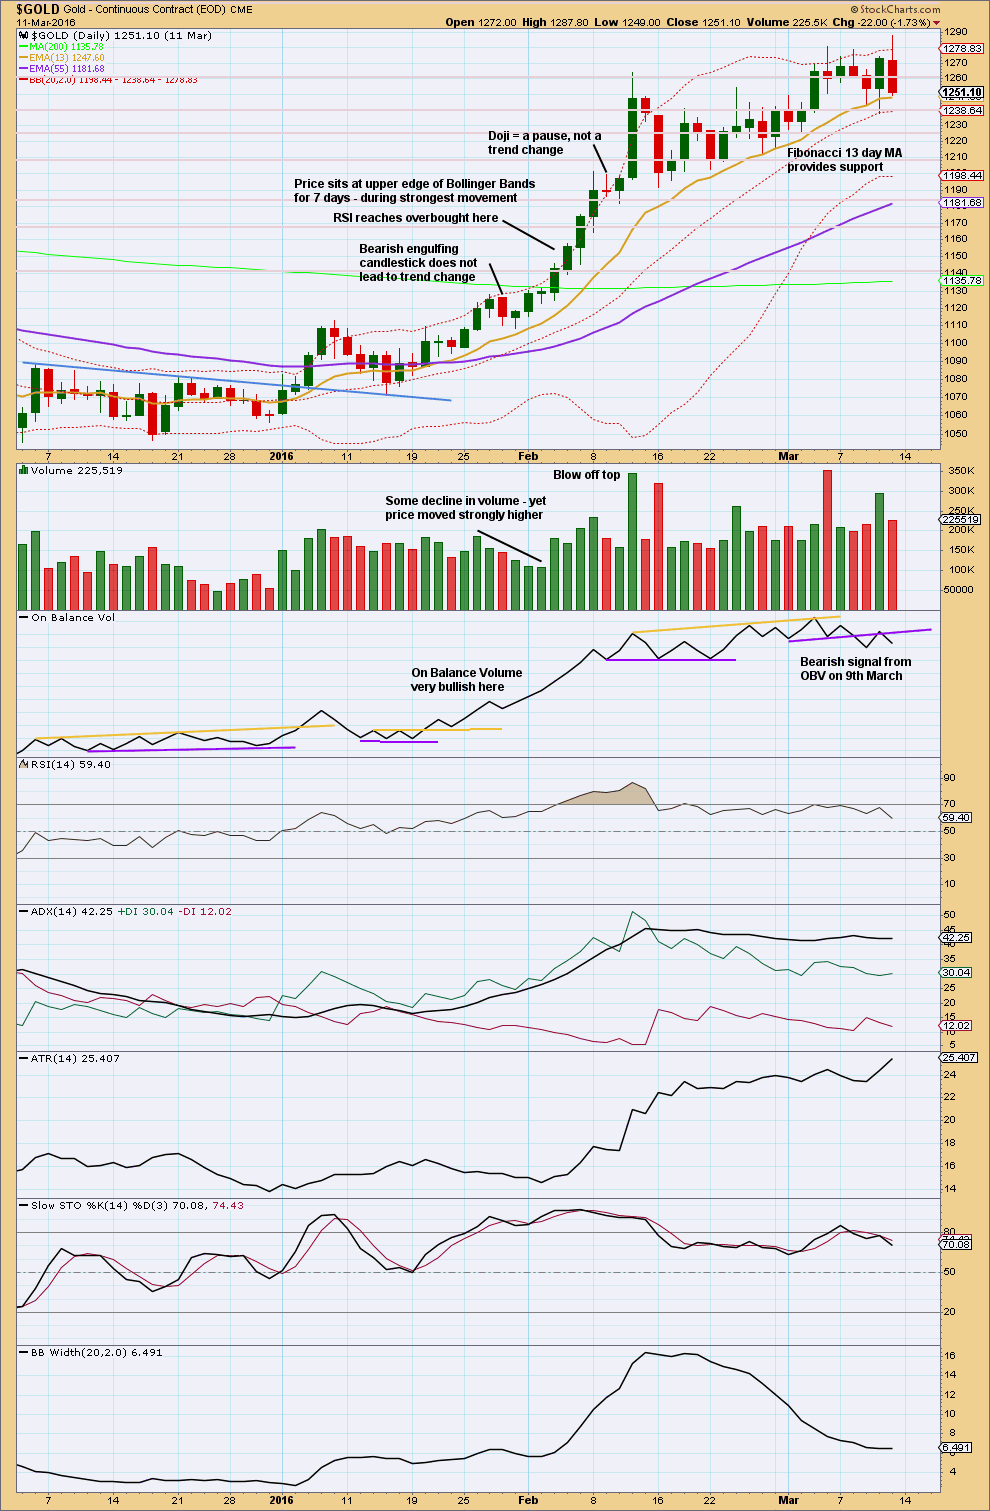
Click chart to enlarge. Chart courtesy of StockCharts.com.
This trend began after a long consolidation period of which the upper edge is bound by the blue trend line. After the breakout above the blue trend line, price curved back down to test support at the line before moving up and away.
RSI reaches overbought while price continues higher for another five days and RSI reaches above 85. The point in time where RSI reaches overbought is prior to the strongest upwards movement.
ADX reached above 35 on the 9th of February, but price continued higher for another two days.
The lesson to be learned here: look for RSI to be extreme and ADX to be extreme at the same time, then look for a blow off top. Only then expect that the middle of a big third wave is most likely over.
The end of this big third wave only came after the blow off top was followed by shallow consolidation, and more highs. At its end RSI exhibited strong divergence with price and On Balance Volume gave a bearish signal.
Third waves require patience at their start and patience at their ends.
This analysis is published @ 10:22 p.m. EST.
So, I’ve been trialling this Trading Room idea now for a few weeks (since 7th February to be exact).
I’ve noticed the engagement here at Elliott Wave Gold, and the views on YouTube when I do a video, are really low.
There’s pretty much no engagement. It seems this idea isn’t actually going to work. Despite initial very positive feedback.
I’m not going to keep on doing the same thing and expect different results. Clearly something has to change. So I’m asking for some feedback because at this point in time I’m just not sure what’s wrong here.
So, I’m asking, what about the structure / presentation is putting you all off? What do you think I’m doing wrong here? Is it that I’m not giving good enough trading tips?
Your honesty is appreciated. Thank you. (and don’t worry about offending me please, I’m a Big Girl, I can take it 🙂 )
I have found the copper to be very useful the only thing i can think of is that people share how there going to play the copper trade and what miners there looking at buying at the bottom. Although thats more to do with the people that use it, not the way its presented though. If i have anymore ideas i will add them later. Also when i click on the comment button it wont take me to the comments to read or make them, dont know if anyone else is having that problem.
Aha. If you’re logged in to the membership area can you make comments in Trading Room? That may be the problem…
Will fix on next post.
Thank you very much James for the feedback
Agreed, I have found it difficult to make comments in the Trading Room section.
Maybe it would also help to have a link to the comments under the title as well because currently you need to scroll down quite a lot of text/graphics until you get to the right spot.
I am. I tried a few times to comment on the trading room posts but could not. I wanted to list the trades I was making but assumed Lara did not want comments!
Lara.
There is nothing wrong with the presentation in the Trading Room. My best guess is that not many people trade the financial instruments posted. Most of us go for those with large volumes, like gold and oil ETFs, and these have their own “homes”. I have tried instruments with low volumes in my early days of trading and I found that it is very difficult to buy or sell those. Moreover, the spread is usually very large. Bottom line is that the profits, if any, are dismal.
I do not trade forex because it is not offered on my trading platform. Moreover, you need either to trade options (on high leverage), CFDs on margin, or have plenty of money to trade forex in cash. Movements are quite minimal and their volatility do not make them feasible for buy-and-hold. Most traders scalp these, and it means being glued to the computer screen at all times. The large capital sums (plus margins) involved can easily wipe out more than just the capital put in. There is a large following in Singapore trading this way. Many companies have been set up locally catering to forex trading. Some of my friends had gone into it. The stories I heard were that none had made money, and had lost the capital they put in within a month or two. These are thinking individuals with an analytical mind, having been trained in professional occupations. They have tried all forms of analysis imaginable: trendlines, resistance/support, pivot points, EW, Gann, and so on. None yield satisfactory results in the very short timeframes.
Perhaps the only trade is in copper, as some of the forum members mentioned.
I agree with Alan. I like to trade ( more like buy and hold style) of gold and oil related ETFs with high volumes. I might try copper in future. I used forex analysis help make gold and oil trading decisions. Personally I’ve never traded any Forex. Hope my feedback is helpful.
I think nothing is wrong in trading room. Its actually a great window you have open for trades. And im sure we all are benefitting from it. Im hopefully.
Hi Lara,
It is a great idea and I have followed your advise and have taken positions in oil and Copper and I was stopped out of the GBP today.
I do appreciate your efforts here and I certainly find it very useful.
Thanks
The trading room is great. I have made 2 successful trades that I have made from the info there. My copper position is still open and doing great… I just don’t post many comments in general… but I will if that’s what it takes to keep it going.
Thank you so very much all for your feedback. I’ve asked Cesar to look into the problems you are experiencing in posting comments on Trading Room posts.
So he can more easily identify the problem, if anyone wants to be specific on exactly what the difficulty is let me know. Do you get an error message? Does it work if you’re signed in? Not signed in?
Your comment Ben on the scrolling is noted. Passed onto Cesar.
Hi Lara,
I appreciate the videos very much and find them very good. I personally understand more from the videos then reading the text.
Thanks also for adding more text to the charts this makes it easier as well.
Idea: as USD/CAD and Oil as well as the USD index and Gold are liked together this might be interesting avenue to discover. So we could hedge Oil with USD/CAD for example.
All in all I am very happy with your diligent service, thank you very much for your hard work.
Hi Lara,
I suggest improving the comments section with a tool such as https://posativ.org/isso/ (Free) or https://disqus.com ($99/month), if the blog is in wordpress then the implementation is quite straight forward.
The aim of these tools is to facilitate communication, appreciation (e.g. thumb up/arrow up of a comment) and the overall community engagement.
P.S. is not a sales pitch and have no affiliation with the above products, I work on Product for a lot of digital startups.
Thank you for your comment Ciprian.
We did originally begin with Disqus, but Cesar found a security flaw and we had to stop using it. We want member comments, discussion and images to remain private.
Will ask Cesar to check into the other option you suggest. Cheers!
Hi Lara,
I stay in a remote area, right here in Malaysia. There’s only 1 mobile service provider that the signal is decent to surf net. Plus, the bandwidth (just like other 3G service provider) is kinda expensive, so I normally rely on your text analysis.
Adam
Gold hourly chart updated:
Minute iv may be unfolding as a flat or triangle. A triangle may actually fit better, it would keep price within the pink channel. A flat would need a breach of the channel at the end of minute iv.
Labelling as I think Alan has already outlined for minute wave iv (thanks Alan!). Minuette wave (b) an expanded flat. If minuette wave (b) doesn’t reach the minimum then we can rule out a flat for minute iv and focus on a triangle or double combination.
Both a triangle or double combination could keep price within the pink channel, so I’m actually going to lean towards those as maybe having a higher probability.
A flat would now need minute iv to break below support at the lower edge of the channel.
Lara,
Minute ii lasted 29 hours and was deep. At the low at 9:48 AM it was 34 hours. Is it probable that a shallow Minute iv (alternation) is over?
Yes, but it would be a double zigzag and so not exhibit alternation with minute wave ii in structure. But it would in depth.
When I look at the support at the pink trend line and the look of it on the daily chart I want to label it over.
But I won’t because alternation.
Thanks.
Alternation is a guide line not an EW Rule. (only has 3 rules)
Question, does it have to be followed each time or can one skip a few times? Not sure about it?
Look for it, expect it, but it doesn’t always happen.
Think of alternation as quite like much other technical analysis.
Some things we expect to see at price highs like RSI overbought, divergence, extreme ADX…. these things usually or almost always turn up, but not always. So their absence doesn’t mean price can’t turn, only the probability is lower.
Likewise the absence of alternation doesn’t mean the wave count is wrong, only that the probability is lower.
They may be lagging. That breakout still looks good and this looks like typical price behaviour after a breakout.
LOL
No worries John
So long as you don’t let the kid make trading decisions you’re all good 🙂
GDX had a consolidation. It broke above resistance on the 11th of April with a breakaway gap and strong volume to support the upwards breakout.
Now price is curving down to test support at prior resistance. This is very typical behaviour. When price does that it offers us a gift. Take it.
If the breakout was true then that breakaway gap should provide support.
The low for GDX today should be it. Today should offer a perfect entry to join an upwards trend after the breakout (or add to longs). Stops may be set just below the breakaway gap which is at 23.87 to 23.71. If the gap is closed then it’s not a breakaway gap and the breakout was false hence longs should be exited because something else would be happening.
Simple, classic technical analysis. Simple basic procedure.
Always use a stop. Do not invest more than 1-5% of equity on any one trade. Manage risk, it’s the single most important aspect of trading which is why I keep harping on about it.
Thanks Lara. I’m still holding onto my GDXJ, although it’s having underlying fundamental issues. But yesterday and today it’s price action has been more acceptable. I hope it rebounds and starts performing like it has been in the past. Thanks for your update on GDX. It really does help keep my emotions in check.
Keeping fingers crossed…
So far the wave count for Gold has been accurate. I expected a consolidation and that’s exactly what’s happening today. Price has bounced up off the lower edge of the channel provided on the hourly chart.
I’d say that’s pretty darn accurate and useful analysis.
I think the problem here is that $GOLD isn’t always positively correlated with GDX. In fact, GDXJ isn’t even always positively correlated with GDX. And you’re trading GDX and GDXJ based upon my analysis of $GOLD. So it’s just not always going to work for you, and there’s nothing I can do about that. I cannot make markets have a correlation.
The reason why I don’t provide daily analysis of GDX, GDXJ and others, is individual equities do not have sufficient volume for reliable Elliott wave analysis. Their waves and the structure just don’t always look right. Even AAPL doesn’t, and that’s got pretty big volume.
This chart above shows the correlation between GDX and $GOLD, and GDX and GDXJ.
The correlation between GDX and $GOLD just isn’t always there, so we cannot rely upon it.
The correlation between GDX and GDXJ is stronger, but still, not always. Right now it’s weakening.
Lara. This is very true.
When I trade NUGT or DUST, I do an analysis of those separately, EW and TA. Gold is good as a reference but the correlation is sometimes very vague. You just can’t use the gold analysis lock, stock and barrel and transpose it to the ETFs. Although the ETFs are supposed to track the underlying metal, that may not be accurate on a blow by blow basis.
The bottom line is that in trading, as in everyday life, nothing comes easy. We just have to exercise diligence. There is no one size that fits all.
I’m able to trade the Gold cash market with CFD’s from my broker.
Not ideal, but at least it’s tracking Gold price and my analysis is useful for me.
But yeah, trying to use my Gold analysis to trade a market with a weak correlation… not so good.
Agree, lots of ambiguity and resistance is a concern. Regardless of what the miners are doing, however, the count since 3/15 has been very accurate for gold. I’m very lopsided long gold vs. the miners (at the moment) since geopolitical concerns and risk aversion seem to be muting miner performance vs. the metal.
May be Minute iv is over at 9:47 AM?
Solid bounce so far…will be interesting to see how price reacts around upper resistance. Lot’s of blue sky over 1300.
The drop from the high of 1287.24 to the low of 1280.08 seems to be in 3 waves (a C wave has to be a 5). I am inclined to think that Minute 4 is an expanded flat. It is currently in the 3rd wave of its B wave up. Wave B: 1282.01 – 1287.24 – 1280.08 – 3rd of B.
If this count is correct, there will be a last big drop in the C wave targeting 1274 – 1276.
I’m inclined to agree Alan….my hunch since the open.
I’m counting low of 1280.08 as minuette (a) or poss. (w). Now 3/4 completed minuette (b)/(x). Soon to decline in (c)/(y). If ‘(b)’ is nearing completion….1274ish looks about right for ‘(c)based on length of ‘(a)’ wv- 16.88pts. [I took a look at Barcharts, but I’m using Tradingview at the moment].
Question…Alan…if you don’t mind. Are you a futures trader?
Melanie. No, like most of you, I’m day-trading. Futures is a totally different ball game. I have not found any reliable analysis method that can project that far into the future with a confident degree of accuracy. Also, to trade futures, I have to use a different brokerage, and they charge a much higher commission than the one I’m currently using.
To me, I’ll still favour Lara’s count for minuette a at 1282.01. That’s how I got minuette b as an expanded flat.
In any case, in the longer term I’m still favouring the uptrend. It’s just that from TA point of view the 1290-1300 area is very strong resistance. It’s approaching the weekly downtrend line as well as the top of the weekly Ichimoku cloud. It’s got to break those two before continuing to rise further. If it doesn’t, then the drop is first to the 1270s region as the first support shown by Ichimoku analysis as well as Lara’s EW analysis, and I’m pretty sure it won’t on the first try. From EW point of view, this is minuette b and minuette c at work. All these methods work together beautifully to paint this picture.
Alan…looks like a poss. subminuette b @ 1288.91[Barchart], now attempting a submin. c to form minuette (b), likely above previous high of 1294.96.
Other scenario…a triple top …here…now…about to give in to the downside? [Price is finding support @ mid channel line I added to my chart.]
I use Ichimoku Cloud. I can see how useful this is on weekly as you point out.
May I assume that your are an etf trader, if leveraged etfs, sticking to intraday trading as much as possible?
Melanie. You are right. I trade ETFs.
I’m looking for subminuette c = 2.618 * subminuette a at 1293.77. It has already gone past the 1.618 at 1288.54.
Hi Lara,
in my experience it is not smart to move the stops of the planned trade further away, as the risk increases with this. Plan an trade and trade the plan.
Thanks for the update
Fair enough. I’m leaving my stop as is.
It’s at 1,270.89. If members would like to follow that then be my guest. It’s up to you.
Lara.
Just a view of concern.
We assuming Gold being in the 3rd of 3rd of 3rd. Such a fasinating setup for traders who want to make many on the long side. My concern is the way bollinger band are being contracted no matter how strong and hard gold is trying to break above but these bands are pulling it back. Best examples was the trade yesterday. Now we are touching the upper bollinger band and if gold needs to fly as your projection is for next couple of days than how could it be possible without BB support.
Look at the study of a third wave I have given you.
Look at the equivalent point there, just after the overlapping ended. What did BB’s do then? Were they still contracting? Beginning to expand?
What are BBs doing now? Does it look the same? Or different?
Got my answer thank you😉😊
Dreamer, what are your thoughts on GDXJ today as I t took out 35.49. I was a little relieved when there was a good move up with heavy volume in the last 45 minutes of trading… but I’m still very concerned with this ETF…
GDX is also lagging gold’s move. When gold finished its minor 1 at 1264, GDX was at 25.57. Now gold has finished its minute iii of minor 3 at 1295, and GDX can’t get above 25.
I would have guessed GDX would be pushing 30 and GDXJ closer to 45… that’s not what’s happening, not even close.
Anyone have any ideas?
I meant to say when gold finished intermediate 1 at 1264, GDX was at 25.57… sorry about that.
Ari, I’m traveling until Thursday, so not able to spend a lot of time analyzing and charting. A few thoughts:
GDX- the trend looks pretty healthy and has been following my EW count pretty good. Staying in the channel and moving up step by step.
GDXJ- certainly frustrating and not moving up as expected. This whole issue with too much money and not enough Junior miners meeting it’s market cap guidelines, along with the freezing of share creation is obviously affecting it in the near term. It has spooked people into selling it would appear.
I think this all get worked out in the coming weeks, but not sure on the timing. Apparently Vaneck, the ETF company is rewriting the prospectus so that they can invest in miners with larger market caps. If you are willing to hold, I think it will get it together and perform better than GDX eventually, but no guarantees. Not sure how much the fund rebalancing will affect price in the short term.
GDX is certainly the safer bet for now. Now that GDXJ took out 35.49. It could go lower. Higher volume supported the selling the last 2 days. 32.66 absolutely needs to hold and I think it will.
This article may be useful:
http://www.etf.com/sections/features-and-news/popular-gold-miners-etf-change-dramatically?nopaging=1
The miners will likely move up faster once gold breaks above it’s bear market trendline.
PS reposted due to moderation
Thanks Dreamer for the explanation and your opinion… it does help my decision making.
Each equity has its own EW count. Although allied, gold and its ETFs pertaining to miners are only loosely correlated. Furthermore, miner ETFs have the limitation that they cannot allocate more than a certain percentage of their funds to their preferred companies. This is public knowledge. So, when they cannot purchase any more, traders would cash out as it means that prices will become stagnant. Coupled with the propensity of leveraged ETFs to decay over time, the decline becomes unavoidable.
Thanks Alan…
Me too, appreciate the simple, boiled down, what it all means.