
Yesterday’s analysis expected the correction to continue sideways for another day.
A small downwards day mostly fits the expectation and price remains well above the invalidation point on the hourly chart.
Summary: The correction is still most likely incomplete. It may continue further for yet another one to few days. Thereafter, the upwards trend should resume. The target for long positions remains at this stage at 1,333. If this is wrong, it may not be high enough.
New updates to this analysis are in bold.
Grand SuperCycle analysis is here.
Last monthly and weekly charts are here.
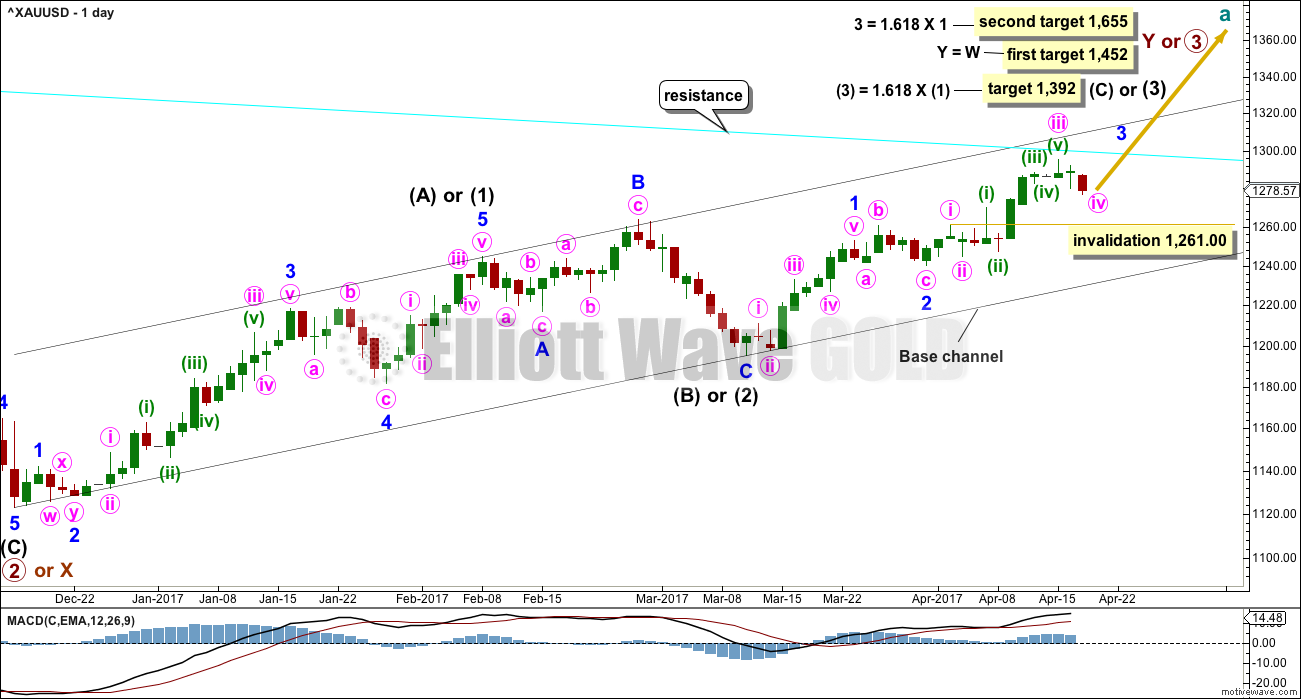
MAIN ELLIOTT WAVE COUNT
DAILY CHART
Click chart to enlarge.
This daily chart will suffice for both weekly charts.
Upwards movement at primary degree is either a third wave (first weekly chart) to unfold as an impulse, or a Y wave (second weekly chart) to unfold as a zigzag. If upwards movement is a zigzag for primary wave Y, then it would be labelled intermediate waves (A) – (B) and now (C) to unfold. It is most likely a third wave because cycle wave a is most likely to subdivide as an impulse.
Intermediate wave (1) or (A) is a complete five wave impulse lasting 39 days. Intermediate wave (2) or (B) looks like an expanded flat, which is a very common structure.
So far, within intermediate wave (3) or (C), minor waves 1 and 2 are now complete. Minor wave 3 looks to have begun. Within minor wave 3, the middle portion for minute wave iii may now be complete. Minute wave iv may not move into minute wave i price territory below 1,261.00.
Minute wave v is expected to be very strong, possibly ending with a blow off top.
A cyan trend line is added to all charts. Draw it from the high in October 2012 to the high in July 2016. This line has been tested five times. Price is finding resistance at the cyan trend line now. If price can break through resistance here after some consolidation, then that may release energy to the upside for the end of minor wave 3.
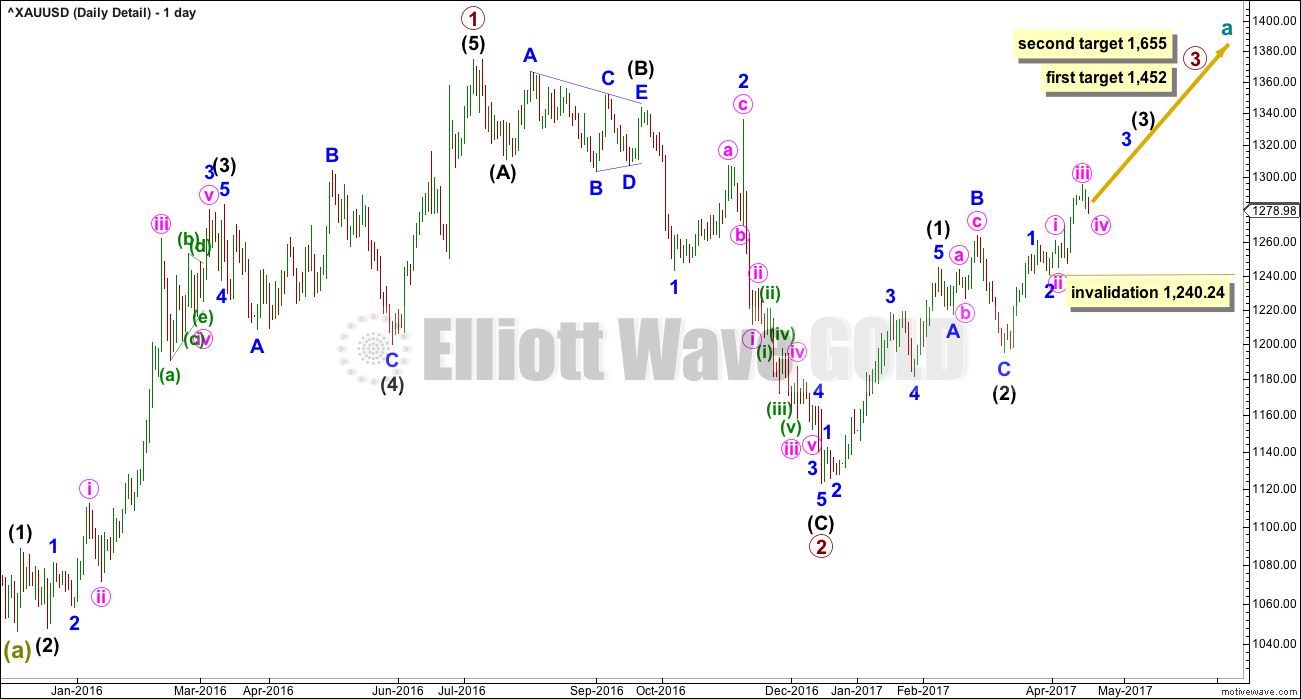
DAILY CHART – DETAIL
Click chart to enlarge.
This chart steps back to see all movement since the important low on the 3rd of December, 2015.
To see how this fits into the bigger picture, please see the last historic analysis linked to at the start of this analysis.
The first upwards movement labelled primary wave 1 fits well as a five wave impulse. Primary wave 2 fits as a zigzag. It would be difficult to see the downwards wave of primary wave 2 as an impulse because that would require ignoring what looks very much like a triangle at its start (labelled intermediate wave (B) ). To see this as an impulse that movement would need to be a second wave correction, but second waves do not subdivide as triangles.
Primary wave 3 should have begun. Within it intermediate waves (1) and (2) should be complete. Intermediate wave (2) is a very common expanded flat correction.
My only concern at this stage is the labelling of minute wave iii as complete. It is possible that the middle portion of this third wave at three degrees has passed, if the next waves up for minute wave v and minor wave 5 are both very long and strong extensions.
It may also be possible that the middle of the big third wave has not passed and the degree of labelling within minor wave 3 needs to be moved down one degree. If minute wave ii is yet to unfold, it may not move beyond the start of minute wave i below 1,240.24.
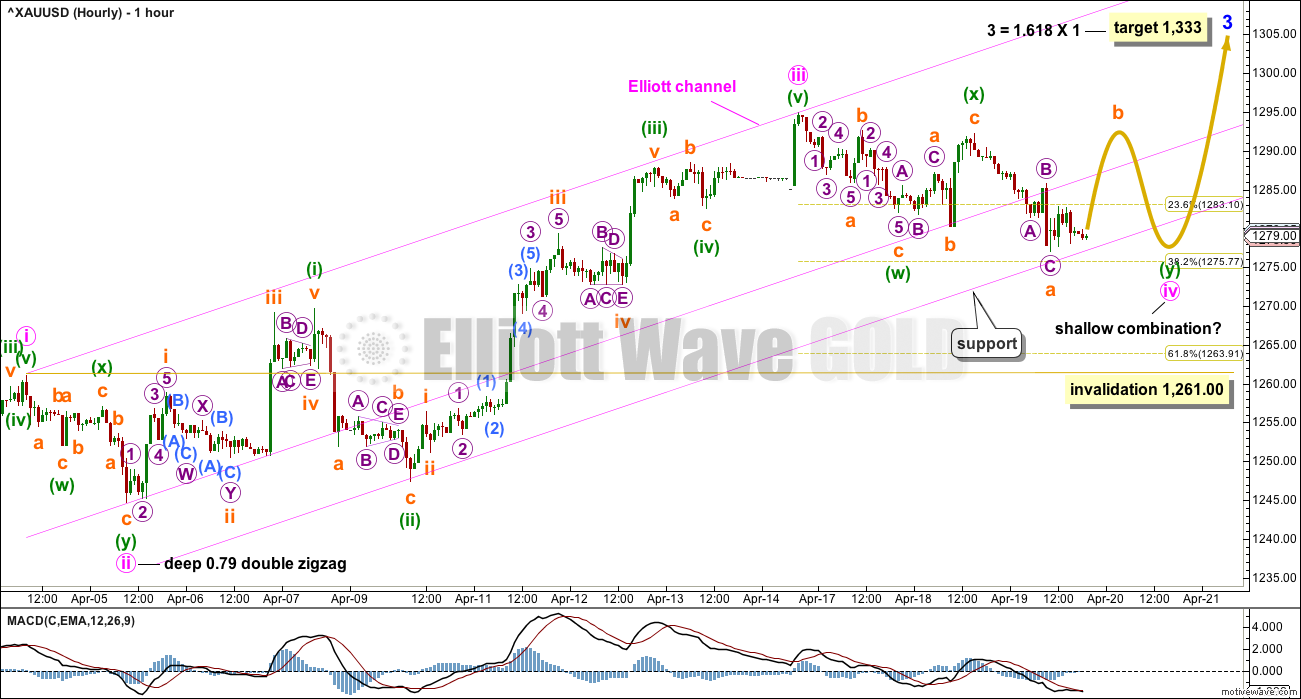
FIRST HOURLY CHART
Click chart to enlarge.
Minute wave ii was a deep 0.79 double zigzag, which lasted 25 hours, and on the daily chart it shows as only one session.
Given the guideline of alternation, minute wave iv may be expected to most likely be a flat, combination or triangle. All of these structures may include a new high above its start at 1,294.96 as part of the correction. A new high does not indicate minute wave iv is over.
Combinations, flats and triangles are all usually more longer lasting structures than zigzags.
At this stage, a flat correction for minute wave iv may be ruled out because there is no upwards wave within it that has retraced a minimum 0.9 length of any downwards wave within it. The minimum length for minuette wave (b) within a flat correction for minute wave iv has not been met.
That leaves two possibilities. This first hourly chart looks at a possible combination for minute wave iv.
If minute wave iv is a combination, then the first structure within it labelled minuette wave (w) may be a complete zigzag.
The two structures in the double may be joined by a complete three in the opposite direction labelled minuette wave (x), which subdivides as an expanded flat correction.
Minuette wave (y) may have begun. It may be either a flat or a triangle. If it is a triangle, then it may continue to find support at the lower pink trend line.
The Elliott channel is drawn using Elliott’s first technique. A parallel copy is added and pulled down to sit on the end of minuette wave (ii) within minute wave iii, so that all of this upwards movement is contained. This lower edge may be where downwards movement now finds some support.
Fourth waves are not always neatly contained within Elliott channels, which is why Elliott developed a second technique to redrawn the channel when a fourth wave breaches it. A breach of this lower trend line now would not mean this wave count is invalid, only that the fourth wave is continuing.
Minute wave iv may not move into minute wave i price territory below 1,261.00.
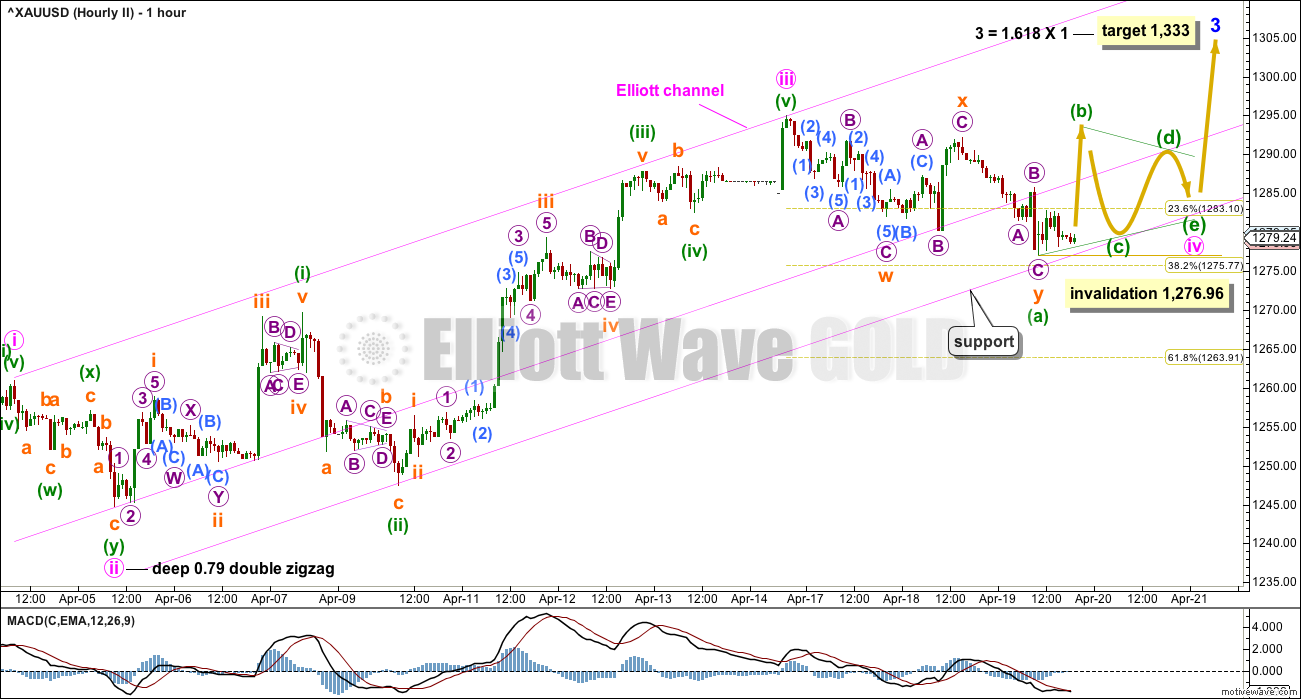
SECOND HOURLY CHART
Click chart to enlarge.
This second hourly chart looks at the possibility that minute wave iv is completing as a contracting triangle. If this idea is correct, then it may continue to find support at the lower pink trend line.
Within the triangle, minuette wave (b) may make a new high above the start of minuette wave (a) at 1,294.96 if minute wave iv unfolds as a running triangle. 40% of triangles will do this.
Within the triangle, minuette wave (c) may not move beyond the end of minuette wave (a) below 1,276.96. At this stage, the triangle would be invalidated by a new low below this point.
This idea may see minute wave iv continue for another few days. Triangles can be very time consuming structures. Their purpose is to take up time, move price sideways, and provide endless frustration and confusion for traders.
If minute wave iv unfolds as a triangle, then the next wave up for minute wave v may be surprisingly short and brief. Gold often exhibits short and brief fifth waves out of its fourth wave triangles. There is a good example of this on the Daily Detail chart above; see the wave labelled minute wave v (ending on 4th March, 2016) of minor wave 3 of intermediate wave (3). This fifth wave lasted only two days and was less then the widest part of the triangle that preceded it.
If minute wave iv is a triangle and minute wave v is short and brief, then the blow off top may then be expected for minor wave 5 to end intermediate wave (3), and / or the end of intermediate wave (5) to end primary wave 3.
TECHNICAL ANALYSIS
WEEKLY CHART
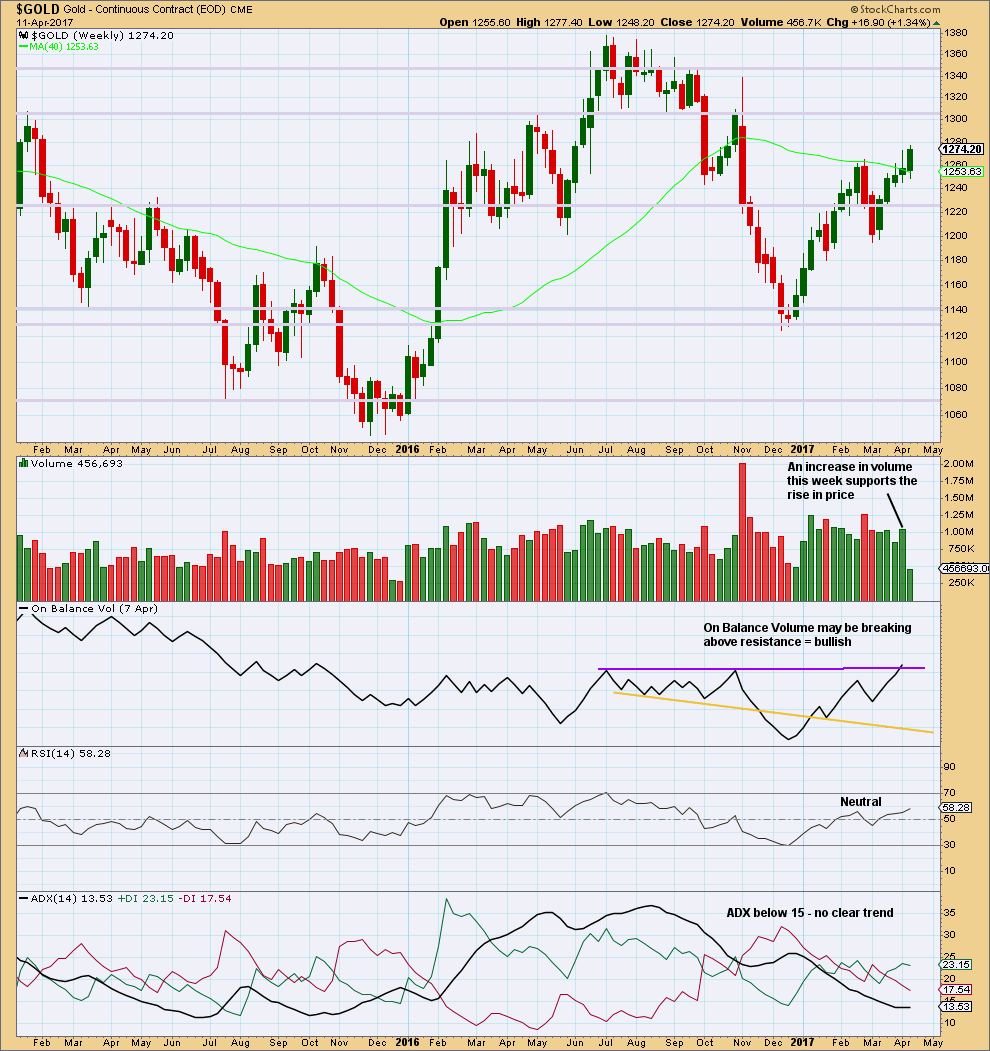
Click chart to enlarge. Chart courtesy of StockCharts.com.
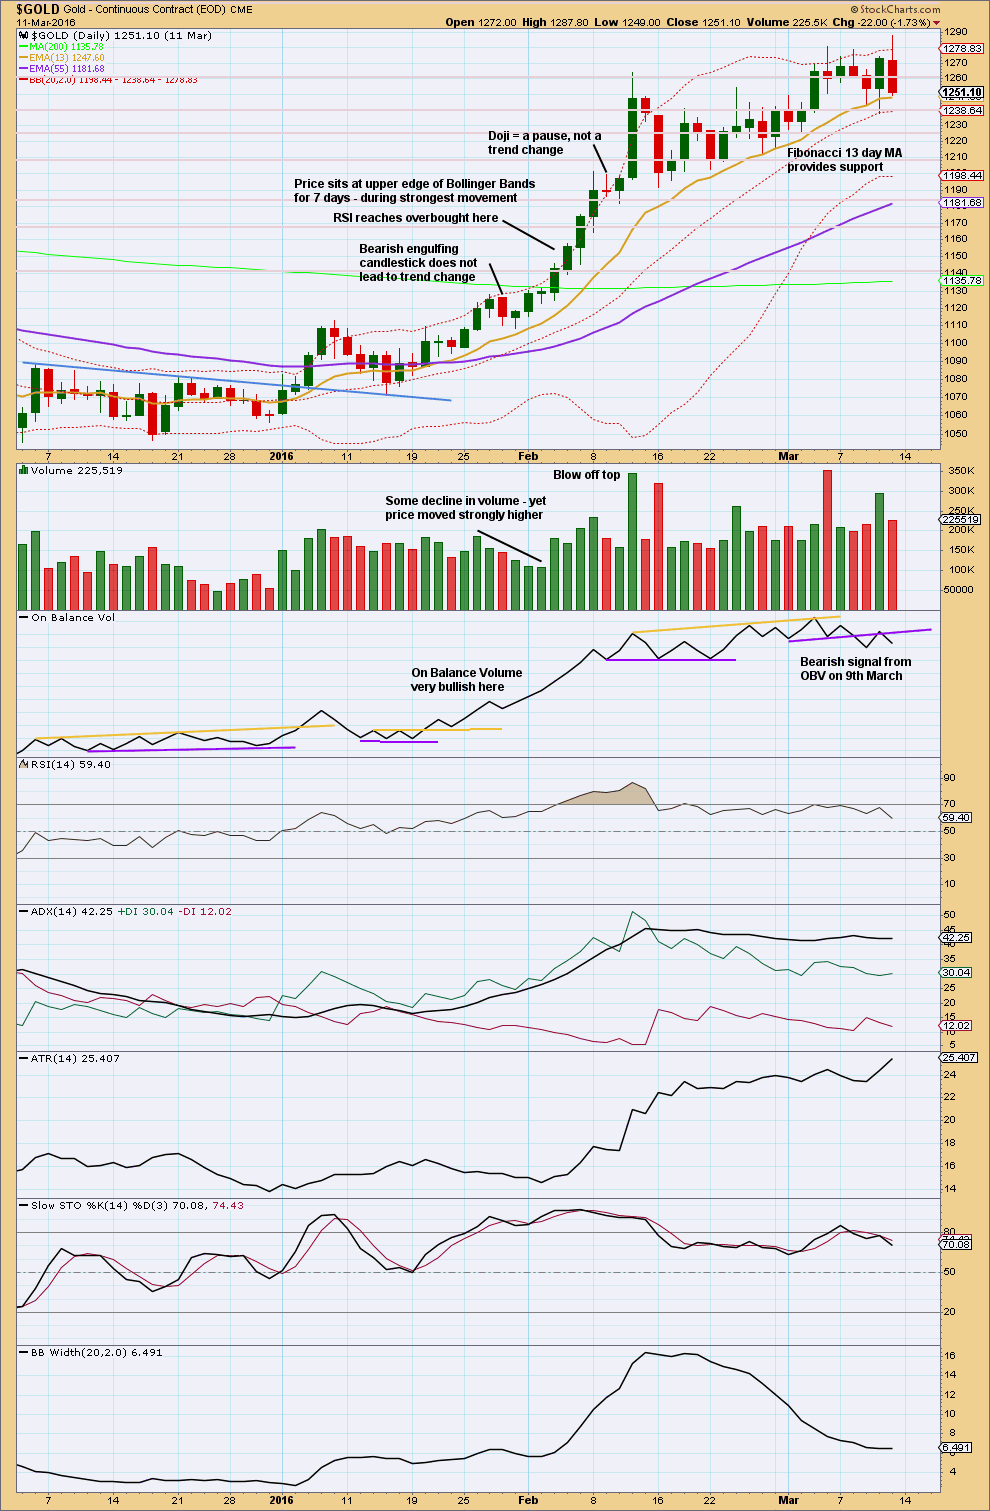
The relatively long upper wicks of the last two weekly candlesticks are a little bearish. The increase in volume last week is bullish.
The purple trend line on On Balance Volume has been carefully drawn to be as conservative as possible, sitting along the prior two highs. This trend line has a very shallow slope and is reasonably long held. It has only been tested twice before. It has some reasonable technical significance. Last week it is slightly breached offering a reasonable bullish signal. However, for the signal to have more weight it needs a clearer breach.
DAILY CHART
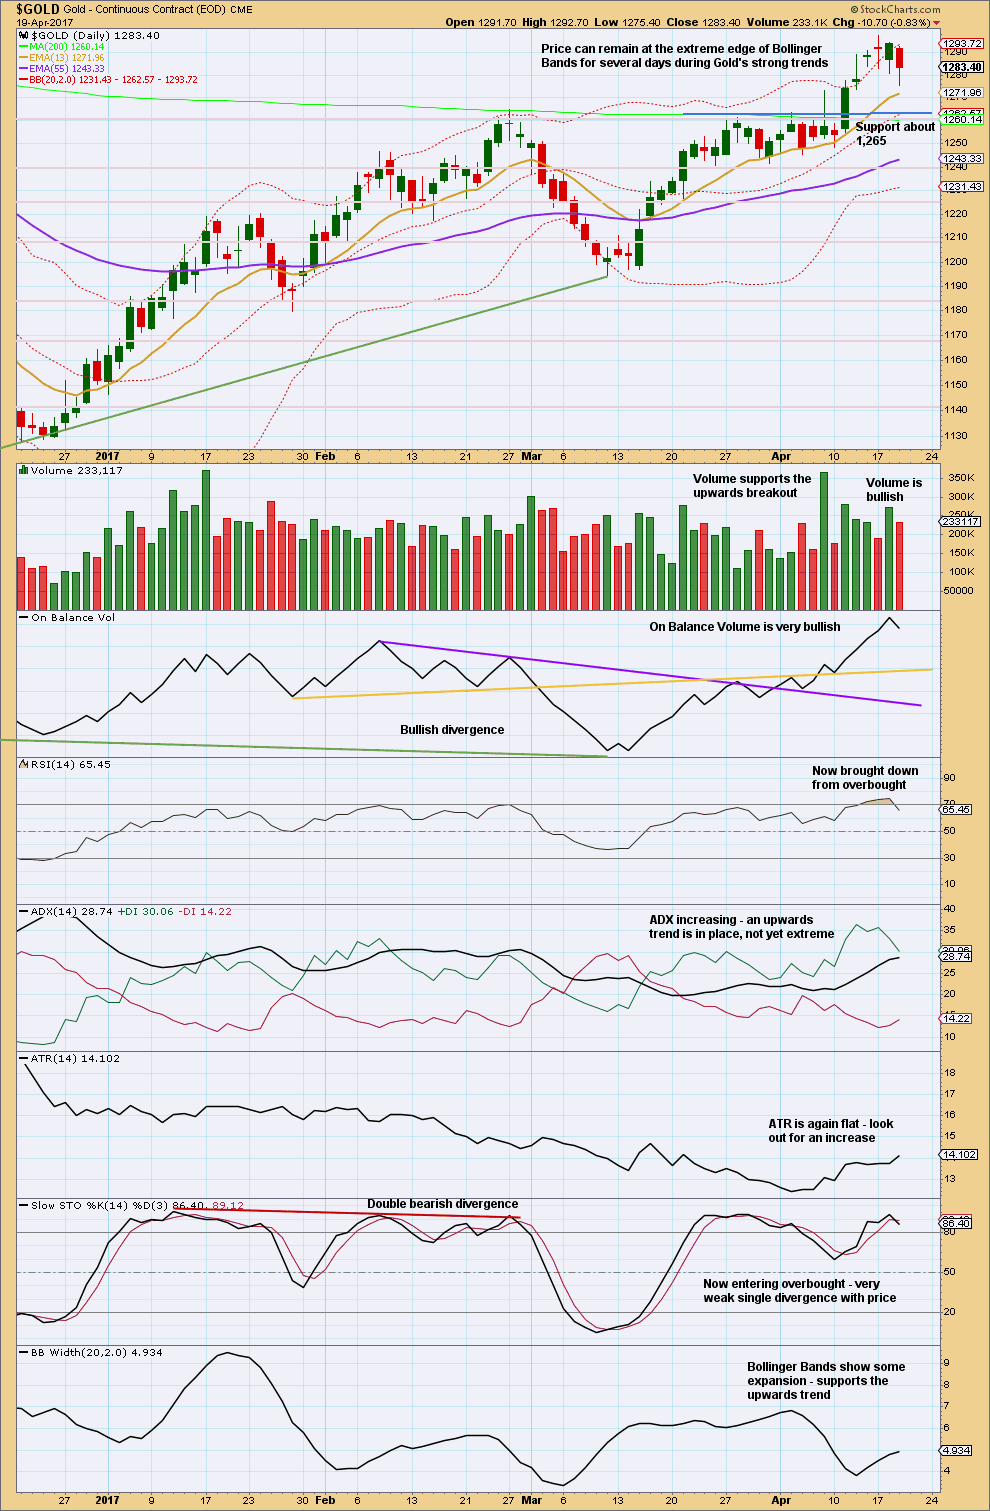
Click chart to enlarge. Chart courtesy of StockCharts.com.
I do not have confidence in the data from StockCharts for the daily candlestick for the 12th of April. As the session ended, I did not see a spike down to 1,278, which is their close, and creates the long upper wick on their candlestick.
Yesterday completed a day with the balance of volume upwards, and volume showed an increase. This is bullish. Now today completes a day with the balance of volume downwards, showing a decline. The downwards movement during Wednesday’s session did not have support from volume, so at this stage it looks more likely to be a small pullback within a continuing upwards trend.
The long lower wicks on the last two daily candlesticks are bullish. Volume is bullish. On Balance Volume is very bullish. ADX is still bullish. Bollinger Bands are bullish.
RSI coming down from overbought means there is again plenty of room for price to rise. This is good to see for the bullish scenario.
Stochastics may remain extreme for long periods of time when Gold has a strong trend. Only when it has been extreme for a while and then exhibits clear divergence with price (preferably multiple) is it a strong warning. That is not the case yet.
This chart overall remains bullish. The larger trend remains up. Corrections are an opportunity to join the trend or to add to long positions.
TRADING ADVICE
I have left my stop on my long position at 1,270.89. If price comes down again to the lower trend line, it may present another opportunity to add to long positions. Stops for new long positions may also be set at 1,270.89, but there is a risk here that a whipsaw may close out longs only to see price move higher. Alternatively, set stops just below 1,261 for new long positions here, and reduce position size to keep risk from 1-5% of equity.
Profit targets may be set at 1,333 in the first instance.
As always, risk management is the single most important aspect of trading. Take it seriously. My two Golden Rules are:
1. Always use a stop.
2. Invest only 1-5% of equity on any one trade.
GDX
DAILY CHART
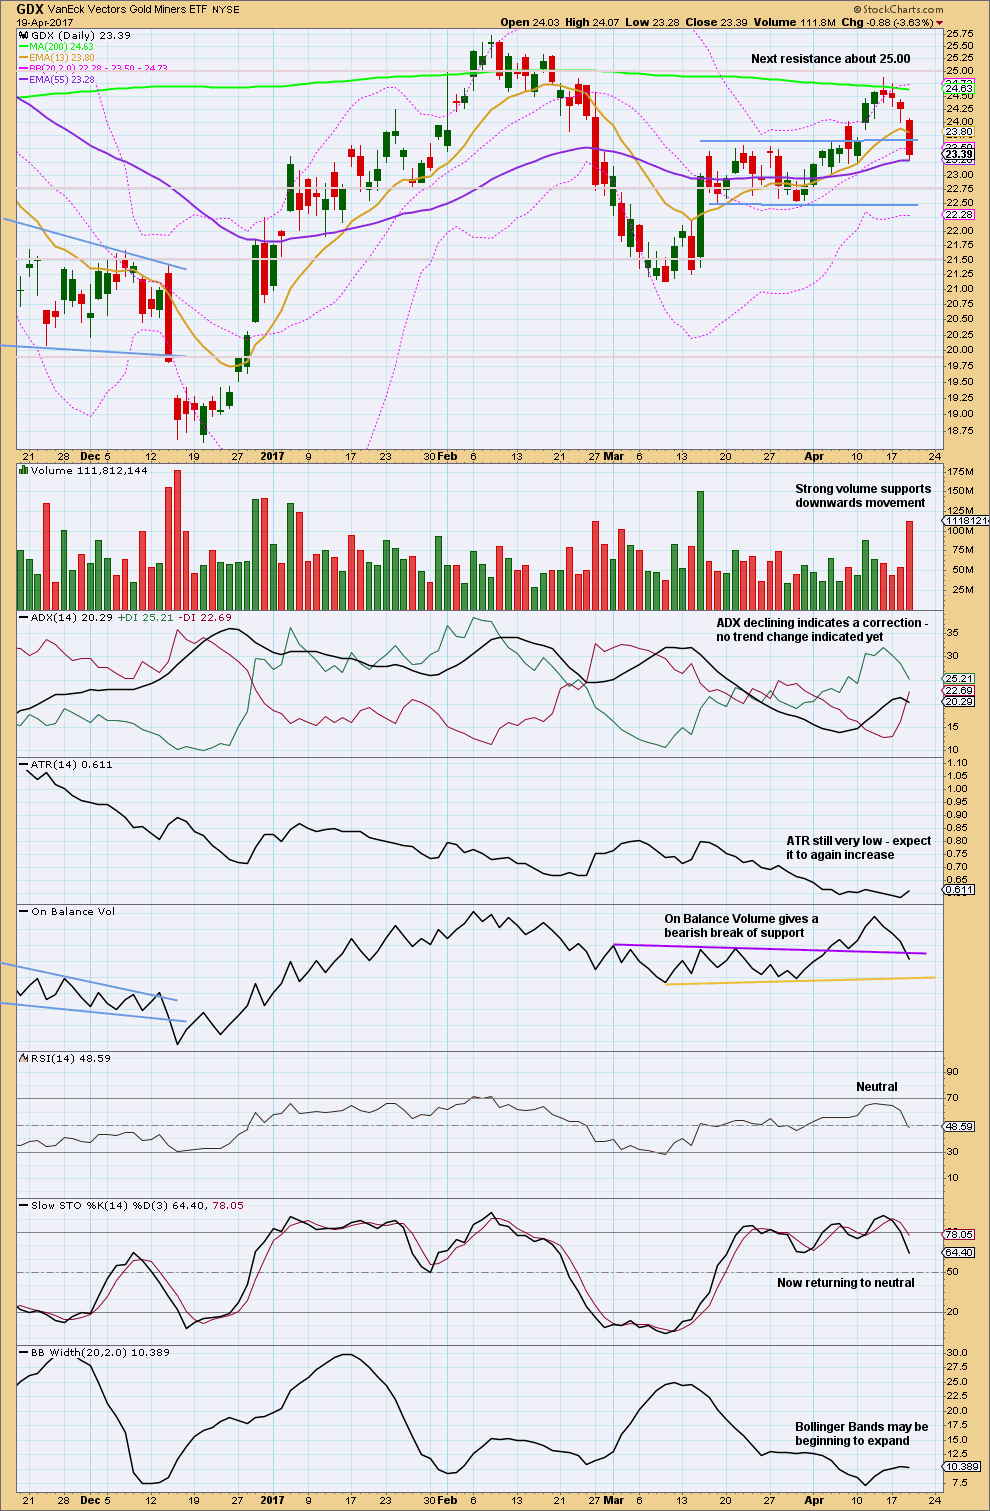
Click chart to enlarge. Chart courtesy of StockCharts.com.
The prior gap labelled a breakaway gap in yesterday’s analysis is now closed. This means it is not a breakaway gap.
Price has closed back within prior consolidation. The upwards breakout is now proven to be false. While this was not expected, sometimes it does happen. The probability was low but not zero.
There is some distance to go before On Balance Volume finds support and price finds support. There is room here for more downwards movement. Support is about 22.50 again.
STUDY OF A THIRD WAVE IN $GOLD
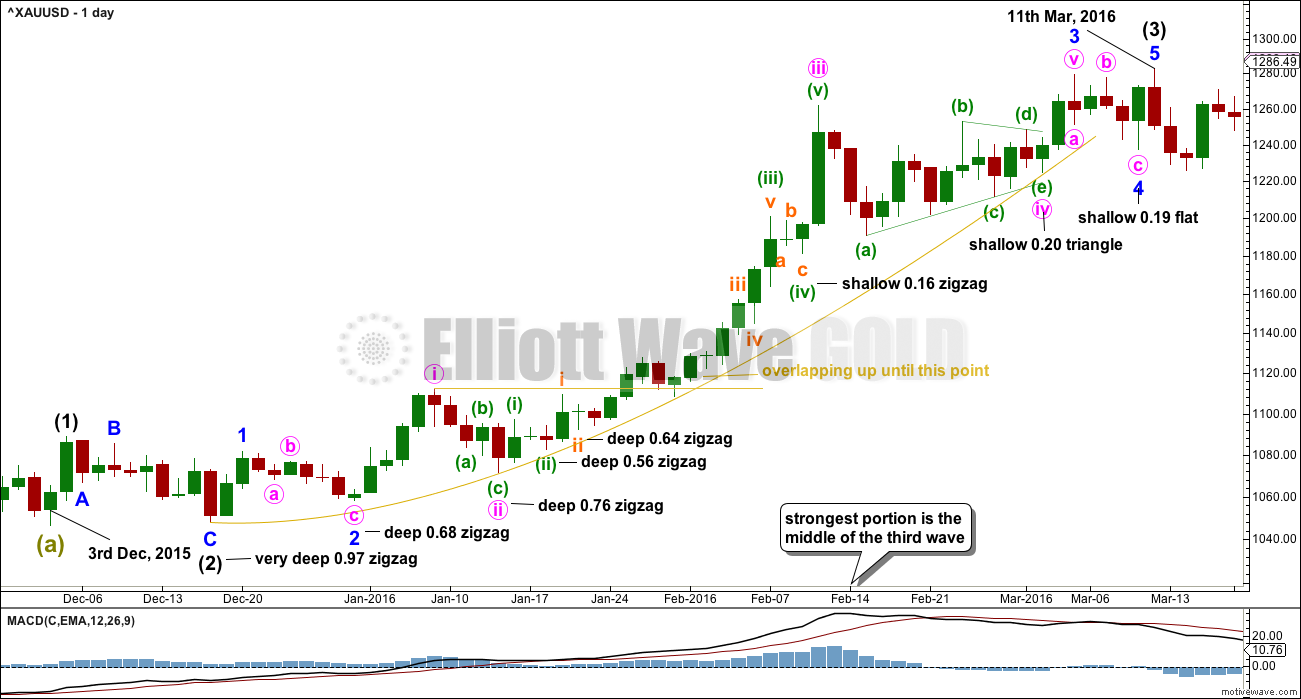
Click chart to enlarge.
This study of a third wave will be left in daily analysis until the current third wave is either proven to be wrong (invalidated) or it is complete.
This third wave spans 59 trading days.
It was not until the 40th day that the overlapping ended and the third wave took off strongly.
The middle of the third wave is the end of minute wave iii, which ended in a blow off top.
There is excellent alternation between second and fourth wave corrections.
This third wave began with a series of five overlapping first and second waves (if the hourly chart were to be added, it would be seven) before momentum really builds and the overlapping ends.
The fifth wave of minuette wave (v) is the strongest portion.
This third wave curves upwards. This is typical of Gold’s strong impulses. They begin slowly, accelerate towards the middle, and explode at the end. They do not fit neatly into channels. In this instance, the gold coloured curve was used.
Click chart to enlarge. Chart courtesy of StockCharts.com.
This trend began after a long consolidation period of which the upper edge is bound by the blue trend line. After the breakout above the blue trend line, price curved back down to test support at the line before moving up and away.
RSI reaches overbought while price continues higher for another five days and RSI reaches above 85. The point in time where RSI reaches overbought is prior to the strongest upwards movement.
ADX reached above 35 on the 9th of February, but price continued higher for another two days.
The lesson to be learned here: look for RSI to be extreme and ADX to be extreme at the same time, then look for a blow off top. Only then expect that the middle of a big third wave is most likely over.
The end of this big third wave only came after the blow off top was followed by shallow consolidation, and more highs. At its end RSI exhibited strong divergence with price and On Balance Volume gave a bearish signal.
Third waves require patience at their start and patience at their ends.
This analysis is published @ 08:06 p.m. EST.
I wonder if Gold is hanging at the highs here due to the French elections and the potential for a “surprise”?
The triangle isn’t looking quite right, which is great, because a triangle means a quick short fifth wave to follow.
A combination is looking okay at this time. And I don’t think it’s done yet.
Huge dumping of contracts into the precious metals futures market the last few days, and over very short periods. It is not working. Hee! Hee! 🙂
Yup, either accumulation for the move higher, or distribution before the big dump.
In hindsight, it makes sense to pause at the major overhead resistance of 1290-1300.
There’ll be lot’s of short covering with a move over 1300, which is why I think 1333 (the Trump spike high area) is totally realistic very soon…could see a longer 4th wave pause after that though.
Alan and Dreamer,
Thank you for excellent analysis. Alan I use Ichimoku Cloud on most of my charts and have researched to find better explanations of how to use all aspects of indicator correctly. This has been an excellent lesson for me.
David…you input is well noted…all of us are watching closely.
Jordan…TDG…seeing temporary relatively disappointing action in the miners and gold…nice action, but stalled out for now.
Gold futures supports: $1260 @ 200dma, if breaks…$1220….400dma [and 50% fib retrace]
GDX: while EWI currently suggesting 22.53, Jordan suggests…could go lower to $21…400dma.
GDXJ: Jordan thinks price of this instrument will straighten out over time, but will move further away from being a ‘tried/true’ barometer for junior miners as brokers are selling those juniors within GDXJ as larger miners are being added towards June 17 deadline. I have noticed that JDST moves like ‘a bat out of #$!*’ but, with JNUG [lately] it is taking A LOT to move it up positively. At this time they seem to be selling those juniors which adds to these etfs under performing.
I sent Jordan attached goldtadise.com comment upon which he commented that GDXJ has become a ‘victim of its own success’.
GDXJ support: @ $33, $32…400dma and $32.
Please see goldtadise.com comment attached from Apr 18…Alex33
Right now Gdxj holds junior gold mining stocks in the 80 to 98 percent range. These are the smallest miners. The 1 to 10 percent range would be the largest. It will rebalance in June and have miners in the 60 to 98 percent range. Canada has a rule that only allows funds to buy 20 percent of a Canadian stock. They are buttressing up against this in some of their small caps. New funds are being held in Gdx (5 percent) and other precious metal instruments. These will be sold and rolled into the 60 to 98 percent smaller cap gold miners come June. Gdxj may be front running a move down in gold should there be a window of peace. Look for an opportunity should Gdxj start to flatline, or spike down and reverse while gold is going down, which could be happening now, imo.
To me it looks as though an ascending triangle has just completed the combination. Now off to the races…*maybe* one more touch of the lower trend-line, but we’d be splitting hairs to position long.
[hourly chart attached, don’t mind price levels – June Futures]
Corey
This could very well be the answer and makes sense on many levels. Thank you Corey
While technically it could be a barrier triangle (because D ends very slightly above B), it doesn’t really look right….. it’s coming to a too quick conclusion. D and E are too brief.
Now, if it meanders sideways for another session it may look better.
*edit: just checking the same points on my BarChart data…. I have the point you have labelled E as below your C which would invalidate a triangle….
I noticed that discrepancy on your BarChart data. I’m curious as to why you use the spot price (or is it something else?) vs. the most liquid and highest volume contract, which is currently June. I know it doesn’t make for easy transitions when contracts roll, but I would tend to give more weight to the highest volume contracts. The notional value of the June contract traded was over $32 billion today.
Futures have higher leverage and that can cause extreme price movements that aren’t seen in the cash market. Cash is better for Elliott wave analysis for this reason.
you may be absolutely correct, but it looks like a 4th wave here and should be followed by a short sharp 5th down.
David,
I see you have listed many fundamental reasons not to go long gold. However EW followers basically follow the waves which should portend/factor in all of your points. In other words we are technicians not fundamentalists.
I understand but if other markets technicals are not supporting the EW count, then maybe the EW count is not correct?
I’ve replied to your comment with a chart.
yawn, yawn this is becoming really drawn out.
Nick, I think it is going to get exciting if 1275 breaks. Gold longs get ready to feel some pain…IMHO. Consolidating on support here and not bouncing, I don’t think is bullish. Unless there is a war, gold seems like it could hit 1250 or lower quickly.
The Top 7 Reasons it appears gold is in trouble here:
1) USD/Yen ratio appears to be bottoming…this is bullish stocks and bearish gold.
2) Yen is falling, bearish gold as they are strongly correlated.
3) Bonds look toppy/overbought. Gold moves opposite yields. Bonds down (yields up) = gold down.
4) Real rates: TIP/SHY is rolling over. When real rates (yield-inflation) rise, gold falls.
5) Miners lagging gold of late is bearish…GDX/GLD is falling.
6) Jr. miners lagging miners. GDXJ/GDX ratio falling…bearish.
7) SLV/GLD is lagging…silver usually leads strong precious metals rallys.
If Lara’s trend line breaks, and it is on it now, “Katy-bar-the-door.” Gold could be in trouble…IMVHO.
As long as war does not breakout with N. Korea or Iran…then, all bets are off.
Short miners in JDST for a few days and may add on a breach of the gold channel.
Be at peace,
David
There are some assumptions in your comments here.
Rather than assuming a relationship, either positive or negative, for say Gold to USDJPY or Gold to Bonds, look at the correlation coefficient.
I’ve added the correlation coefficient to the weekly chart here for Gold for USDJPY and Bonds. They’re just not consistent in their correlation. So we cannot assume a correlation, the math shows it’s not true.
Longer term Ichimoku Analysis
Zooming out to a weekly view, the bigger picture can be gleaned:
(1) The trend is bullish since the cloud is green.
(2) The trend strength is currently neutral as price is still within the cloud. That is why price is still consolidating.
(3) The bullish signal was generated when the blue tenkan-sen crossed the red kijun-sen from below, near the end of March.
(4) Notice that price is touching the top of the cloud this week. That is an area of strong resistance, and that is why price turned south at the beginning of this week, at 1294.96. Once price breaks this resistance, it will be establish a strong bullish trend.
(5) Note also that the cloud turns red at the beginning of July. This signals initially a stall in the uptrend. How price and the signal lines behave will then indicate what will transpire.
Alan, very interesting. July 20 is my target for gold move up to end. Seems to mesh fairly close with the cloud turning red. Thanks for sharing 👍
interesting interpretation of the cloud Alan, thanks!
Ichimoku Analysis for today
The trend is still bullish:
(1) The cloud is green.
(2) The bullish trend is strong because price is above the cloud.
Support:
(1) Long-term support, 26 days into the future, is provided by cloud support = 1259.95.
(2) First support = 1272.80, given by the fast-moving tenkan-sen (blue).
(3) Base support = 1247.10, given by the slow-moving kijun-sen (red).
What this means is that if price breaks down below 1272.80, it will test cloud support. If it enters the cloud, a trend change is indicated. If it continues further, the base support should hold. If not, it will be free fall.
Resistance:
(1) First (and only) resistance = 1283.40, given the 26-day lagging Chikou-sen.
So what about little brother GDXJ? Have all the issues that we have been discussing completely ruined it?
Maybe not. I think I found a wave count that actually makes perfect sense. Minor wave 1 has been identified as a leading expanding diagonal for some time now. I then labeled the low on 3/28 as Minor wave 2 in total, but I was puzzled because it wasn’t as deep as one would expect following the diagonal.
Now, moving forward 3 weeks, GDXJ made a lower low to the .786 retracement of Minor wave 1. This now makes perfect sense as a deep retrace for a diagonal. It is a bit out of proportion that Minor wave 1 is only 7 days and Minor wave 2 is 23 days as a regular flat, but it still works as flats take more time.
If this is correct, GDXJ should start once again moving up from here. A breach of 32.66 and all bets are off as the Bears will be in full control.
https://www.tradingview.com/x/YgbKv8iC/
Wonderful analysis.
It is a coincidence that NUGT retrace is also at 0.786.
Yep! If you are not yet long the miners you are looking at a gift horse!
I also was thinking we still have to complete the C wave of an abc second wave correction.
The coming move is going to be YUGE! 🙂
GDX showed weakness with a deep pullback on higher volume which resulted in a gap fill. If support at the top of the symmetrical triangle holds, then the bulls will still be in charge.
GDX needs to move up from here for the bulls. A continued move back down into the triangle would result in a very bearish false breakout. The count has been updated. The invalidation for Minute wave 2 is 22.53.
https://www.tradingview.com/x/iIz4oEvf/
Love this.
Gold found resistance @ the “trump election” spike trend line. An upwards break would likely initiate a strong move.
Silver price is back testing it’s inverted H&S neckline.
GDX has filled the gap and is now back testing the symmetrical triangle breakout. Bulls want to see this support hold.
The $USD is still below it’s neckline, but above the triangle support.
https://www.tradingview.com/x/5byxLb5c/
Lara,
can you please do an update for the FTSE in the Trading Room?
If it looks like it’s giving an opportunity, yes.
NUGT Analysis
Due to the reverse split nature, analysis could only be accurate for the short-term. This analysis focuses on the portion of the chart beginning at 7.40 (2017 March 9). Of heartening note is that an inverse H&D is forming (not fully shown on the chart, you need to go to longer timeframes). The brown line drawn on the chart is the short-term downtrend line beginning at the high of 13.70 (2017 February 8). Do note that price had broken above the downtrend line as far as 11.62 (2017 April 13) and is now dropping for a back-test of the downtrend line. This provides the textbook setup for buying after a “final kiss” of the downtrend line.
There are two scenarios to consider:
(a) The double zigzag in gold.
For NUGT, the EW count will be
7.40 (beginning of Int 3)
10.00 (Minor 1)
8.69 (Minor 2)
11.62 (Minute 1 of Minor 3)
(9.50) (Theoretically 9.32 so there is one more low to come, Minute 2 of Minor 3)
My expected target is 14.06 for Minor 3. This corresponds to 1332 for gold.
(b) The triangle in gold.
For NUGT, the EW count will be
7.40 (beginning of Int 3)
10.00 (Minor 1)
8.69 (Minor 2)
11.62 (Minor 3)
(9.50) (Should be higher corresponding to the end of the triangle, Minor 4)
This is an ending diagonal structure. I expect the target to be in the vicinity of 12.
Comments are appreciated.
I choose (a) 🙂 the first scenario, because the second has an overlap between the fourth wave and first wave.
I like the test of support at that trend line. If that line holds, then the probability of a good upwards wave looks high.
But then… I expected that breakaway gap on GDX to offer support…. these things just don’t always work.