
A correction was expected to continue for another one to few days. Today’s red candlestick with a long lower wick mostly fits that expectation.
Price remains above the invalidation point but the wave count no longer has the right look, so today it is changed.
Summary: The pullback is likely to be another second wave correction that looks fairly likely to be over here. Look out for strong upwards movement. The target is now at 1,355 and the invalidation point is now at 1,240.24.
New updates to this analysis are in bold.
Grand SuperCycle analysis is here.
Last monthly and weekly charts are here.
MAIN ELLIOTT WAVE COUNT
DAILY CHART – DETAIL
Click chart to enlarge.
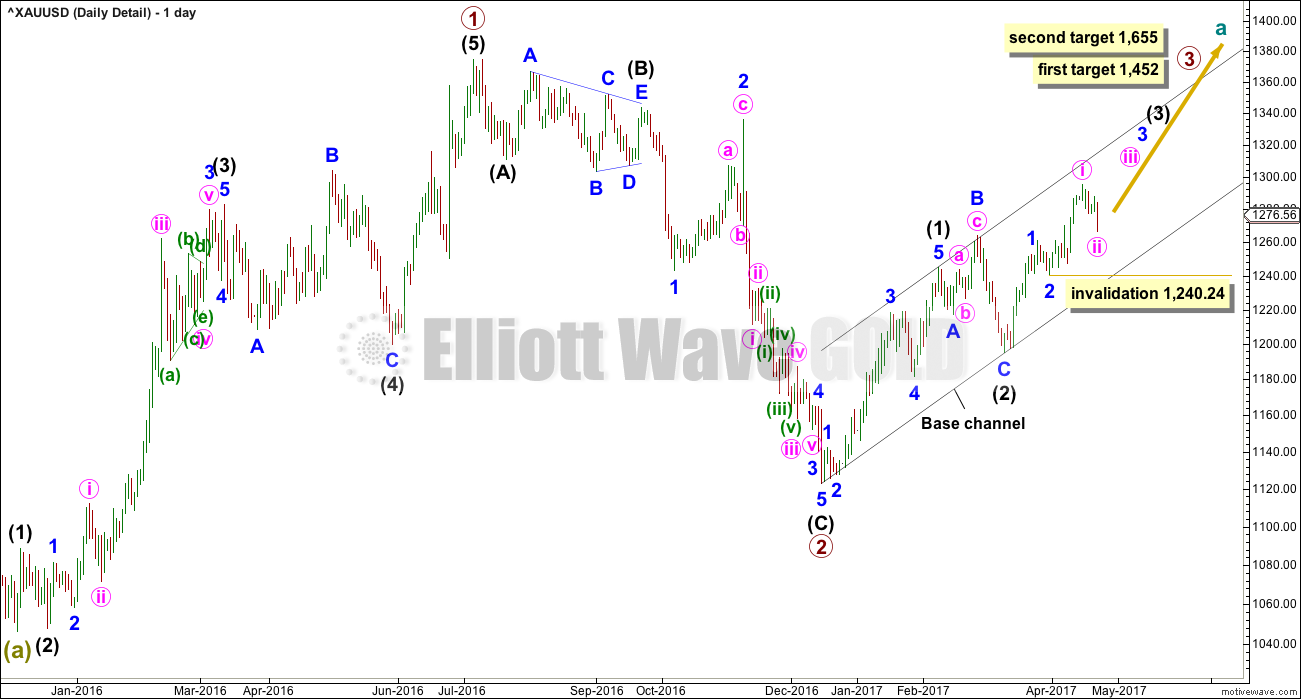
This chart steps back to see all movement since the important low on the 3rd of December, 2015.
To see how this fits into the bigger picture, please see the last historic analysis linked to at the start of this analysis.
The first upwards movement labelled primary wave 1 fits well as a five wave impulse. Primary wave 2 fits as a zigzag. It would be difficult to see the downwards wave of primary wave 2 as an impulse because that would require ignoring what looks very much like a triangle at its start (labelled intermediate wave (B) ). To see this as an impulse that movement would need to be a second wave correction, but second waves do not subdivide as triangles.
Primary wave 3 should have begun. Within it intermediate waves (1) and (2) should be complete. Intermediate wave (2) is a very common expanded flat correction.
The material change today to the wave count is to see only minute wave i within minor wave 3 complete. The middle of this big third wave now looks unlikely to have passed, so it is still ahead. This has a better look on this bigger picture view.
Minute wave ii may not move beyond the start of minute wave i below 1,240.24.
DAILY CHART
Click chart to enlarge.
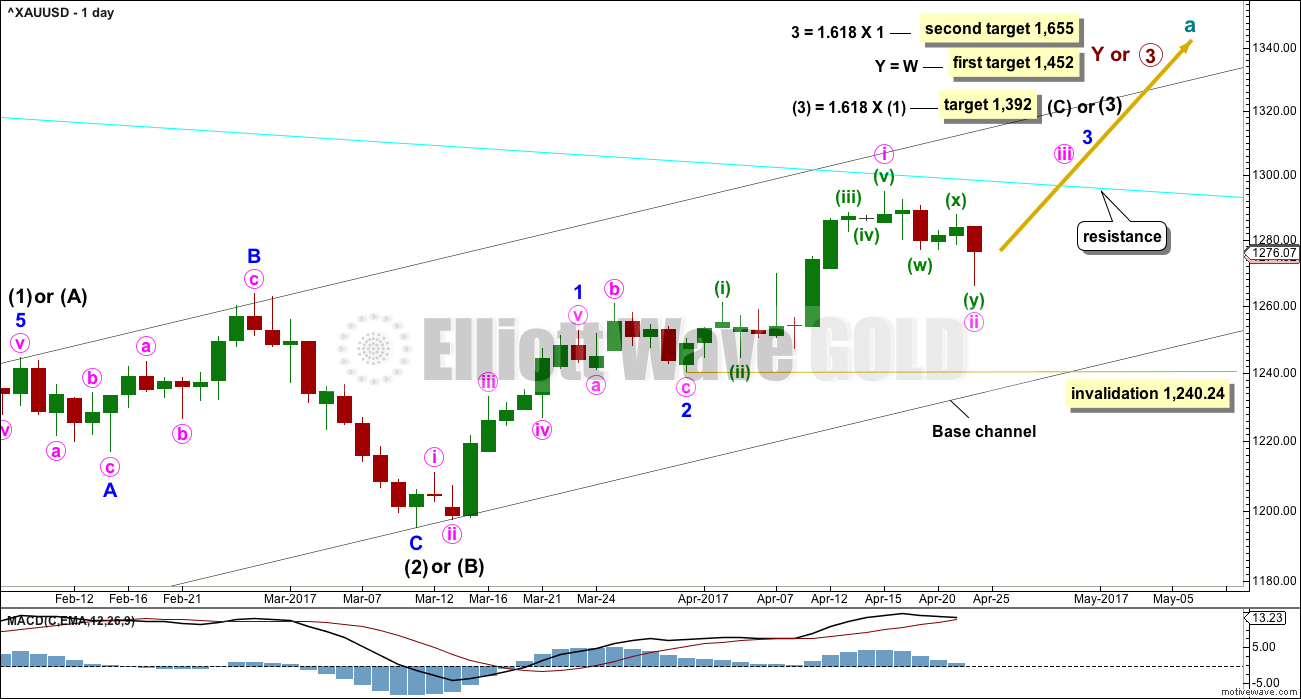
This daily chart will suffice for both weekly charts, which can be seen in the last published historic analysis.
Upwards movement at primary degree is either a third wave (first weekly chart) to unfold as an impulse, or a Y wave (second weekly chart) to unfold as a zigzag. If upwards movement is a zigzag for primary wave Y, then it would be labelled intermediate waves (A) – (B) and now (C) to unfold. It is most likely a third wave because cycle wave a is most likely to subdivide as an impulse.
Intermediate wave (1) or (A) is a complete five wave impulse lasting 39 days. Intermediate wave (2) or (B) looks like an expanded flat, which is a very common structure.
So far, within intermediate wave (3) or (C), minor waves 1 and 2 are now complete. Minor wave 3 looks to have begun. Within minor wave 3, only minute wave i may now be complete and minute wave ii may be over here, or it may move a little lower but not beyond the start of minute wave i below 1,240.24.
Minute wave iii should show an increase in upwards momentum and be supported by volume. Thereafter, minute wave iv should be shallow and may be very brief. When minute wave iv is complete, then minute wave v should show a further increase in momentum and may end with a blow off top.
A cyan trend line is added to all charts. Draw it from the high in October 2012 to the high in July 2016. This line has been tested five times. Price is finding resistance at the cyan trend line now. If price can break through resistance here after some consolidation, then that may release energy to the upside for the end of minor wave 3.
HOURLY CHART
Click chart to enlarge.
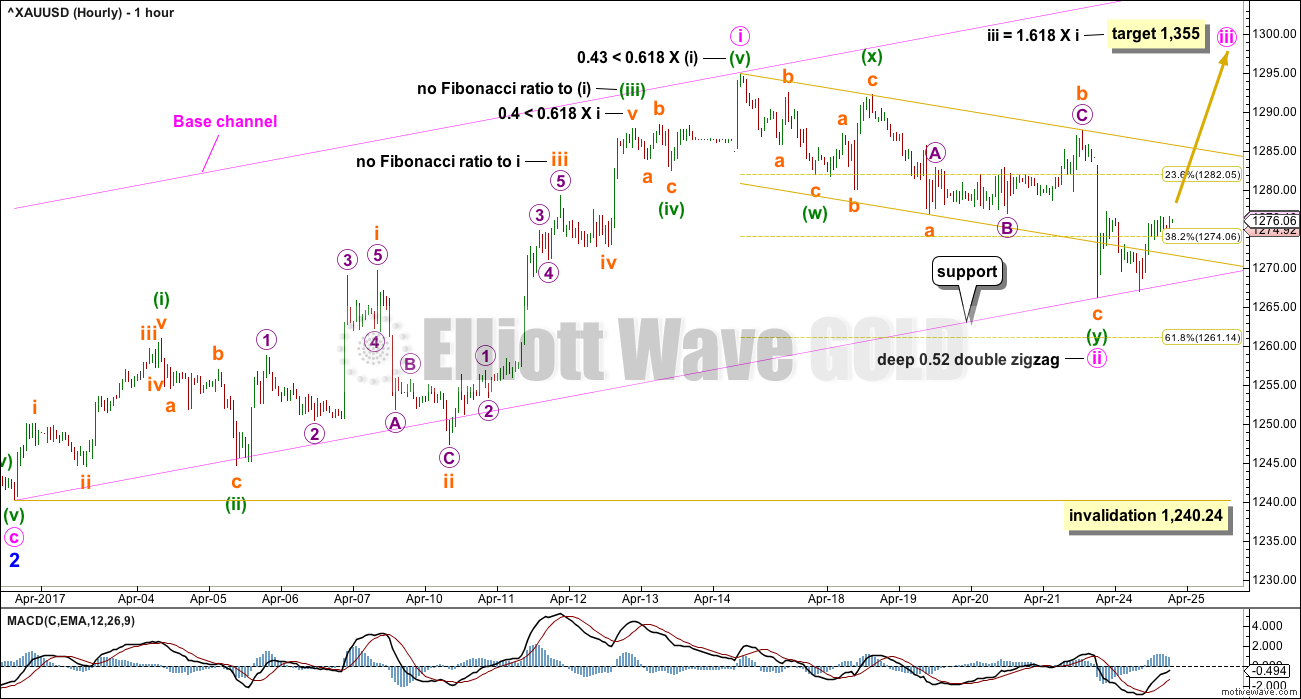
The depth and structure of this pullback looks like a second wave correction and not a fourth wave.
Fibonacci ratios are noted on both hourly wave counts, so that members may compare them, and both wave counts have one ratio between two of the three actionary waves within upwards impulses.
If minute wave i is a complete impulse, then within it there is good alternation between the flat of minuette wave (iv) and the zigzag of minuette wave (ii).
Within minuette wave (iii), there is alternation between the zigzag of subminuette wave ii and the triangle of subminuette wave iv.
Minute wave i does not fit neatly within an Elliott channel, but Gold’s impulses often do not fit within these channels.
Minute wave ii fits as a double zigzag, so it is highly likely that the correction is over here, if this is correct, because minute wave ii would have to subdivide as a very rare triple zigzag for it to continue lower. The rarity of triples means the probability of that happening is very low. This statement assumes my labelling of the double zigzag is correct.
If the target for minute wave iii is wrong, it may not be high enough. Gold’s third waves often extend and it is fairly common for them to exhibit a larger Fibonacci ratio. If price gets up to this target and the structure is incomplete, of if it keeps rising through the target, then a second higher target would be calculated.
ALTERNATE HOURLY CHART
Click chart to enlarge.
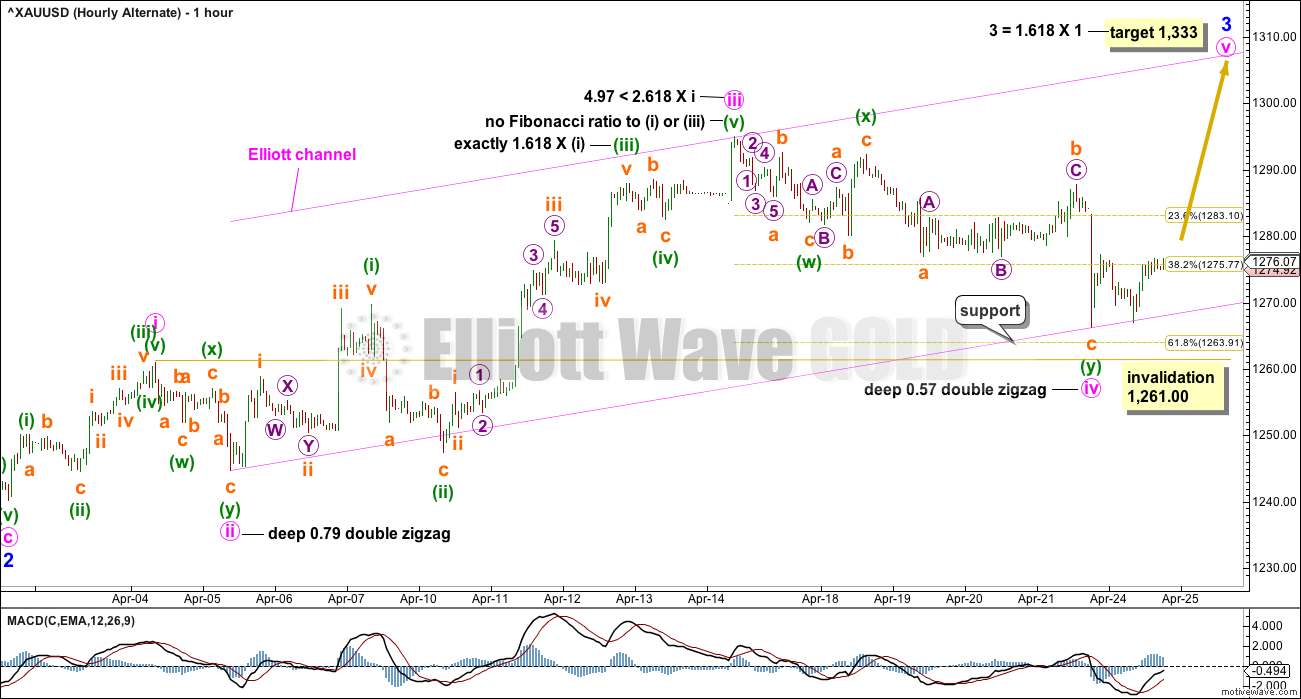
The proportion of minute waves ii and iv for this wave count now does not look right.
The lack of alternation now further reduces the probability of this wave count. It was expected initially that minute wave iv would be shallow and sideways, a combination or flat or triangle, but it has not met the requirements for any of those structures and fits neatly as a double zigzag.
Although there is a perfect Fibonacci ratio within this wave count, that is not enough to increase the probability above the main wave count. The problems of disproportion and lack of alternation are too great.
TECHNICAL ANALYSIS
WEEKLY CHART
Click chart to enlarge. Chart courtesy of StockCharts.com.
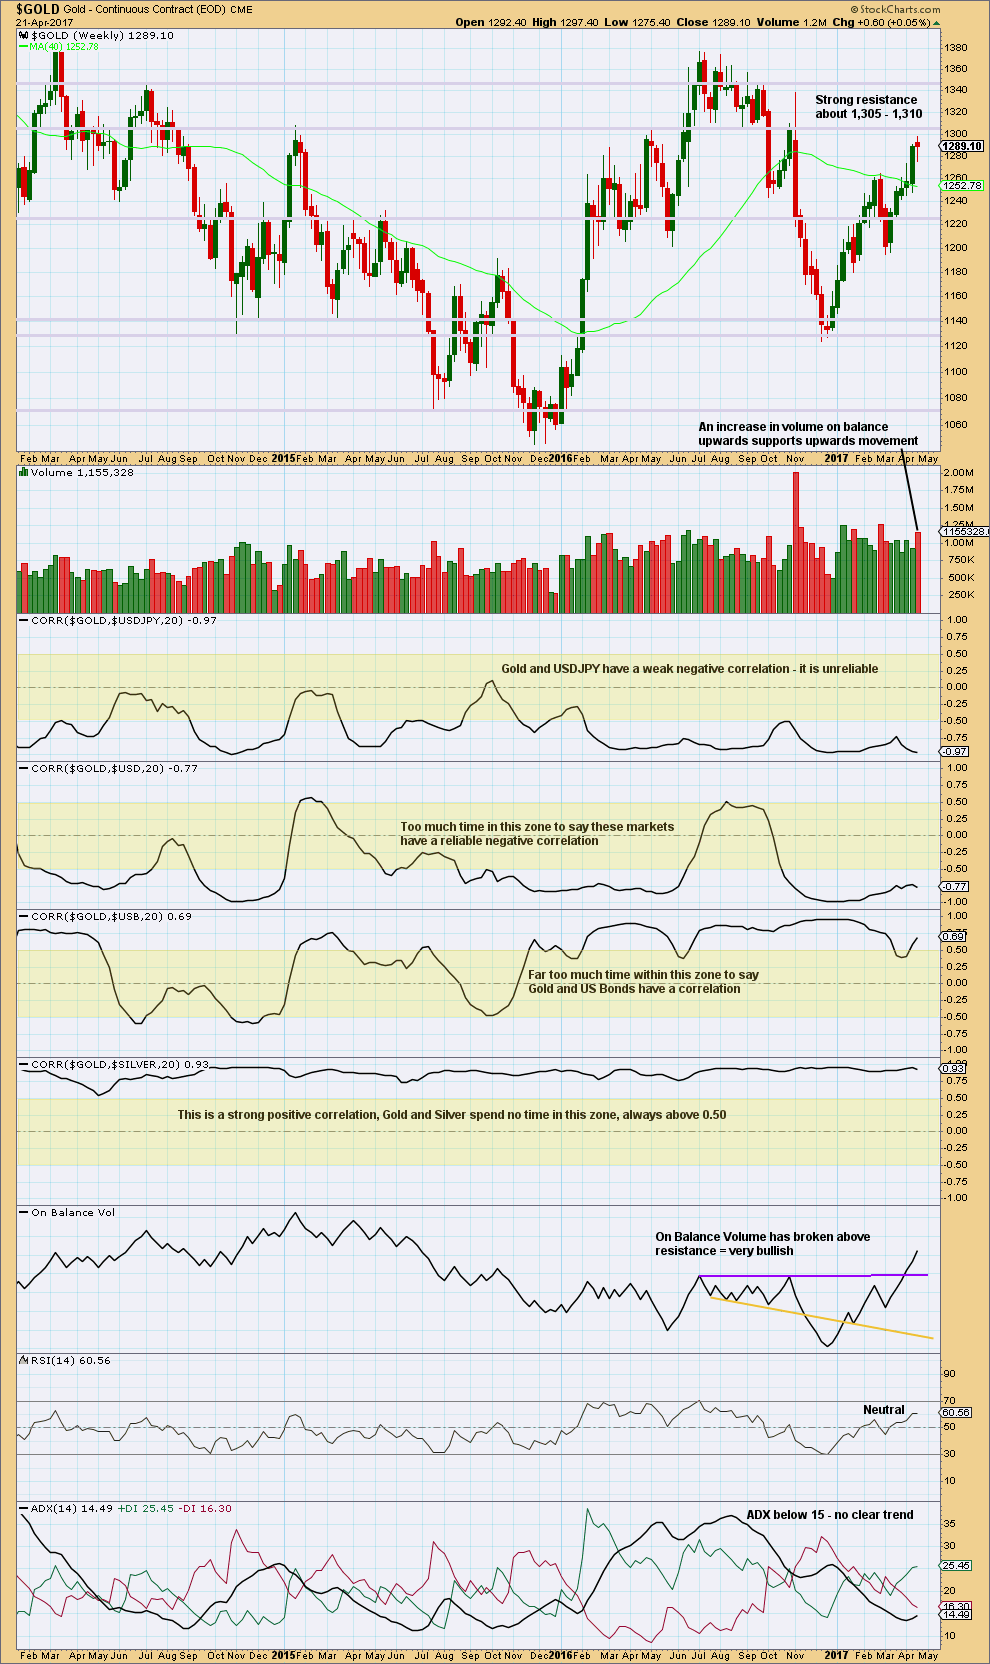
There are a lot of assumptions out there about Gold and its relationships to various other markets. Happily, there is a quick and easy mathematical method to determine if Gold is indeed related to any other market: StockCharts have a “correlation” option in their indicators that shows the correlation coefficient between any selected market and the one charted.
The correlation coefficient ranges from -1 to 1. A correlation coefficient of 1 is a perfect positive correlation whereas a correlation coefficient of -1 is a perfect negative correlation.
A correlation coefficient of 0.5 to 1 is a strong positive correlation. A correlation coefficient of -0.5 to -1 is a strong negative correlation.
Any two markets which have a correlation coefficient that fluctuates about zero or spends time in the 0.5 to -0.5 range (shown by highlighted areas on the chart) may not be said to have a correlation. Markets which sometimes have a positive or negative correlation, but sometimes do not, may not be assumed to continue a relationship when it does arise. The relationship is not reliable.
For illustrative purposes I have included the correlation coefficient between Gold and Silver, which is what strong and reliable correlation should look like.
Gold made a higher high and a higher low this week, although the candlestick has closed red. An increase in volume is bullish. The long lower wick on the candlestick is also bullish although the colour is bearish.
ADX does not yet indicate a trend. If it reaches 15 or above, then it would indicate an upwards trend. RSI indicates there is still plenty of room for price to rise. This chart is bullish.
DAILY CHART
Click chart to enlarge. Chart courtesy of StockCharts.com.
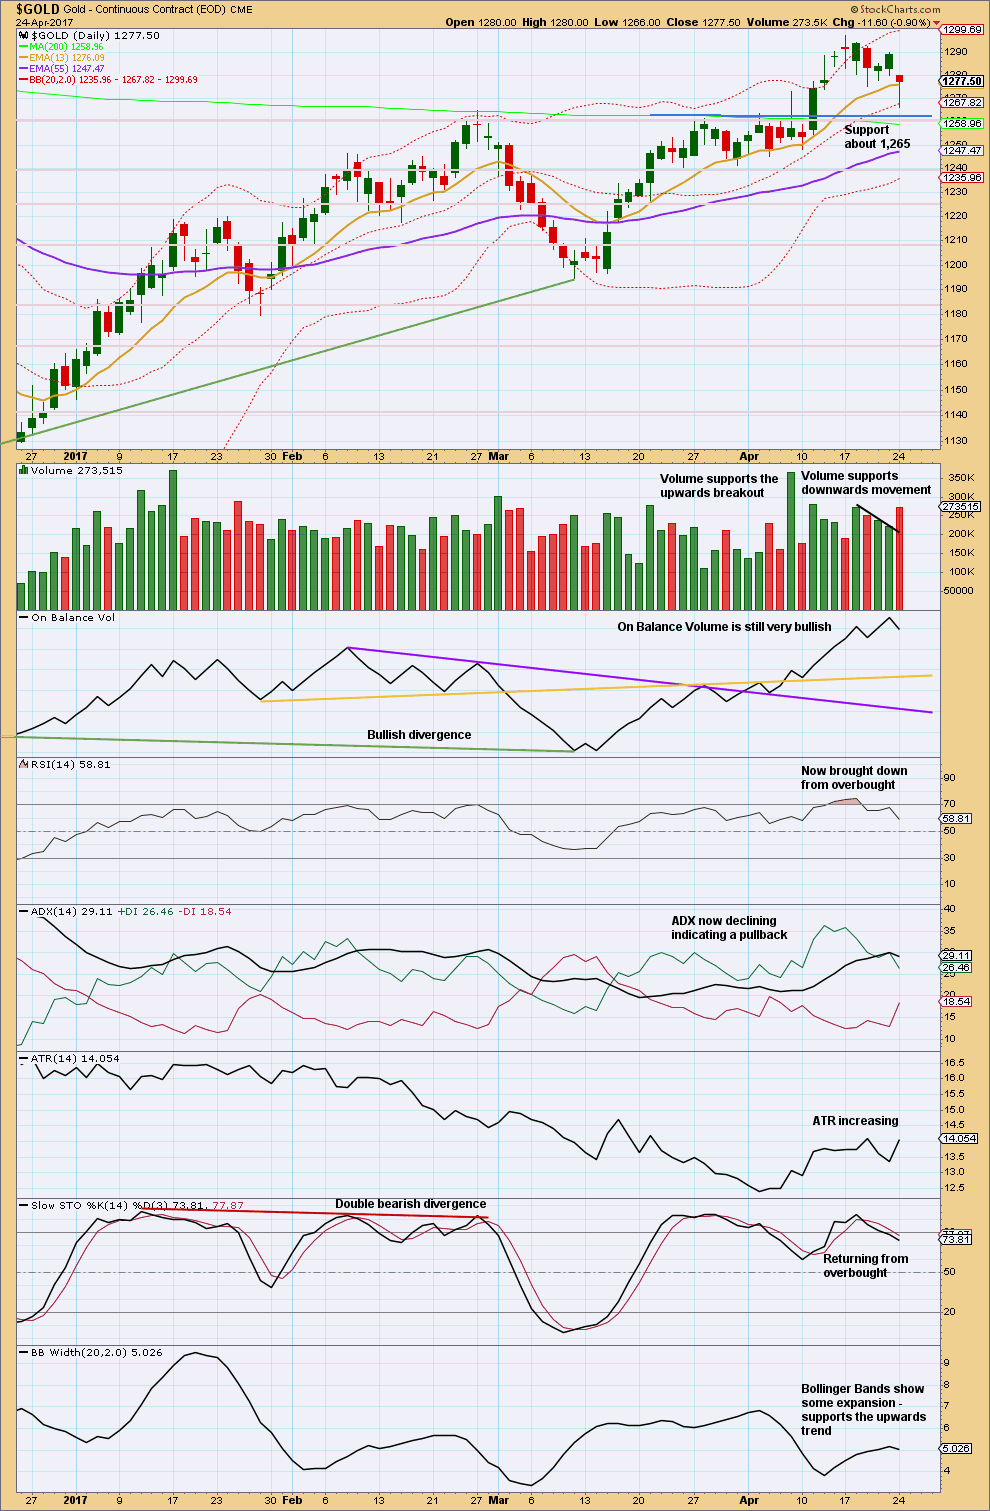
I do not have confidence in the data from StockCharts for the daily candlestick for the 12th of April. As the session ended, I did not see a spike down to 1,278, which is their close, and creates the long upper wick on their candlestick.
The long lower wicks on the last five daily candlesticks are bullish. This last daily candlestick is very bullish with a very long lower wick and the small real body.
After a consolation period followed by an upwards breakout supported by volume on the 11th of April, price has now curved around and down to test support at prior resistance. So far it looks like price is finding support just above 1,265, which was prior resistance for the consolidation. This is typical behaviour following a breakout.
The only concern today is the increase in volume for a downwards day, with the balance of volume downwards. Volume supported the fall in price today. This indicates a little more downwards movement to again test support is fairly likely, but this is not definitive though. Occasionally, during a pullback, a strong day may be seen at the end before the trend continues. There is a good example of this behaviour on the 17th of December, 2015, and again on the 14th of January, 2015, during the third wave example below.
Overall, this chart remains fairly bullish. This looks like a pullback that is either over here or should be within another day.
GDX
DAILY CHART
Click chart to enlarge. Chart courtesy of StockCharts.com.
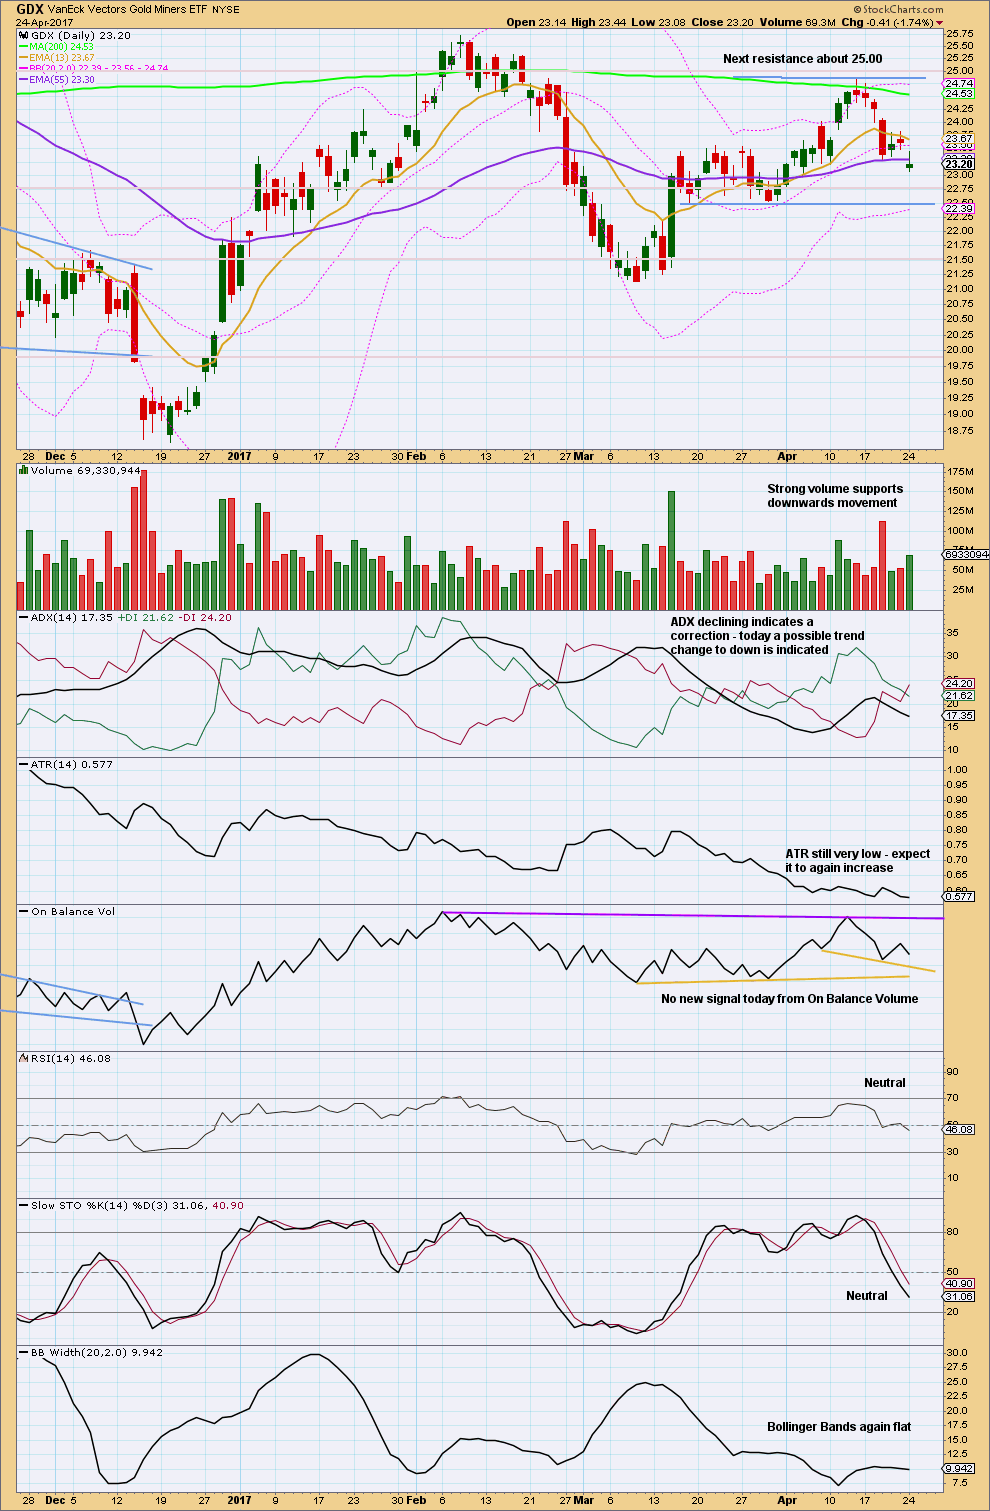
Price is back within the prior consolidation zone. This zone is now widened. There is some distance to go before price may find support about 22.50.
With ATR declining, ADX declining, and Bollinger Bands tightly contracted, this downwards movement looks like a pullback and not a new downwards trend. Support is about 22.75 and next about 22.50.
Some increase in volume today for a downwards day, with the balance of volume downwards, is slightly bearish. This suggests price may yet fall a little further before the pullback is over.
STUDY OF A THIRD WAVE IN $GOLD
Click chart to enlarge.
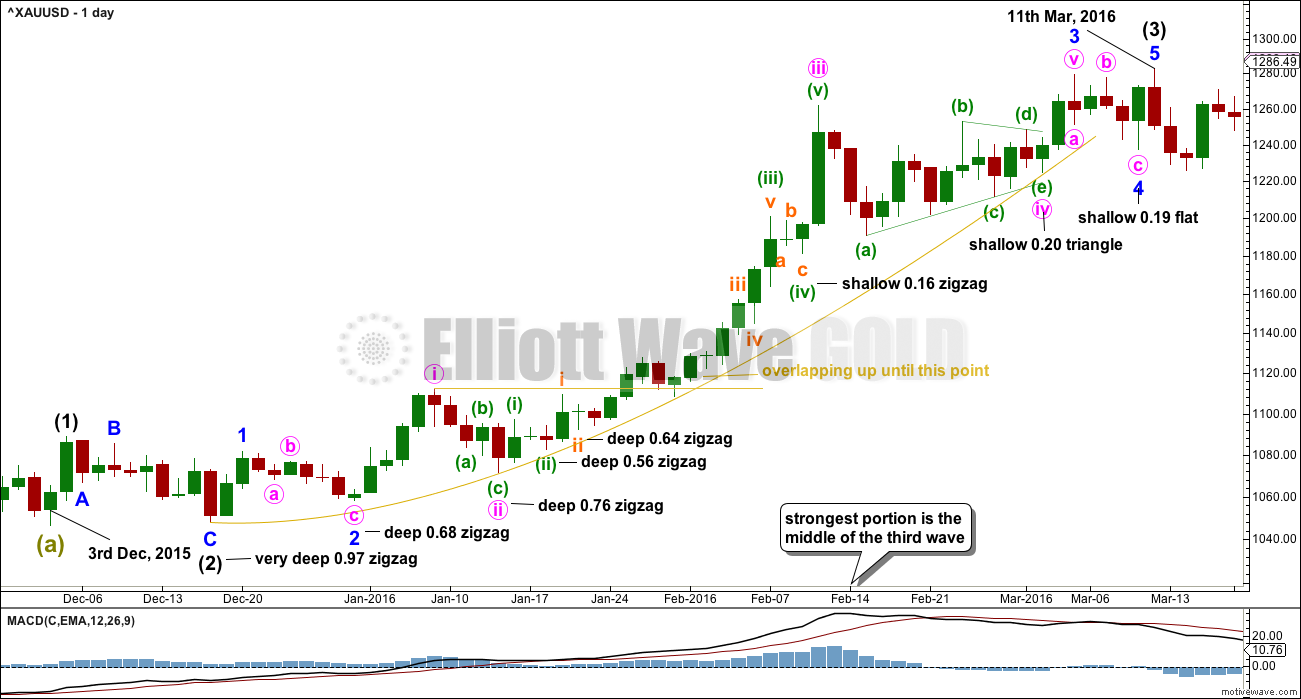
This study of a third wave will be left in daily analysis until the current third wave is either proven to be wrong (invalidated) or it is complete.
This third wave spans 59 trading days.
It was not until the 40th day that the overlapping ended and the third wave took off strongly.
The middle of the third wave is the end of minute wave iii, which ended in a blow off top.
There is excellent alternation between second and fourth wave corrections.
This third wave began with a series of five overlapping first and second waves (if the hourly chart were to be added, it would be seven) before momentum really builds and the overlapping ends.
The fifth wave of minuette wave (v) is the strongest portion.
This third wave curves upwards. This is typical of Gold’s strong impulses. They begin slowly, accelerate towards the middle, and explode at the end. They do not fit neatly into channels. In this instance, the gold coloured curve was used.
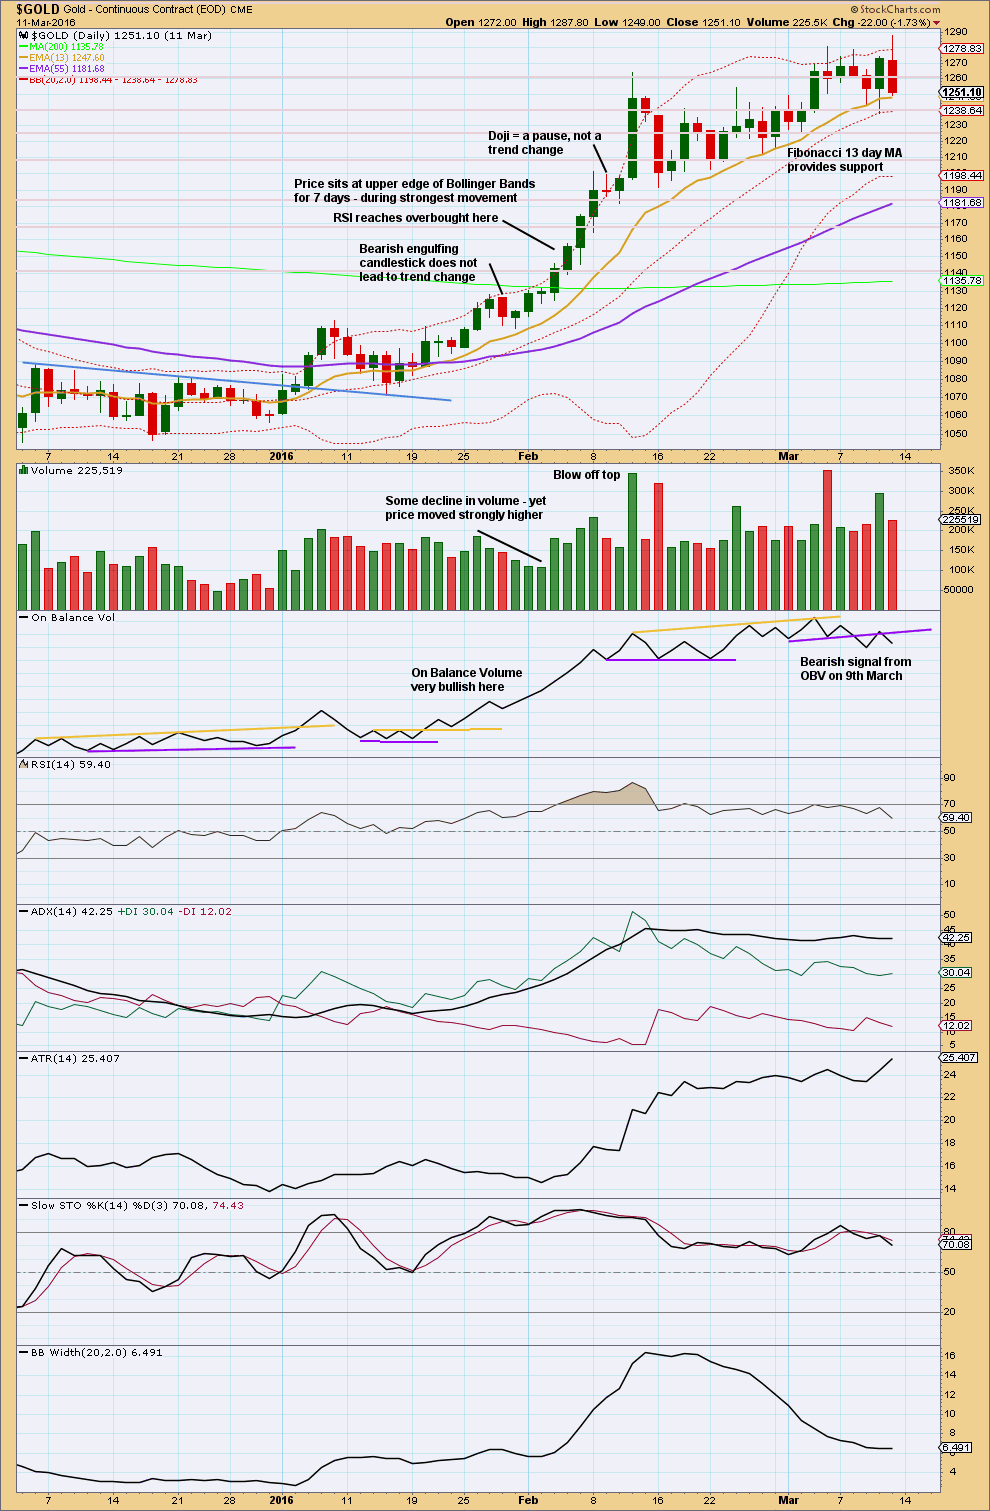
Click chart to enlarge. Chart courtesy of StockCharts.com.
This trend began after a long consolidation period of which the upper edge is bound by the blue trend line. After the breakout above the blue trend line, price curved back down to test support at the line before moving up and away.
RSI reaches overbought while price continues higher for another five days and RSI reaches above 85. The point in time where RSI reaches overbought is prior to the strongest upwards movement.
ADX reached above 35 on the 9th of February, but price continued higher for another two days.
The lesson to be learned here: look for RSI to be extreme and ADX to be extreme at the same time, then look for a blow off top. Only then expect that the middle of a big third wave is most likely over.
The end of this big third wave only came after the blow off top was followed by shallow consolidation, and more highs. At its end RSI exhibited strong divergence with price and On Balance Volume gave a bearish signal.
Third waves require patience at their start and patience at their ends.
TRADING ADVICE
Longs with stops set at 1,270.89 would have been whipsawed out.
Towards the end of the session another long position was entered about 1,274. If any long positions are now positive and the entry point is relatively close, it may be a good technique to now move stops to breakeven. This eliminates the risk of having to ride out a deep second wave correction. If the pullback does continue, then a better entry point may be found.
If using this risk management technique, then be prepared to have long positions closed out for no loss nor gain. Traders would then have to be vigilant and watch the market closely for another entry point lower down.
Profit targets may be set at 1,355 in the first instance.
As always, risk management is the single most important aspect of trading. Take it seriously. My two Golden Rules are:
1. Always use a stop.
2. Invest only 1-5% of equity on any one trade.
This analysis is published @ 09:27 p.m. EST.
O.K. I got an update on the COT situation from the crew at Stansberry Research and apparently the long Silver trade is as lopsided as it has been for quite some time. This is of course a bit of a contrarian view and would argue against an imminent move higher as per our EW favored counts. It will be very instructive to see if extreme bullish sentiment must always necessarily lead to a decline in price. It certainly has not happened with equities…not for a long time!
Make no mistake about it though folk…the banksters are going to move hell and high-water to dislodge those long traders. I happen to know of a cohort that are not going to budge…not one inch, for they are not leveraged. Don’t be too surprised by an initial sharp spike down ahead of a move higher. The COT data suggests that is exactly what we may see.
Thanks Lara for the great charts, I`m a bit confused, is gold a buy here with same stop of $1261 ?
Technically your stop should be just below the new invalidation point at 1,240.24 for new long positions opened here.
So reduce your position size so that my second rule of risk management is met; do not invest more than 1-5% of equity on any one trade.
It is entirely possible that minute ii could move lower, and you don’t want your position to be just taken out only to see price turn and move up. Give the market room to move.
If price breaks below the invalidation point then my analysis is obviously wrong and so you wouldn’t want to be holding a long position at that point.
Why are you here John if you have no confidence in Elliott wave?
If you or any other member is going to come into comments and make snarky digs when I or anyone else here gets it wrong, you will quickly find yourself removed from this membership.
Your comment adds no analysis, asks no question that would add anything to anyone’s analysis and offers nothing of value.
And if you’re looking for an analyst who gets it right all the time you will not find such a person. Which is why I keep on about risk management.
I do not appreciate your tone. I have exceptionally high standards in this comments section, please read the comments policy again.
Ah Yes! Civility on the web is in such scant supply these days. It sure is nice to have a forum where a modicum of politeness and mutual respect obtains-but that’s just me! 🙂 🙂 🙂
Cheers, which brings me to another point. Which I really do want all newer members to read and think about.
A well moderated online space ensures that everyone may feel confident to share their ideas, no matter how unusual the analysis method may be. We need to know that when we share our ideas it will be met in a sprit of kindness, that critique will be focussed on the analysis and not on anyone personally.
I’ve been really tough before on moderation and I’ll continue to be, because it works. It’s created this space where we now have some very knowledgeable and experienced traders (some with decades of trading experience) feeling comfortable enough to share their trades and analysis.
And that adds value to everyone here.
Hourly chart updated:
Minute ii has now lasted 6 days. Minor 2 lasted 6 days. They’re even in duration which is entirely acceptable.
Minute ii is now very close to the 0.618 Fibonacci ratio.
Yes lara it looks like the pullback may end here. Prices hanging around 200 dma.
And the 0.618 Fibonacci ratio is a common point for second waves.
And also, the classic TA chart shows a typical curve down to test support at prior resistance. This looks like typical price behaviour, and if it follows the most common behaviour it should be up and away from here.
Most common and typical does not mean it has to do that though. GDX didn’t do that last week.
Which is why risk management is so important.
Nothing in technical analysis is going to work 100% of the time. Otherwise we’d all be billionaires.
Filling of the open NUGT gap at 9.36 will ignite the rocket ship to the moon!
All aboard! 🙂
My! But I am bullish!
Got much longer the miners today…I’ve been totally skewed to gold futures, but grabbed a nice chunk of NUGT 🙂
A chunk in the trunk? 😀
GDX hanging tough. Short sellers are going to try and drive it below 22; they may even have some temporary success, but it won’t be long (said the monkey whose tail got caught in the lawn mower! 🙂 )
What is the carrying cost on Gold futures these days?
June started off about 4 bucks over spot, so I’d say annual cost is around $15 to $20 total for the year. I guess that follows the low interest rates near one to two percent… also there never seems to be any premium for storage… probably because the Futures Market is all fake money and paper-based.
Those 3x bullish miners might need to start reverse split for this wave 3…:-I
John, what is TA saying now? It seems incredibly short-sighted to pick and choose which method of analysis you *should* have used in hindsight. Lara completely nailed the decline to 1190, and then got us 100 bucks up!!!
Sure, miners have issues – see ABX today for the reasons why they are lagging.
Yes simple TA is saying gold is back testing the breakout of 4/11 at 1259 to 1263 area now.
Lets see what happens next??
Wavers guide is that count do not change till price invalidation makes the count wrong Invalidation is at 1240.24.
Yep. They are probably going to come down for a double tap…so to speak.. 🙂
Minute 2 is a lot bigger than Minor 2 which cannot be right.
Possible that we are now in Minor 2 with Minor 1 being the recent high?
In hindsight, what a great opportunity to short for Minor 2 (and even if it still is Minute 2).
What, may I ask? 🙂
Setting loose a little canary in the coal mine in the form of a NUGT May 19 6.00/7.50 bull put credit spread. Credit of 0.40
The collapse of the short bid should signal the turn higher.
O.K. people. The miners hitting lower BBs as we speak. The juniors (both GDXJ and JNUG) have actually crashed through the bottom ones. I think that is all she wrote. I have not checked the COT situation yet but I think this is the best exit window they are going to get for some time. Let’s get his party started shall we?! 😀
p.s. In typical bankster fashion they may do another big contract dump just for good measure but prices should bounce real hard if they do….
Covering my JDST today as well. Miners could bottom first and lead gold higher again. Miners have been a great tell moving before gold in both directions.
Speaking of correlation or lack thereof, anybody noticing how Gold and the dollar have uncharacteristically become bosom buddies of late?! 🙂
Verne. Yen/usd good correlation lately
I took profits on my USO bearish call spread and will wait for a bounce. I think I will switch to simply buying the 11.50 puts on the next leg down. We have the down-trend pretty much confirmed and this beast tends to be steady- as- she- goes with little or no whiplash action. Great spreads too! 🙂
I think we are in a minor 2 here. Think drop is too large for minute 2.
Looks like a possible expanded flat in Minor 2
Not being an option person Verne – are you bullish or bearish?
Dispositionally, right now I am somewhat neutral.
Positionally, I am quite bullish.
If Gold breaks its 200 dma I will also switch to neutral positionally with reloaded hedges.
Thank you Lara for including zoomed out daily and hourly wave count chart. A frequent post of these charts is well appreciated.
Well said: “To see how this fits into the bigger picture,”
Great analysis.
Well all yer bearish blokes, I am cashing in my JDST 20 strike hedging calls for a nice haul. I will reload ONLY if big G breaks its 200 day SMA and so far as I am concerned….Not
Gonna Do It!! As poppy Bush would opine! 🙂
Miners lagging, yields rising, and USD/JPY were the tells gold was in trouble. USD/JPY really moving up today is risk on stocks and down gold.
Price action in miners today is unhealthy. Need to reevaluate counts 🙁
Poor earnings and forecast from Barrick Gold appears to be leading miners down
GDXJ continues to show weakness. Critical zone is approaching. 32.66 really needs to hold.
https://www.tradingview.com/x/O1sfuaus/
Dreamer- your sharing charts (and thoughts) is very much appreciated – many thanks
Ditto 🙂
Yes, most definitely. Thank you Dreamer 🙂
Thanks Olga, Ari, & Lara. Appreciate the props 👍
GDX moved a little lower than expected, but it still found support near the top of the symmetrical triangle. It looks like another small low may be needed to complete the pattern before GDX continues upward.
https://www.tradingview.com/x/O1sfuaus/