
An upwards day was expected as likely for Wednesday’s session for Gold. Price moved slightly lower, however, before bouncing upwards at the end of the session.
Summary: A new alternate has a reasonable probability. It is possible this pullback may move lower for another couple of days before it is done. Thereafter, the upwards trend should resume and should show a strong increase in momentum.
New updates to this analysis are in bold.
Grand SuperCycle analysis is here.
Last monthly and weekly charts are here.
MAIN ELLIOTT WAVE COUNT
DAILY CHART – DETAIL
Click chart to enlarge.
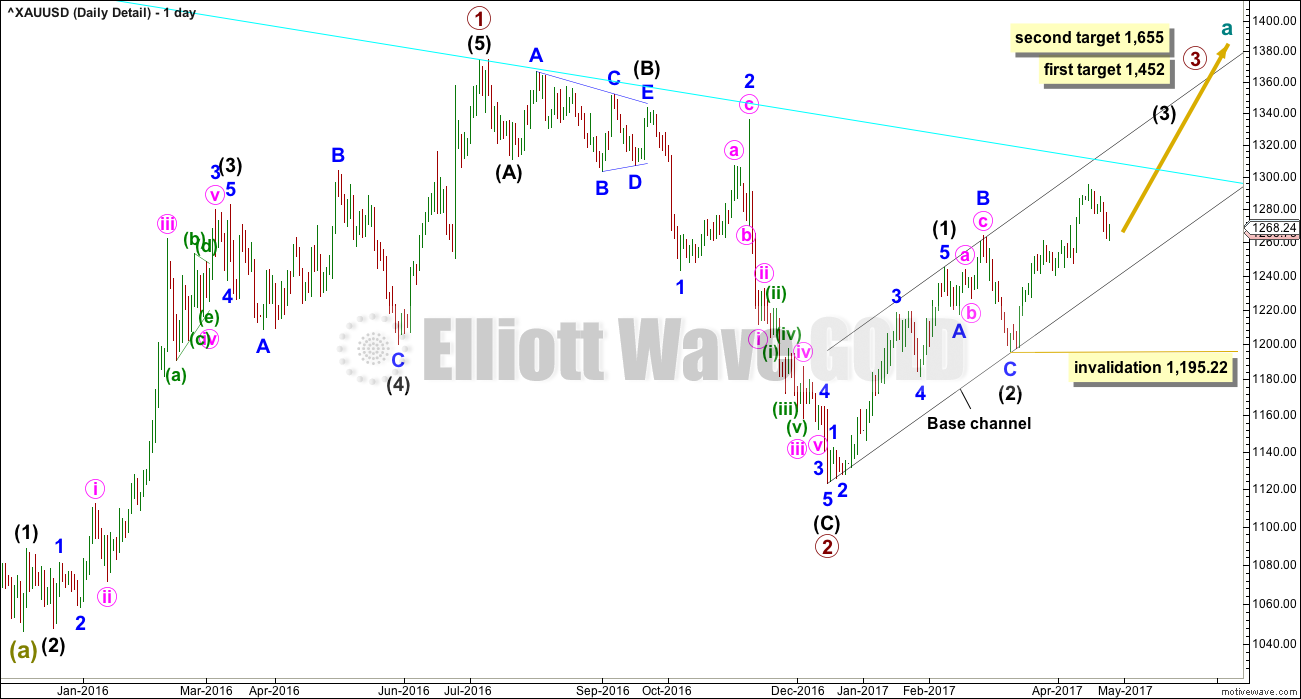
This chart steps back to see all movement since the important low on the 3rd of December, 2015.
To see how this fits into the bigger picture, please see the last historic analysis linked to at the start of this analysis.
The first upwards movement labelled primary wave 1 fits well as a five wave impulse. Primary wave 2 fits as a zigzag. It would be difficult to see the downwards wave of primary wave 2 as an impulse because that would require ignoring what looks very much like a triangle at its start (labelled intermediate wave (B) ). To see this as an impulse that movement would need to be a second wave correction, but second waves do not subdivide as triangles.
Primary wave 3 should have begun. Within it intermediate waves (1) and (2) should be complete. Intermediate wave (2) is a very common expanded flat correction.
The middle of this big third wave now looks unlikely to have passed, so it is still ahead. This has a better look on this bigger picture view.
Minute wave ii may not move beyond the start of minute wave i below 1,240.24.
DAILY CHART
Click chart to enlarge.
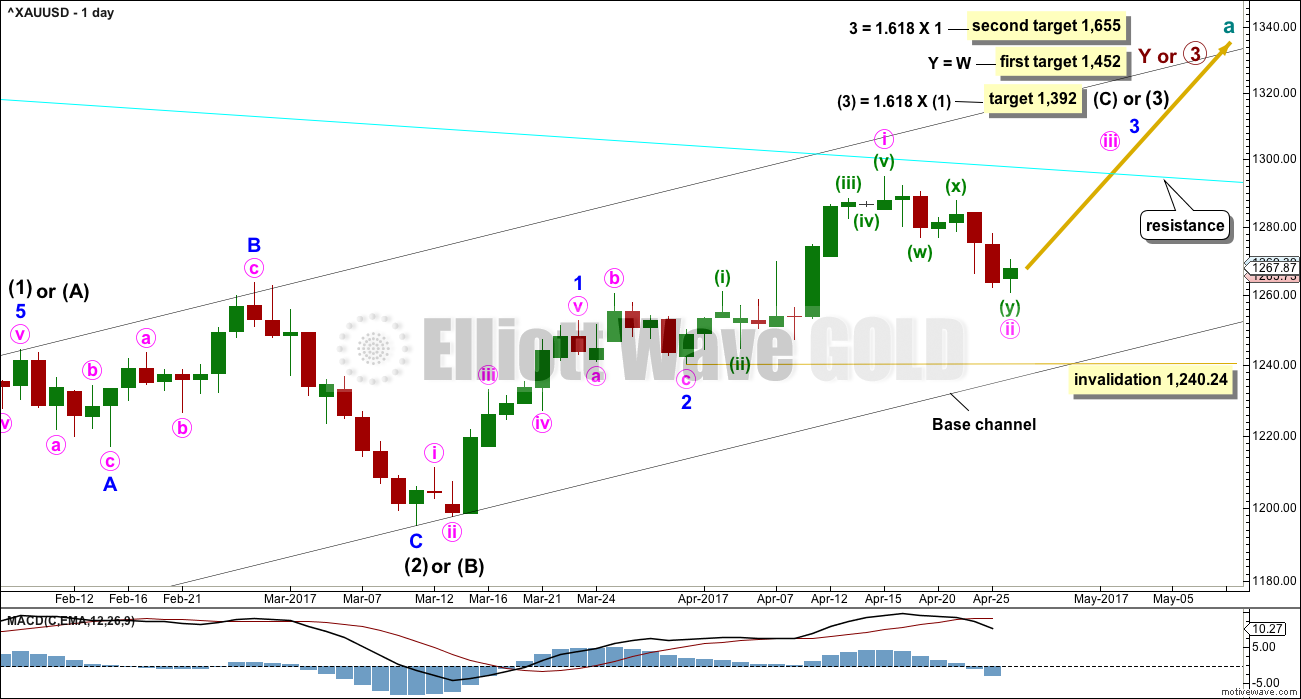
This daily chart will suffice for both weekly charts, which can be seen in the last published historic analysis.
Upwards movement at primary degree is either a third wave (first weekly chart) to unfold as an impulse, or a Y wave (second weekly chart) to unfold as a zigzag. If upwards movement is a zigzag for primary wave Y, then it would be labelled intermediate waves (A) – (B) and now (C) to unfold. It is most likely a third wave because cycle wave a is most likely to subdivide as an impulse.
Intermediate wave (1) or (A) is a complete five wave impulse lasting 39 days. Intermediate wave (2) or (B) looks like an expanded flat, which is a very common structure.
So far, within intermediate wave (3) or (C), minor waves 1 and 2 are now complete. Minor wave 3 looks to have begun. Within minor wave 3, only minute wave i may now be complete and minute wave ii may be over here, or it may move a little lower but not beyond the start of minute wave i below 1,240.24.
Minute wave iii should show an increase in upwards momentum and be supported by volume. Thereafter, minute wave iv should be shallow and may be very brief. When minute wave iv is complete, then minute wave v should show a further increase in momentum and may end with a blow off top.
A cyan trend line is added to all charts. Draw it from the high in October 2012 to the high in July 2016. This line has been tested five times. Price is finding resistance at the cyan trend line now. If price can break through resistance here after some consolidation, then that may release energy to the upside for the end of minor wave 3.
HOURLY CHART
Click chart to enlarge.
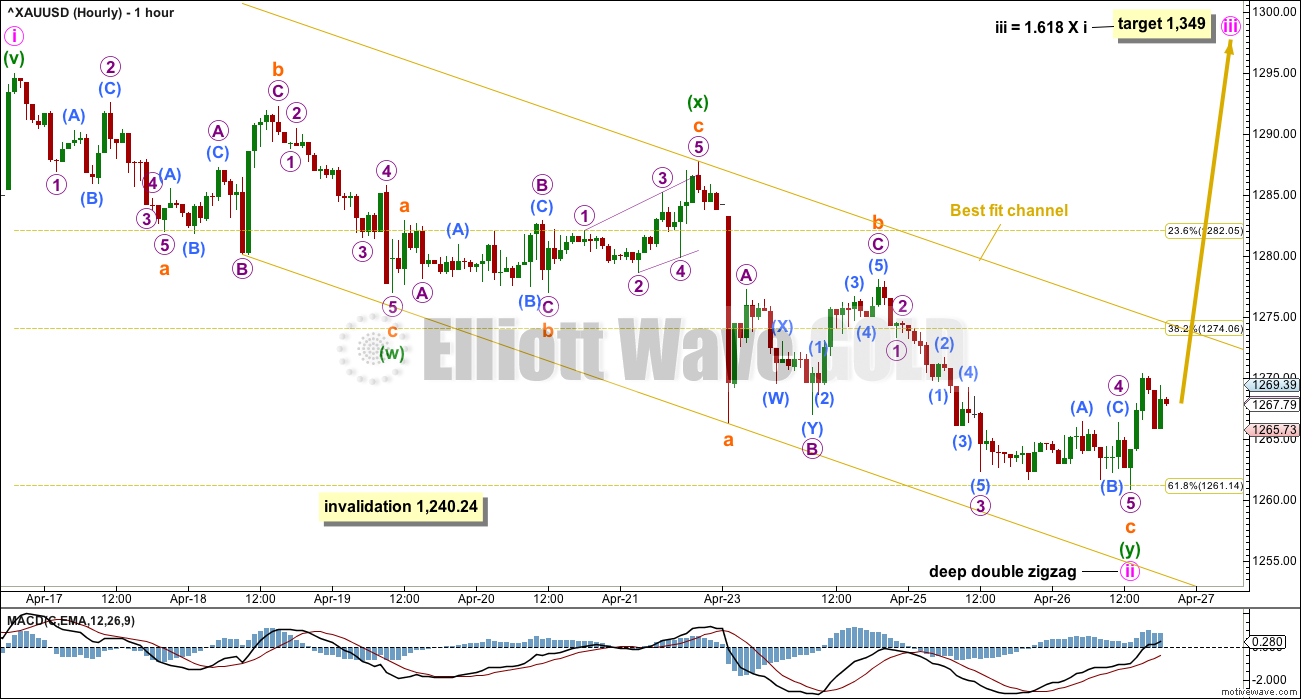
The depth and structure of this pullback looks like a second wave correction.
Minute wave ii still fits as a double zigzag. It will not fit as a single zigzag because there is too much overlapping. Within the second zigzag labelled minuette wave (y), the structure of subminuette wave c may now have its final fifth wave complete. However, the bottom line is that there cannot be any confidence a low is in place while price remains within the channel.
If minute wave iii has begun, then a target is now calculated for it to end. Confidence in this target may only be had with a breach of the channel.
ALTERNATE DAILY CHART
Click chart to enlarge.
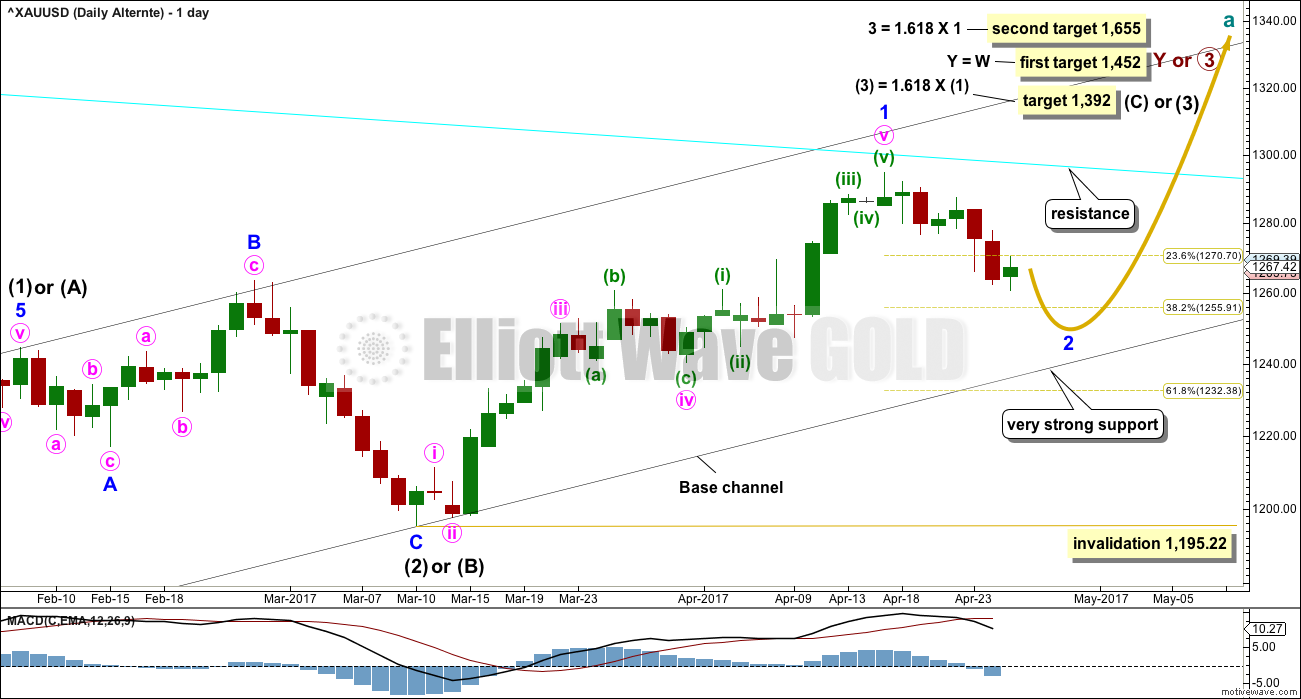
The duration and depth of this correction suggests the pullback may be at minor degree instead of minute degree.
It is possible that minor wave 1 is over at the recent high and now minor wave 2 may be unfolding lower. If it gets down to the lower edge of the base channel, it should find very strong support there. If this wave count is correct, then price should not break below this trend line.
Minor wave 2 may not move beyond the start of minor wave 1 below 1,195.22. However, if the base channel provides support, price should not get close to this invalidation point.
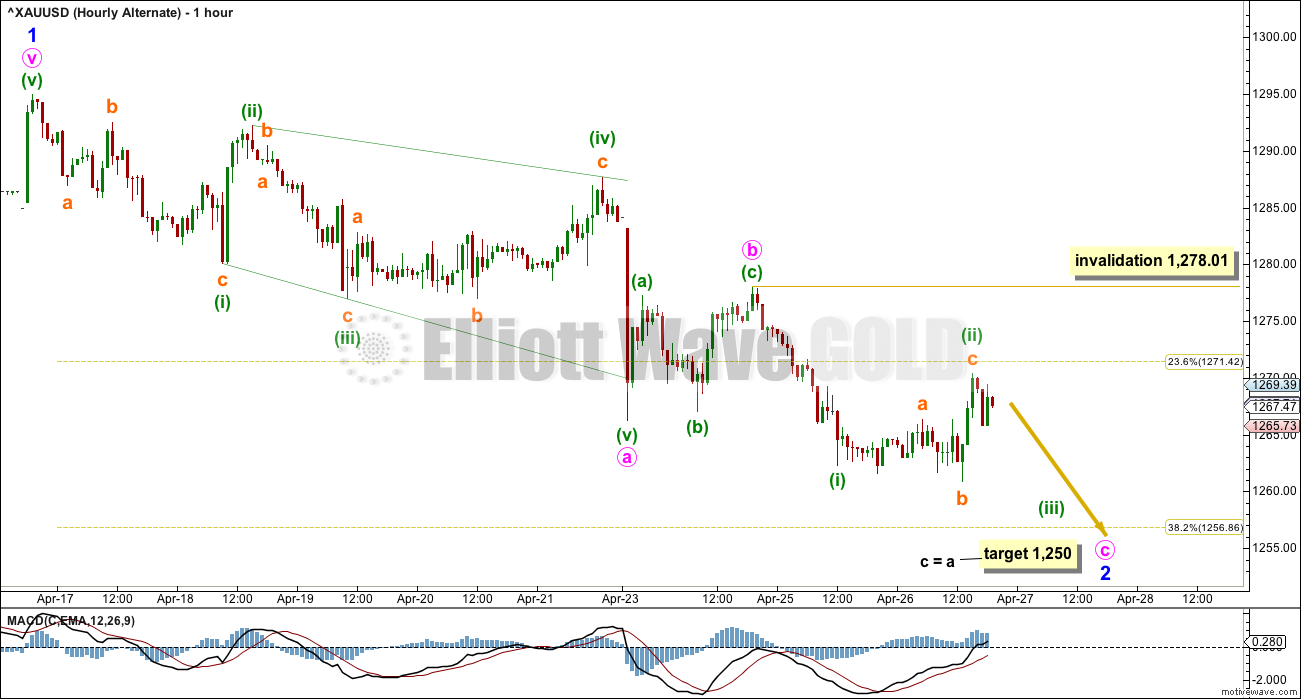
ALTERNATE HOURLY CHART
Click chart to enlarge.
So far it is possible that a zigzag downwards is continuing for minor wave 2.
Subwaves 1, 3 and 5 within leading diagonals most commonly subdivide as zigzags, and within diagonals the fourth wave should overlap first wave price territory. Within minor wave 2, minute wave a will fit as a leading expanding diagonal.
The target expects the most common Fibonacci ratio between minute waves a and c. This target would see minor wave 2 fall short of the lower edge of the base channel.
This alternate wave count would allow for another one to two days of slowing downwards movement to complete a pullback, before the larger upwards trend resumes.
TECHNICAL ANALYSIS
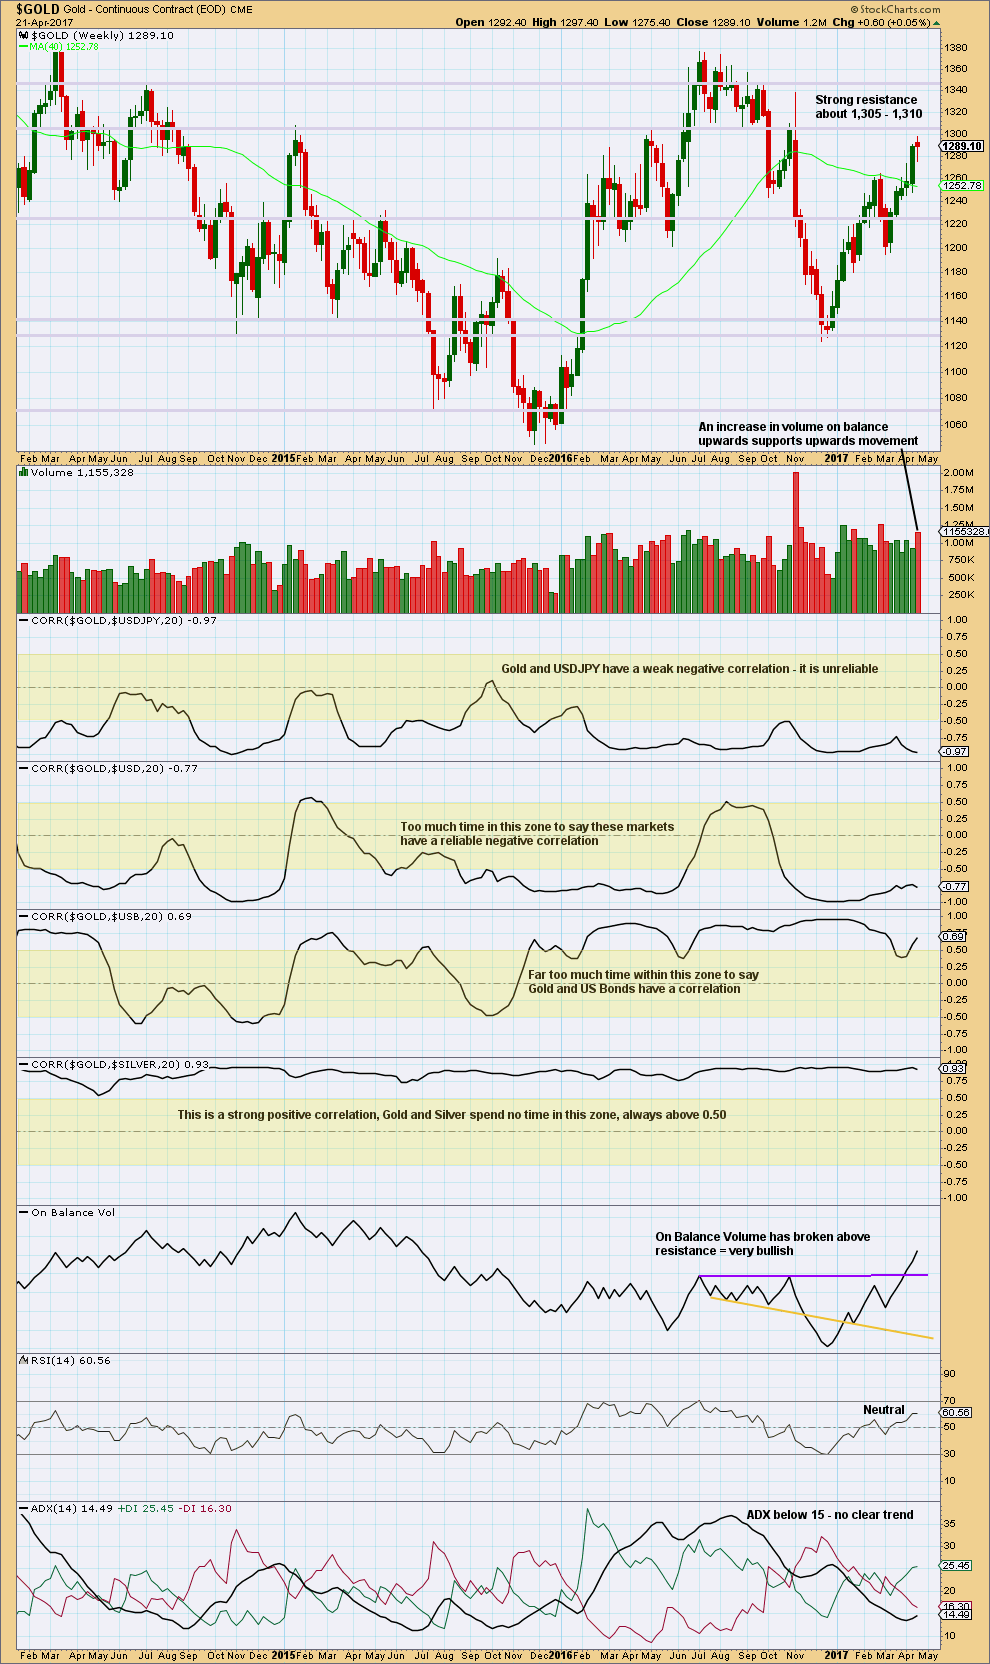
WEEKLY CHART
Click chart to enlarge. Chart courtesy of StockCharts.com.
There are a lot of assumptions out there about Gold and its relationships to various other markets. Happily, there is a quick and easy mathematical method to determine if Gold is indeed related to any other market: StockCharts have a “correlation” option in their indicators that shows the correlation coefficient between any selected market and the one charted.
The correlation coefficient ranges from -1 to 1. A correlation coefficient of 1 is a perfect positive correlation whereas a correlation coefficient of -1 is a perfect negative correlation.
A correlation coefficient of 0.5 to 1 is a strong positive correlation. A correlation coefficient of -0.5 to -1 is a strong negative correlation.
Any two markets which have a correlation coefficient that fluctuates about zero or spends time in the 0.5 to -0.5 range (shown by highlighted areas on the chart) may not be said to have a correlation. Markets which sometimes have a positive or negative correlation, but sometimes do not, may not be assumed to continue a relationship when it does arise. The relationship is not reliable.
For illustrative purposes I have included the correlation coefficient between Gold and Silver, which is what strong and reliable correlation should look like.
Gold made a higher high and a higher low this week, although the candlestick has closed red. An increase in volume is bullish. The long lower wick on the candlestick is also bullish although the colour is bearish.
ADX does not yet indicate a trend. If it reaches 15 or above, then it would indicate an upwards trend. RSI indicates there is still plenty of room for price to rise. This chart is bullish.
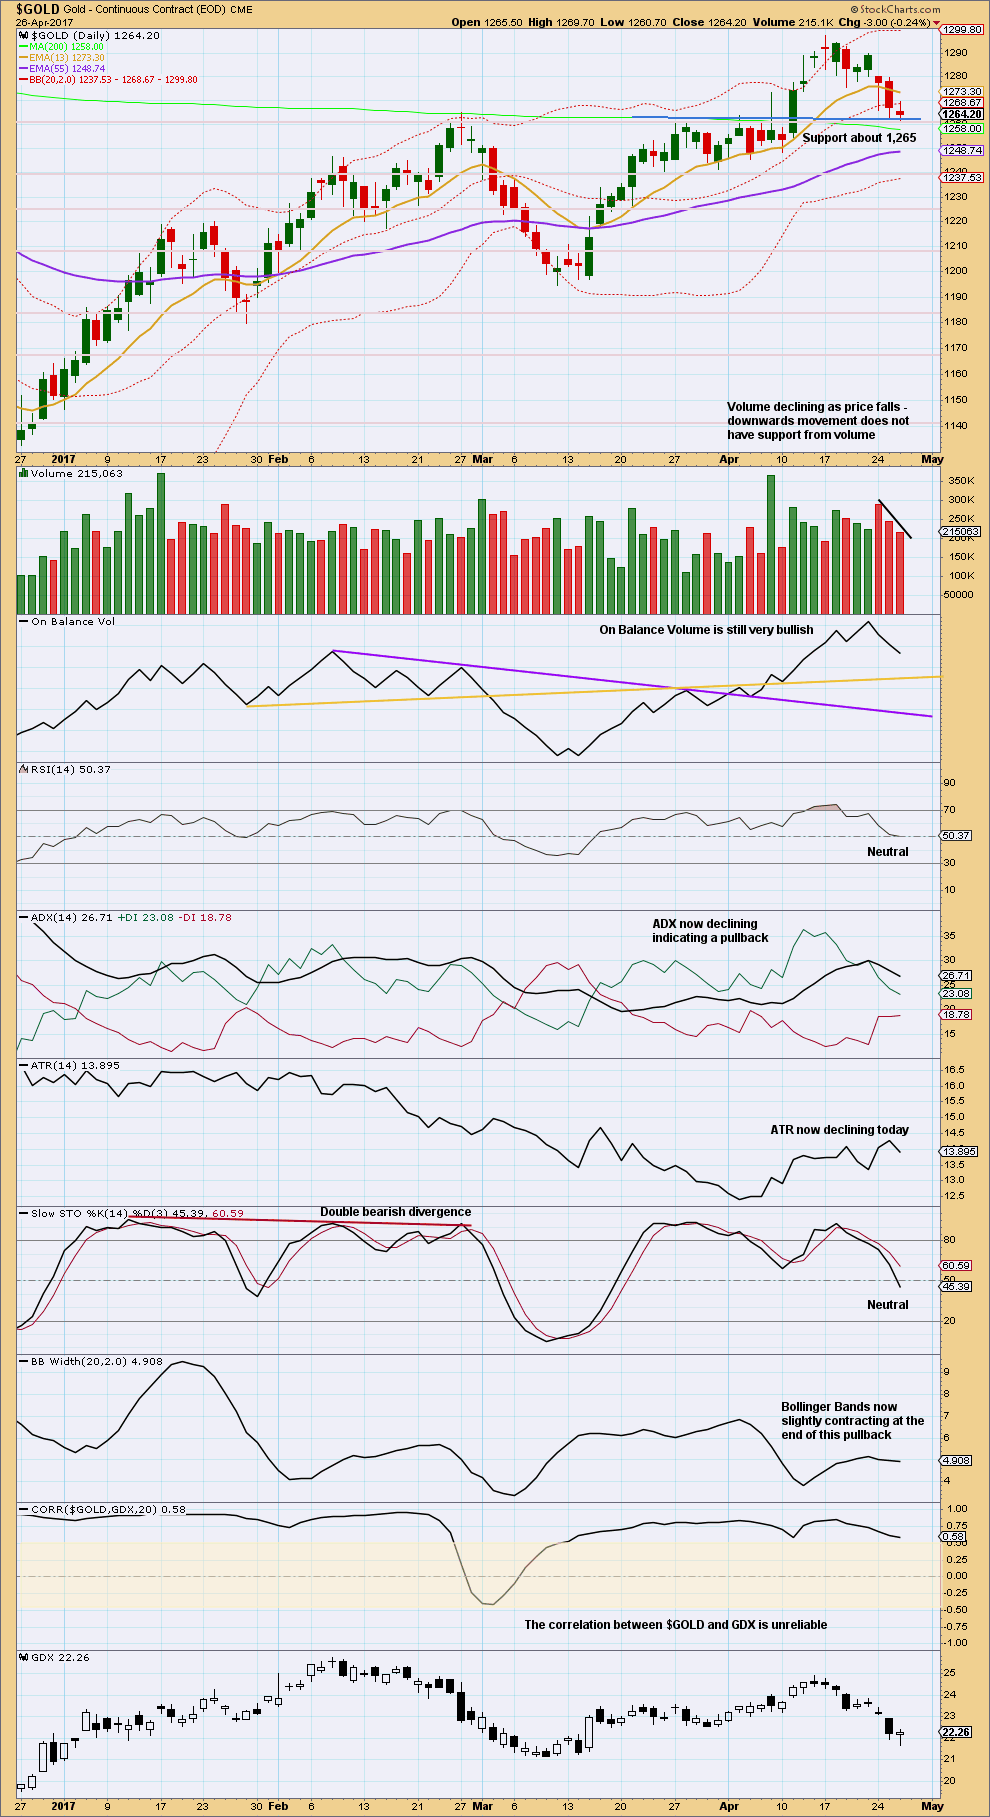
DAILY CHART
Click chart to enlarge. Chart courtesy of StockCharts.com.
Another downwards day has a further decline in volume. So far this downwards movement still looks like a typical pullback within a larger upwards trend.
The breakout from a prior consolidation on the 11th of April had support from volume, now price is curving around and down to test support at prior resistance. At this stage, that support is still holding about 1,265.
Overall, this chart remains mostly bullish. Declining volume and Bollinger Bands very slightly contracting as price moves lower indicate this movement is still most likely a pullback and not yet a new downwards trend.
TRADING ADVICE:
The alternate has a good probability, so price may yet move against long positions for another couple of days. Members with underwater positions would be best advised to take a small loss now and wait for a better reentry if price moves lower. If price reaches down to about 1,250, that would be a good reentry.
If members choose to hold onto underwater positions, do not move stops lower. That would increase risk to beyond 5% of equity and this is most definitely not advised.
If price does not move lower and breaks above 1,278, then another long position may be entered.
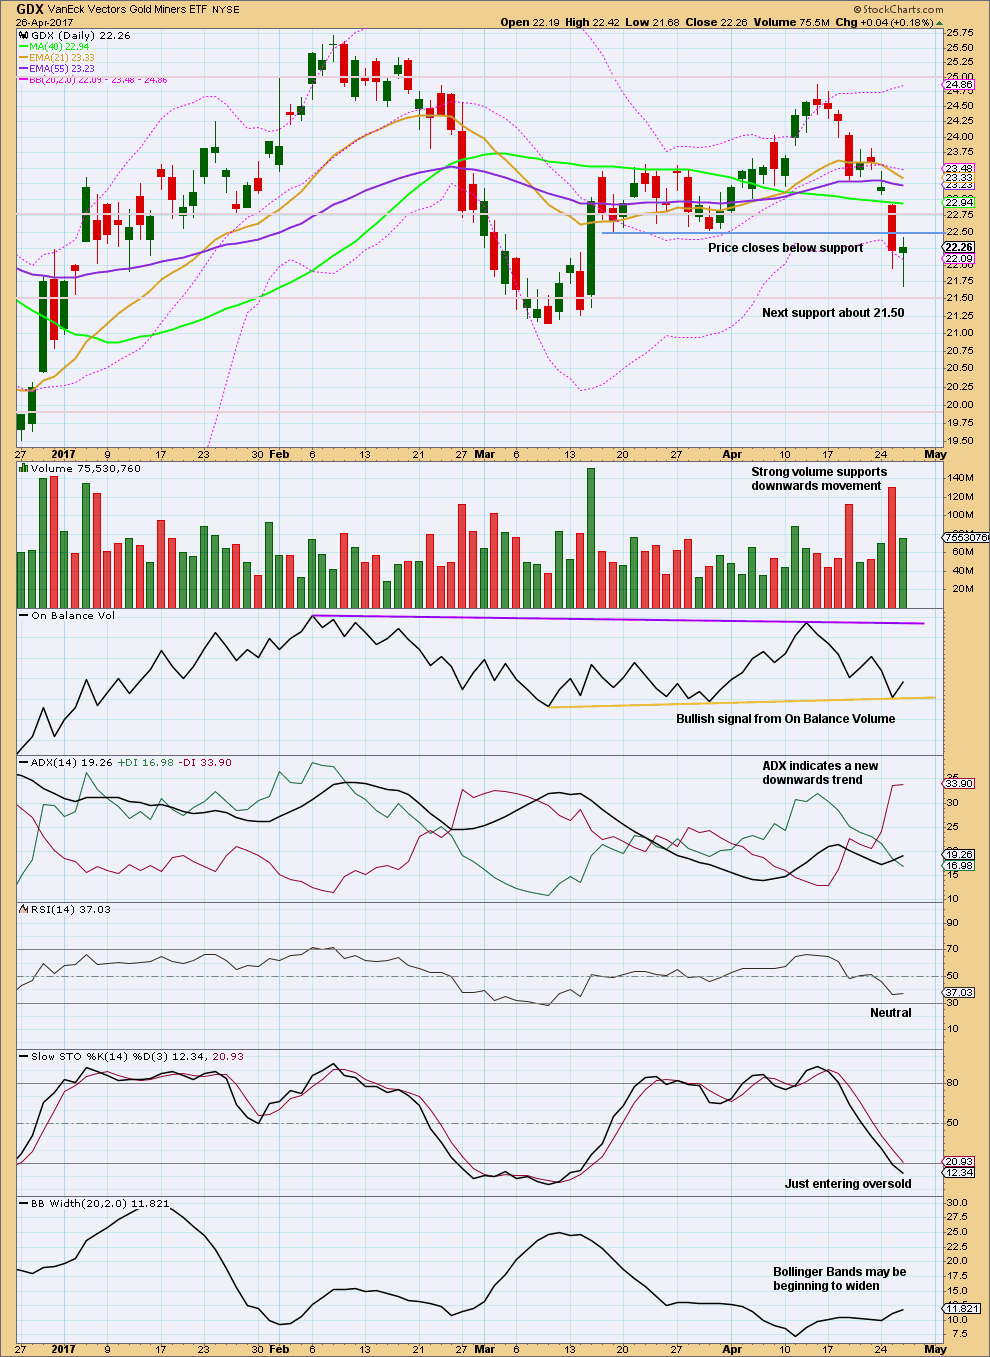
GDX
DAILY CHART
Click chart to enlarge. Chart courtesy of StockCharts.com.
The long lower wick on this last daily candlestick is bullish. The decline in volume for a day with the balance of volume upwards is bearish.
This downwards trend is not yet extreme, price is not yet at support, and Stochastics is only just entering oversold. There is room for a little more downwards movement. Look for support about 21.50.
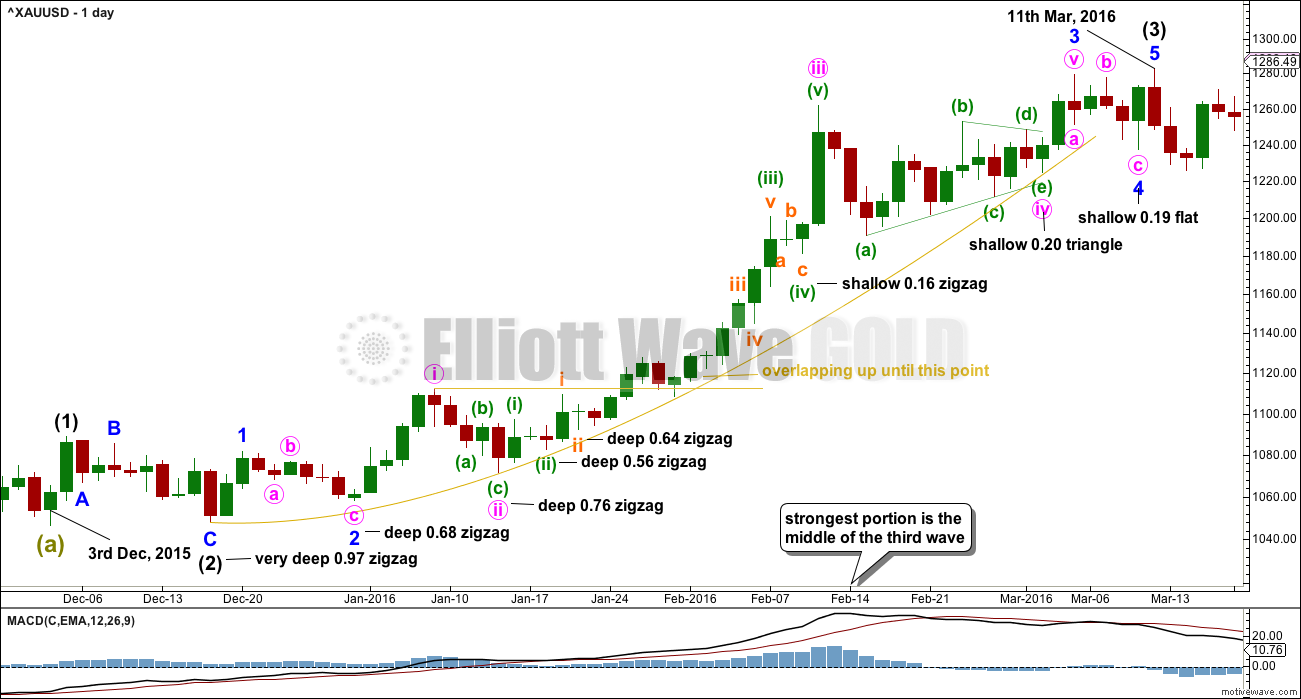
STUDY OF A THIRD WAVE IN $GOLD
Click chart to enlarge.
This study of a third wave will be left in daily analysis until the current third wave is either proven to be wrong (invalidated) or it is complete.
This third wave spans 59 trading days.
It was not until the 40th day that the overlapping ended and the third wave took off strongly.
The middle of the third wave is the end of minute wave iii, which ended in a blow off top.
There is excellent alternation between second and fourth wave corrections.
This third wave began with a series of five overlapping first and second waves (if the hourly chart were to be added, it would be seven) before momentum really builds and the overlapping ends.
The fifth wave of minuette wave (v) is the strongest portion.
This third wave curves upwards. This is typical of Gold’s strong impulses. They begin slowly, accelerate towards the middle, and explode at the end. They do not fit neatly into channels. In this instance, the gold coloured curve was used.
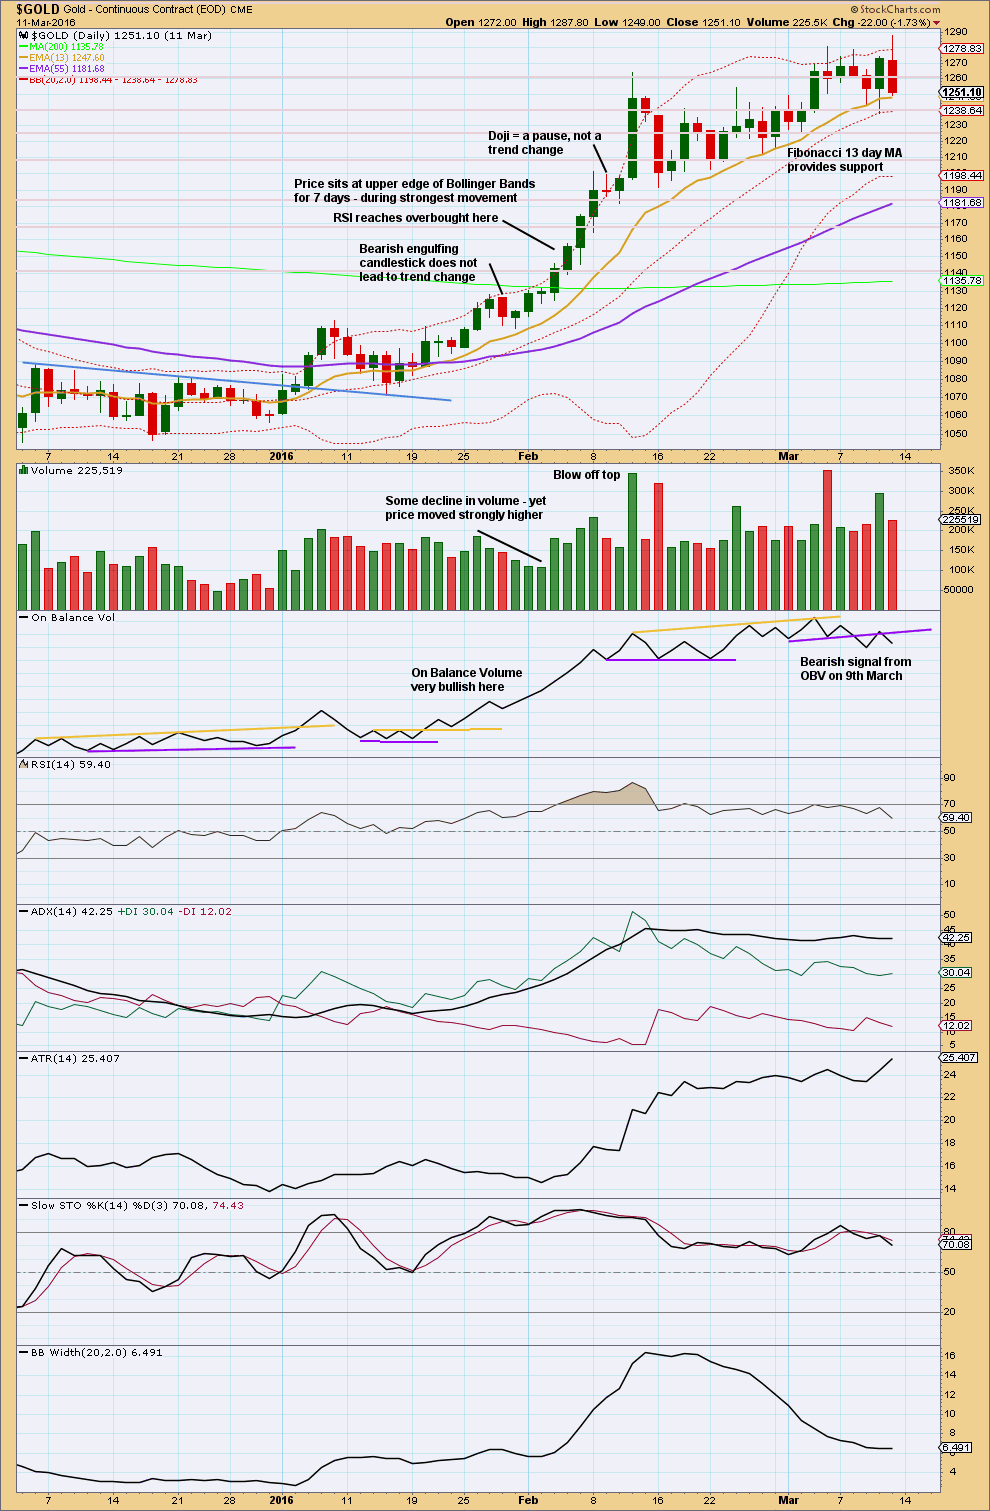
Click chart to enlarge. Chart courtesy of StockCharts.com.
This trend began after a long consolidation period of which the upper edge is bound by the blue trend line. After the breakout above the blue trend line, price curved back down to test support at the line before moving up and away.
RSI reaches overbought while price continues higher for another five days and RSI reaches above 85. The point in time where RSI reaches overbought is prior to the strongest upwards movement.
ADX reached above 35 on the 9th of February, but price continued higher for another two days.
The lesson to be learned here: look for RSI to be extreme and ADX to be extreme at the same time, then look for a blow off top. Only then expect that the middle of a big third wave is most likely over.
The end of this big third wave only came after the blow off top was followed by shallow consolidation, and more highs. At its end RSI exhibited strong divergence with price and On Balance Volume gave a bearish signal.
Third waves require patience at their start and patience at their ends.
This analysis is published @ 08:34 p.m. EST.
Sorry for the crude chart i’m not sure how to annotate so i printed out and hand wrote the EW markings. Sorry! Hope it works I’ve never attached a file here. Question for Lara and others – how likely is this? I’m a little worried with the long term picture and looked at the monthly chart and seems to me we might be in for a big move down into the abyss if this is correct. I guess we would be completing a running triangle (?) for wave 4 and about to start wave 5 down on the monthly chart where it is (currently) failing at the long term downtrend line. But I’m not sure how likely this is.
Eli, great to have your charting input. If we break above your trend line, then the bull case wins for now. Below the point you label “D”, and the bear likely wins sooner than later.
I think the triangle idea is out of proportion, but Lara will likely have better thoughts.
Lara does expect lower lows eventually, even with her current bull count.
Give Tradingview.com a try. You can save a limited # of charts for free if you don’t mind ads. Pretty easy to use their Elliott labels.
Thanks Dreamer , and yes but would love to get an indication before below 1150 if this has chance. Needs Lara’s Fibonacci and EW super analaysis to debunk this
Hi Eli. You’ve expressed my sentiments exactly. Sorry I can’t add a qualified opinion on the count itself– I’m not there yet. It definitely appears feasible. I’ve asked Lara for an update on her bear alternatives, even though she’s against that count. But alas, current bull count needs to breach its current uptrend line for any confidence to be had as she says. Glad you posted. Personally, I simply can’t find the time to go back over her prior publishings day by day to see if this count was ever considered. Wouldn’t know what dates to look at. I’m sorry I can not be of more help. GL
(I’m gonna re-check COT for commercils)
Given the failure of the gold stocks, and historic silver cot structure, I think it makes sense to look at these kinds of possibilities. The triangle does look a little off, but would love Lara’s take. Thanks!
I took a small loss yesterday, which was about 1/3 of the prior profit from the wave up. So still winning.
Now neutral, waiting on the fence to see if this pullback is going to move lower.
I’ve set a limit order to open another long if price moves down to 1,250. My order is set just above that point.
Holding a few NUGT puts as hedges and had itchy fingers to add a bit more downside protection today but despite Silver’s continued weakness, the yellow cousin hanging in there….
Main hourly chart updated:
The three down which didn’t make a new low could be a second wave correction. This fits well.
But the bottom line is that while price remains within that best fit channel allow for more downwards movement. That channel must be breached for us to have any confidence now in this wave count.
Alternate chart updated hourly:
The biggest thing to note today is the wave down to todays low won’t fit as a five, but fits neatly as a three. This means minuette (ii) may be continuing. I don’t like the proportion now between that and minute b.
Maybe I’ve got my analysis of minor 2 zigzag so far just wrong. Will try alternates.
All righty then! Let’s give the banksters one more opportunity to get out with their hinys intact with a possible final move down to minor two… hyuk! hyuk!
Verne, if I read Lara’s comment correctly she is saying that this count is less likely due to the fit, but there might be another count that works for a Minor 2 scenario.
I think you are right about that Corey. I have to say I am a bit surprised the spike down have not been more spastic. I was actually expecting to see price for Gold go down to around 1250.00 If they don’t manage to get it down that far covering the short contracts is going to be a teensy bit prickly!
Of course the worse thing they could do is dump another 25K contracts and have the heavy hitters immediately buy the dip! Ouch!
Lara, what would an hourly chart look like labeling the high of April 12-16th(?) as the end of Primary 2? [in Bear-weekly alternate scenario] Just interested in seeing all the alternatives if that’s possible.
?? that just makes zero sense?
looking at the daily detail chart, that high can’t be the end of a second wave correction.
And the wave down I have labelled primary 2 fits best as a correction because of the triangle being in the B wave position.
I did have a bearish alternate which saw an impulse over at the low of the 15th of December 2016, and the following wave up a second wave correction. That could still fit and would be very bearish. But I’m not going to publish such a bearish wave count until the base channel is breached, because classic TA is so bullish at this stage.
My requesting an update to view the bearish alternate in a more detail from the EW expert made all the sense in the world to me. Sorry you think it ridiculous. Was just thinking maybe in working the details on the bear count the wave count would shed more probability/inprobability on a bullish count– at this stage.
This is the last update we have on the “alternate’ view.
http://elliottwavegold.com/wp-content/uploads/2017/04/gold11apr17weeklyaltFG93.png
I don’t understand Verne. Are you saying you think gold is going down to 120.84?
Nick
Verne wrote about GLD etf not gold.
I hope this downside stops sooner than later so gold can shine on up in the 3rd leg – need a wind change
🤞🤞🤞
The ultimate bullish scenario would be to see GLD fill three closing gaps at 122.31, 121.48, and 120.84 with ONE daily candle. If that happens, it means the banksters are busted….(they would have covered the last three contract dumps in capitulation to big G)
😆😆 Verne Carty you the most happening member of EWG
That title belongs to Dreamer, hands down dude! 🙂
Maybe for charts, but you win for great information and comedy! A rare combination for sure. Keep up the good work. Team effort. 🤣 😆 😂
Lots of other great posters too 👍
Indeed! Sprcial kudos to Alan for great ideas…😛
Third knock on the door of GLD”s 200 dsma. Result the same: You…Shall…Not…Pass!!! 😀
Yet another naked short contract dump. If we close green today, I’m calling Cap’n Quint to sing for the short sellers…you know the tune…! 😀
Oil futures down 2% right in line with Lara’s count for a shallow second wave and start of a third wave down. Nice work! Short USO, OIH, UCO….steady as she goes maties! 😉
Will be updating Oil chart in last US Oil analysis for members with shorts on there.
Quite a move off the lows today. Keeping an eye on futures…
Will be interesting. After going short…I switched to long intraday…
It will be interesting to see who wins this tug-of-war. The so-called commercials (cohort of bullion banks, central banks, FED included and BIS) are holding a record 125K short Silver contracts. Their problem is their contract dumps are being bought but they have not given up and covered. There is a cohort of long Silver traders that have not been selling which in part accounts for the record long positions so this could get very interesting….
Lara the move from yestrdays low to the high is looking 3wave or 5wave move?
Its looking like a 3 right? And if that is correct it is increasing the probability on alternate right?
I’m not sure which wave you’re referring to? Today has moved price sideways? Will post updated charts which will shed some light…
Need a silver count lara😊
TA suggest silver is ready for a bounce.
STO is very much overbought. Atleast a bounce towards 18dma is expectrd. Silver is hanging on 100dma. With gold on 200dma. Very interesting juncture. Confusing counts..wowww
Will definitely be doing that today.
I wrote a long submission to the MTA’s Technically Speaking yesterday, that took hours. So Silver is a day late this week because of that.
Tale of the miners…
GDXJ usually leads – up and down
GDXJ has a break down. Is this due to the recent issues and GDX will hold support? -or-
Will GDX follow and breakdown in the coming days?
https://www.tradingview.com/x/X1E7VaRf/
Good to see the new alternate daily count. It seems to align better with the price action in the miners. Next few days will tell.
Yeah, and it has a better proportion now. Up until yesterday the main count looked right, but now minute ii is one day longer in duration than minor 2 so now it doesn’t have the right look anymore.
Lara,
If it breaks 1240.24, this is likely to be a viable option?
Any thoughts? (used the same chart to keep it very simple…)
No, because minor B within that possible expanded flat is 2.01 times the length of minor A. That idea should now be discarded based upon a very low probability.
Which is why the alternate wave count above has a better probability.
Thanks, for the 2.01 observation. U are the best..
Lara,
Please see Minor 1 in April for 11 days and Minor B for 25 days of Intermediate(4) in 2016 as marked at 2.27 times the total time?
Please see Minor 1 in April for 11 days….its Minor A for 11 days
The convention of B being no longer than 2X A refers to wave length, not duration.
B waves are very often particularly time consuming. So absolutely no problem there. In that case you’ve posted B length is 1.28 X A, and so it’s within the common range of up to 1.38