
Recent price behaviour and volume suggest the alternate Elliott wave count from last analysis has a higher probability, so in today’s analysis it is now the main wave count.
Summary: A slight new low may end about 1,257 on Monday. Thereafter, the upwards trend should resume. There is strong support around 1,260 which has so far held. If price does move lower, then look for strong support at the lower edge of the base channel on the daily charts.
New updates to this analysis are in bold.
Grand SuperCycle analysis is here.
Last monthly and weekly charts are here.
MAIN ELLIOTT WAVE COUNT
DAILY CHART – DETAIL
Click chart to enlarge.
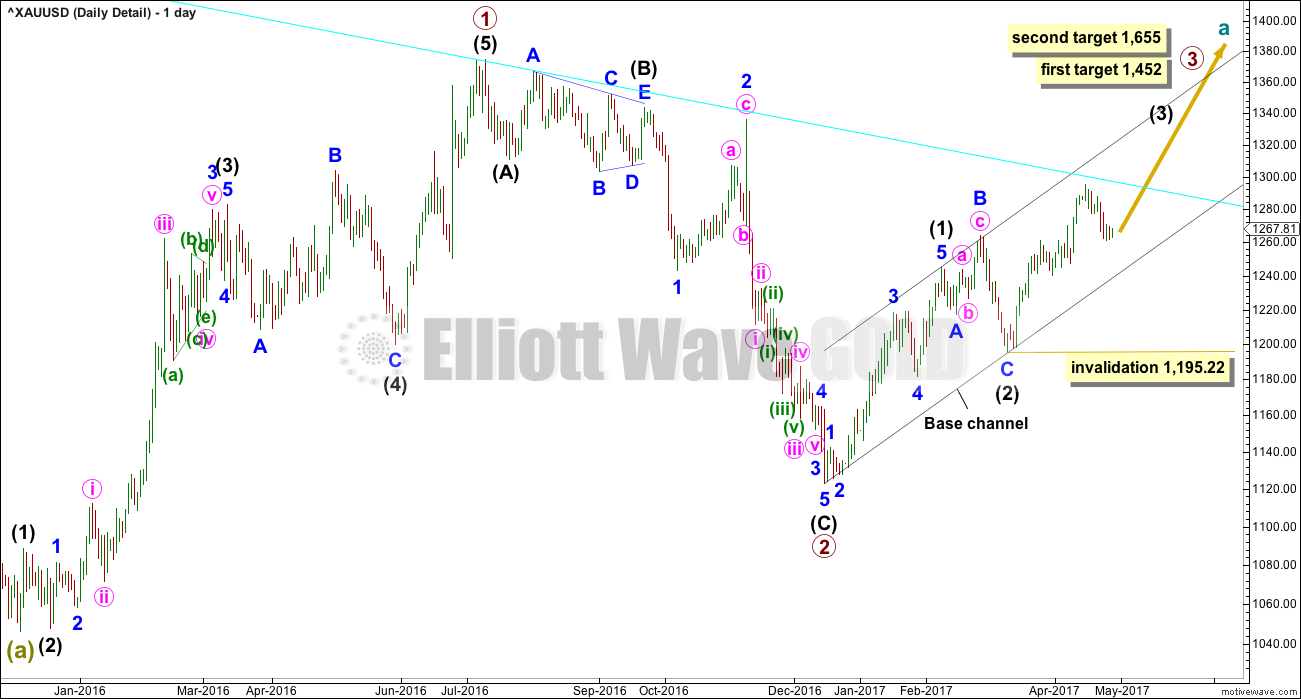
This chart steps back to see all movement since the important low on the 3rd of December, 2015.
To see how this fits into the bigger picture, please see the last historic analysis linked to at the start of this analysis.
The first upwards movement labelled primary wave 1 fits well as a five wave impulse. Primary wave 2 fits as a zigzag. It would be difficult to see the downwards wave of primary wave 2 as an impulse because that would require ignoring what looks very much like a triangle at its start (labelled intermediate wave (B) ). To see this as an impulse that movement would need to be a second wave correction, but second waves do not subdivide as triangles.
Primary wave 3 should have begun. Within it intermediate waves (1) and (2) should be complete. Intermediate wave (2) is a very common expanded flat correction.
The middle of this big third wave now looks unlikely to have passed, so it is still ahead. This has a better look on this bigger picture view.
Minute wave ii may not move beyond the start of minute wave i below 1,240.24.
A cyan trend line is added to all charts. Draw it from the high in October 2012 to the high in July 2016. This line has been tested five times. Price is finding resistance at the cyan trend line now. If price can break through resistance here after some consolidation, then that may release energy to the upside for the end of minor wave 3.
DAILY CHART
Click chart to enlarge.
This daily chart will suffice for both weekly charts, which can be seen in the last published historic analysis.
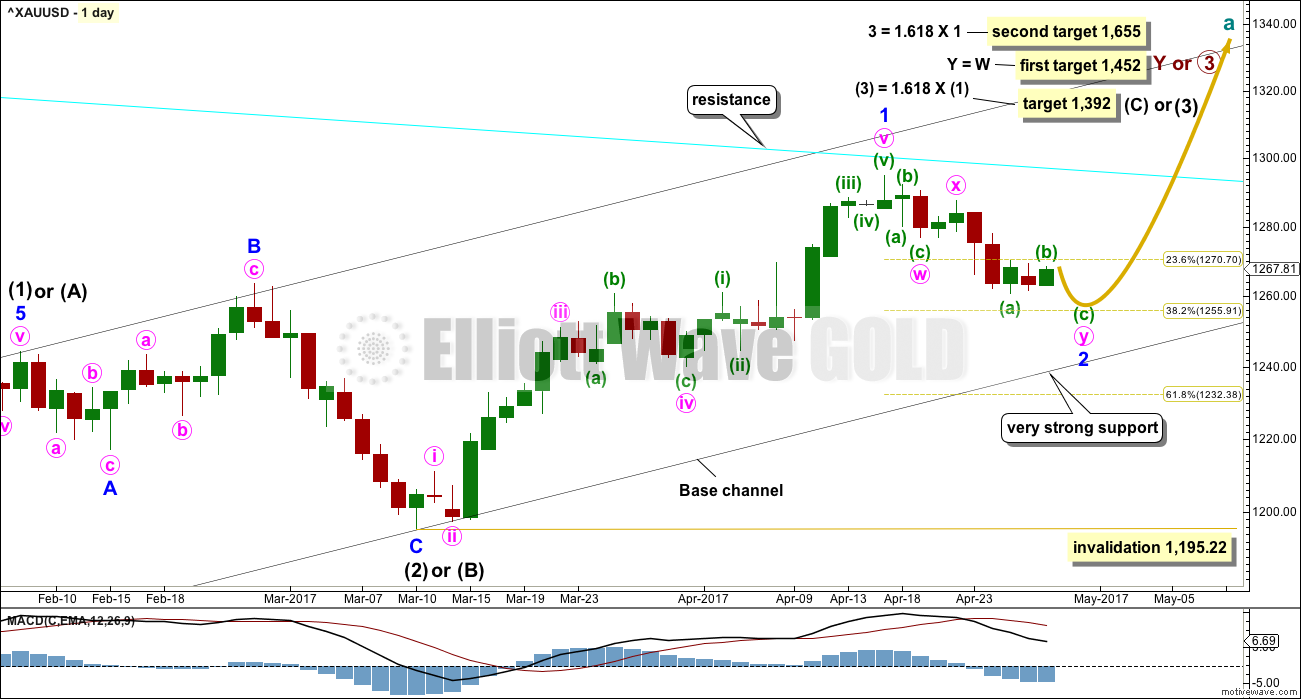
Upwards movement at primary degree is either a third wave (first weekly chart) to unfold as an impulse, or a Y wave (second weekly chart) to unfold as a zigzag. If upwards movement is a zigzag for primary wave Y, then it would be labelled intermediate waves (A) – (B) and now (C) to unfold. It is most likely a third wave because cycle wave a is most likely to subdivide as an impulse.
Intermediate wave (1) or (A) is a complete five wave impulse lasting 39 days. Intermediate wave (2) or (B) looks like an expanded flat, which is a very common structure.
The duration and depth of this correction labelled minor wave 2 suggests the pullback may be at minor degree instead of minute degree.
It is possible that minor wave 1 is over at the recent high and now minor wave 2 may be unfolding lower. If it gets down to the lower edge of the base channel, it should find very strong support there. If this wave count is correct, then price should not break below this trend line.
If the pullback does continue, and if it is deeper than the target on the hourly chart, then price may come down to touch the lower edge of the base channel. If that happens, it would offer us a gift of a very good entry point to join the upwards trend. If that happens, then members would be strongly advised to enter long with a stop just below the lower edge of the channel (give the market a little room to move and allow for overshoots).
Minor wave 2 may not move beyond the start of minor wave 1 below 1,195.22. However, if the base channel provides support, price should not get close to this invalidation point. Only if the base channel is breached by a full daily candlestick below and not touching the lower edge would a bearish wave count be considered.
HOURLY CHART
Click chart to enlarge.
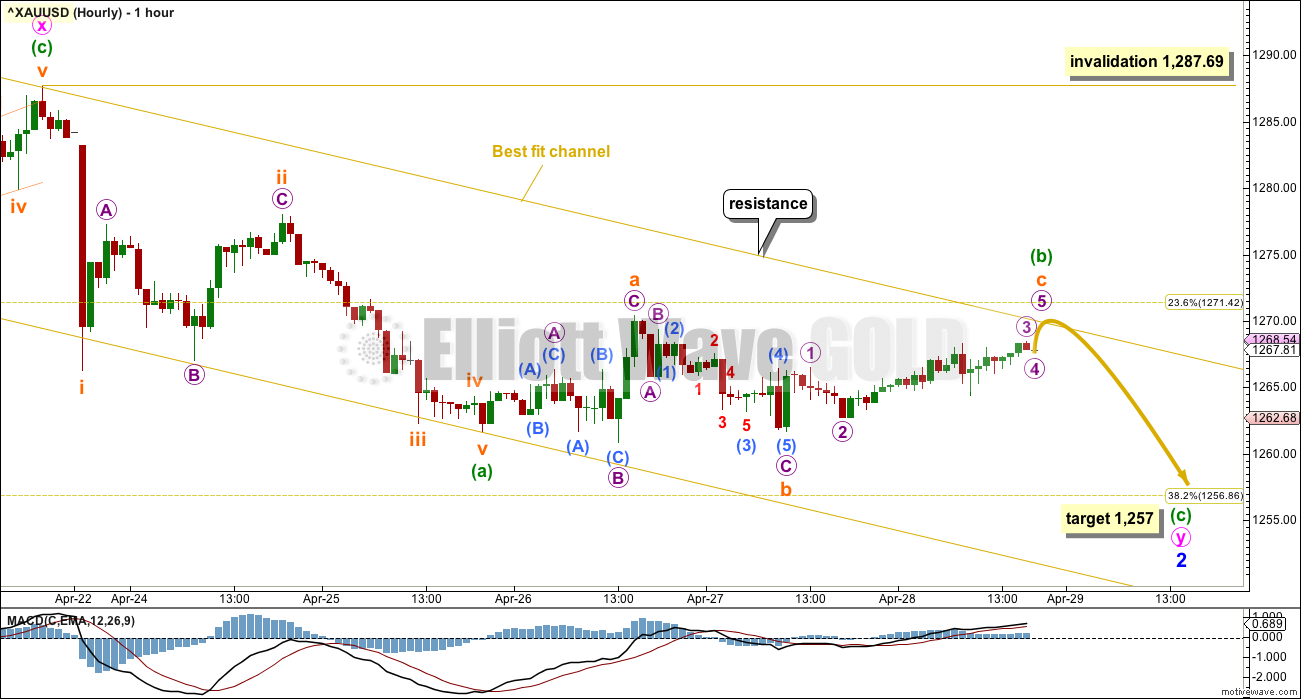
Minor wave 2 may be an incomplete double zigzag. The second zigzag may require minuette wave (c) downwards to complete.
Minuette wave (b) did not unfold as a triangle as expected in last analysis.
Minuette wave (b) may be unfolding as a regular flat correction. Subminuette wave c may end slightly above 1,270.38, so that it ends beyond the end of subminuette wave a to avoid a truncation.
Thereafter, minuette wave (c) downwards would be very likely to make at least a slight new low below the end of minuette wave (a) at 1,261.62 to avoid a truncation.
With minuette wave (b) incomplete, the ratio between minuette waves (a) and (c) cannot be used to calculate a target for minuette wave (c). The 0.382 Fibonacci ratio is used as a target for minor wave 2 to end about 1,257. This would allow for a small overshoot into the prior consolidation area, before a quick reversal. This idea has support from classic technical analysis: the area about 1,260 was an area of prior strong resistance but has now been strong support for the last three days.
ALTERNATE DAILY CHART
Click chart to enlarge.
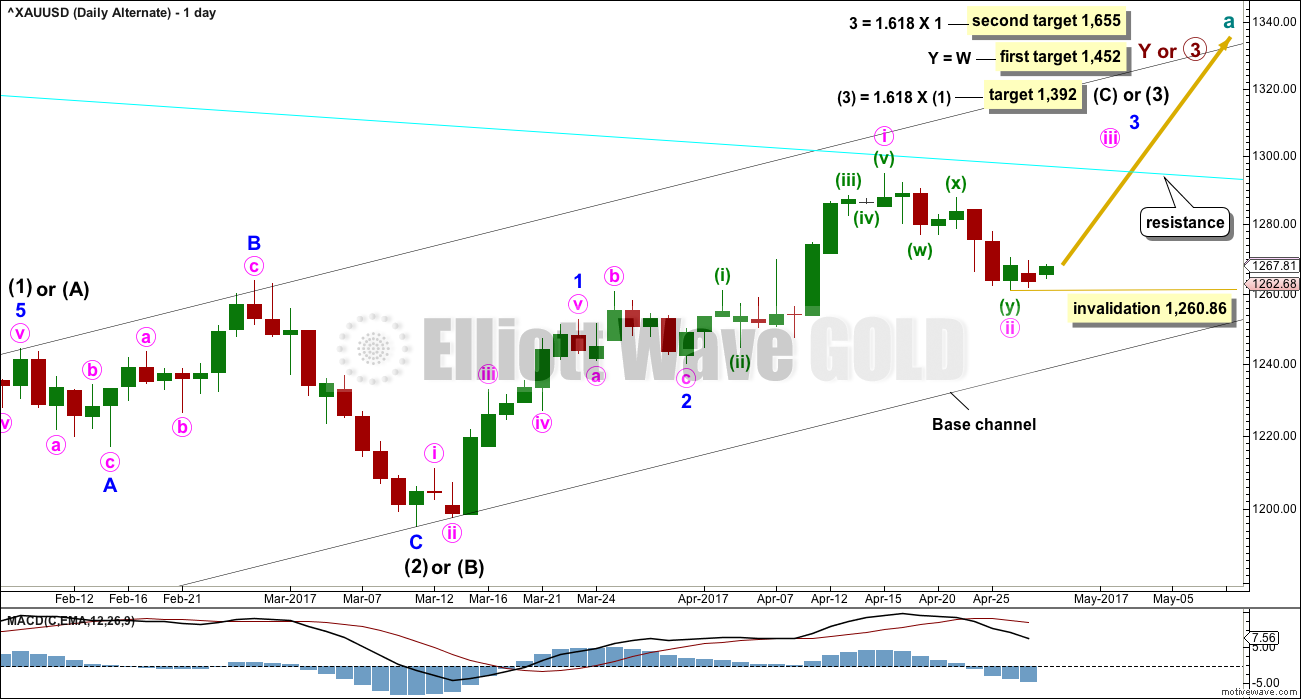
So far, within intermediate wave (3) or (C), minor waves 1 and 2 may now be complete. Minor wave 3 may have begun. Within minor wave 3, only minute wave i may now be complete and minute wave ii may be over here, or it may move a little lower but not beyond the start of minute wave i below 1,240.24.
Minor wave 2 lasted six days. Minute wave ii has now lasted seven days at this stage for this wave count. There is now a slight disproportion between these wave counts.
Within minute wave iii, no second wave correction may move beyond the start of the first wave below 1,260.86. A new low below this point would see this wave count discarded.
Minute wave iii should show an increase in upwards momentum and be supported by volume. Thereafter, minute wave iv should be shallow and may be very brief. When minute wave iv is complete, then minute wave v should show a further increase in momentum and may end with a blow off top.
ALTERNATE HOURLY CHART
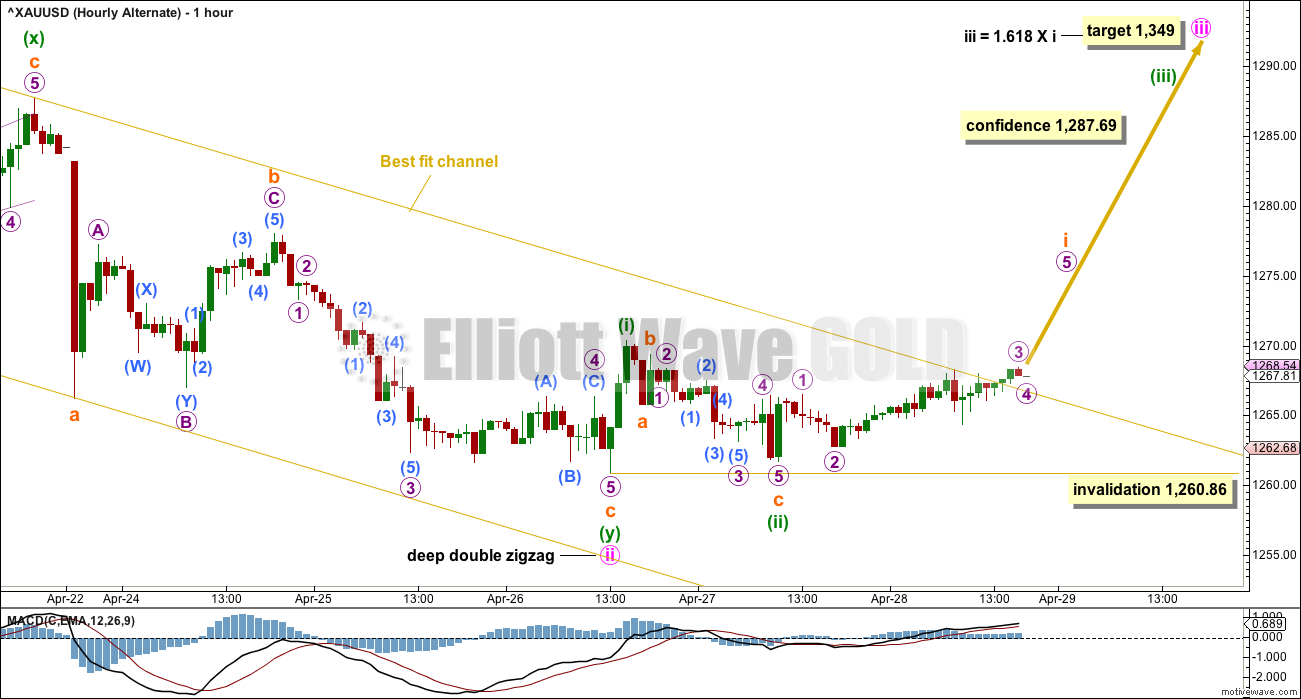
Click chart to enlarge.
The depth and structure of this pullback looks like a second wave correction. The only question between the two wave counts, main and alternate, is of what degree is this second wave correction.
Minute wave ii still fits as a double zigzag. It will not fit as a single zigzag because there is too much overlapping. Within the second zigzag labelled minuette wave (y), the structure of subminuette wave c may now have its final fifth wave complete. However, the bottom line is that there cannot be any confidence a low is in place while price remains within the channel.
If minute wave iii has begun, then a target is now calculated for it to end. At the end of Friday’s session the best fit channel is breached, but because it is by so little and upwards movement is not strong the breach is not convincing.
TECHNICAL ANALYSIS
WEEKLY CHART
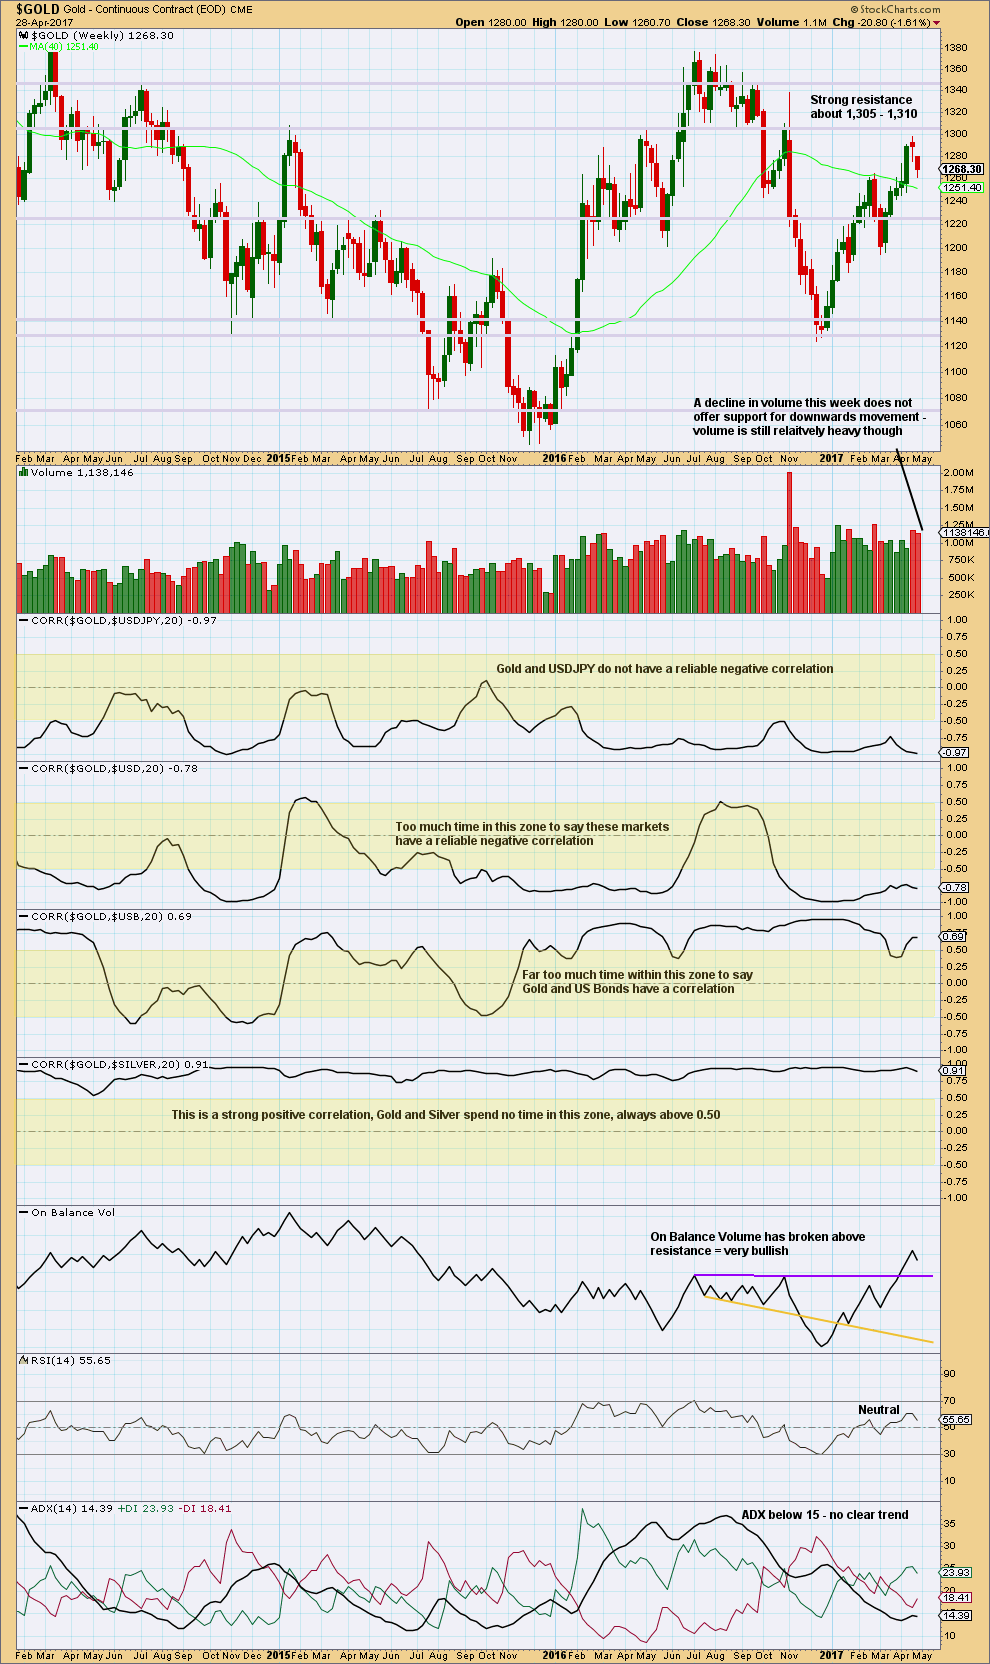
Click chart to enlarge. Chart courtesy of StockCharts.com.
There are a lot of assumptions out there about Gold and its relationships to various other markets. Happily, there is a quick and easy mathematical method to determine if Gold is indeed related to any other market: StockCharts have a “correlation” option in their indicators that shows the correlation coefficient between any selected market and the one charted.
The correlation coefficient ranges from -1 to 1. A correlation coefficient of 1 is a perfect positive correlation whereas a correlation coefficient of -1 is a perfect negative correlation.
A correlation coefficient of 0.5 to 1 is a strong positive correlation. A correlation coefficient of -0.5 to -1 is a strong negative correlation.
Any two markets which have a correlation coefficient that fluctuates about zero or spends time in the 0.5 to -0.5 range (shown by highlighted areas on the chart) may not be said to have a correlation. Markets which sometimes have a positive or negative correlation, but sometimes do not, may not be assumed to continue a relationship when it does arise. The relationship is not reliable.
For illustrative purposes I have included the correlation coefficient between Gold and Silver, which is what strong and reliable correlation should look like.
Volume this week suggests the downwards movement is a pullback, and it may still continue further as volume remains fairly heavy.
Gold has made a series of higher highs and higher lows since the low in December 2016, the definition of an upwards trend. Assume the trend remains the same until proven otherwise.
This weekly chart still remains mostly bullish with some neutrality.
DAILY CHART
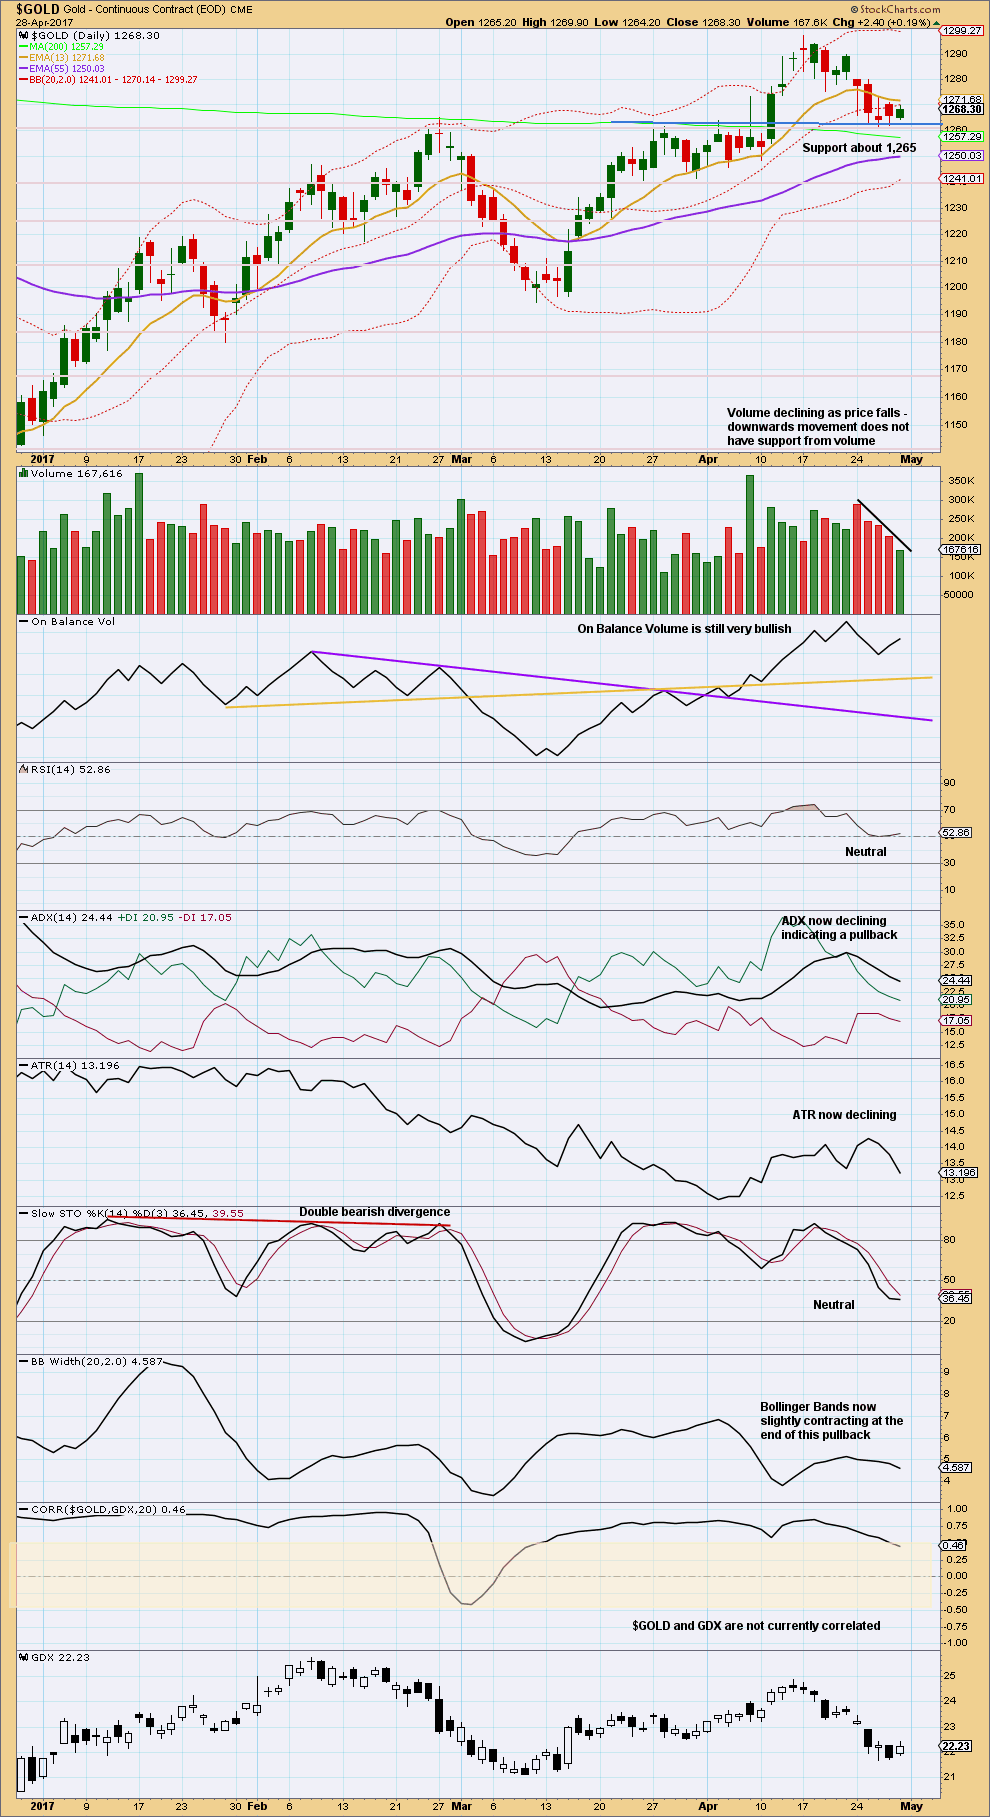
Click chart to enlarge. Chart courtesy of StockCharts.com.
Support about 1,260 – 1,265 is still holding.
Declining volume for a small upwards day is concerning for bulls. There may yet be another test of support before the next upwards wave.
At this stage, Bollinger Bands, ATR and ADX indicate this is still most likely a pullback within a larger upwards trend.
GDX
DAILY CHART
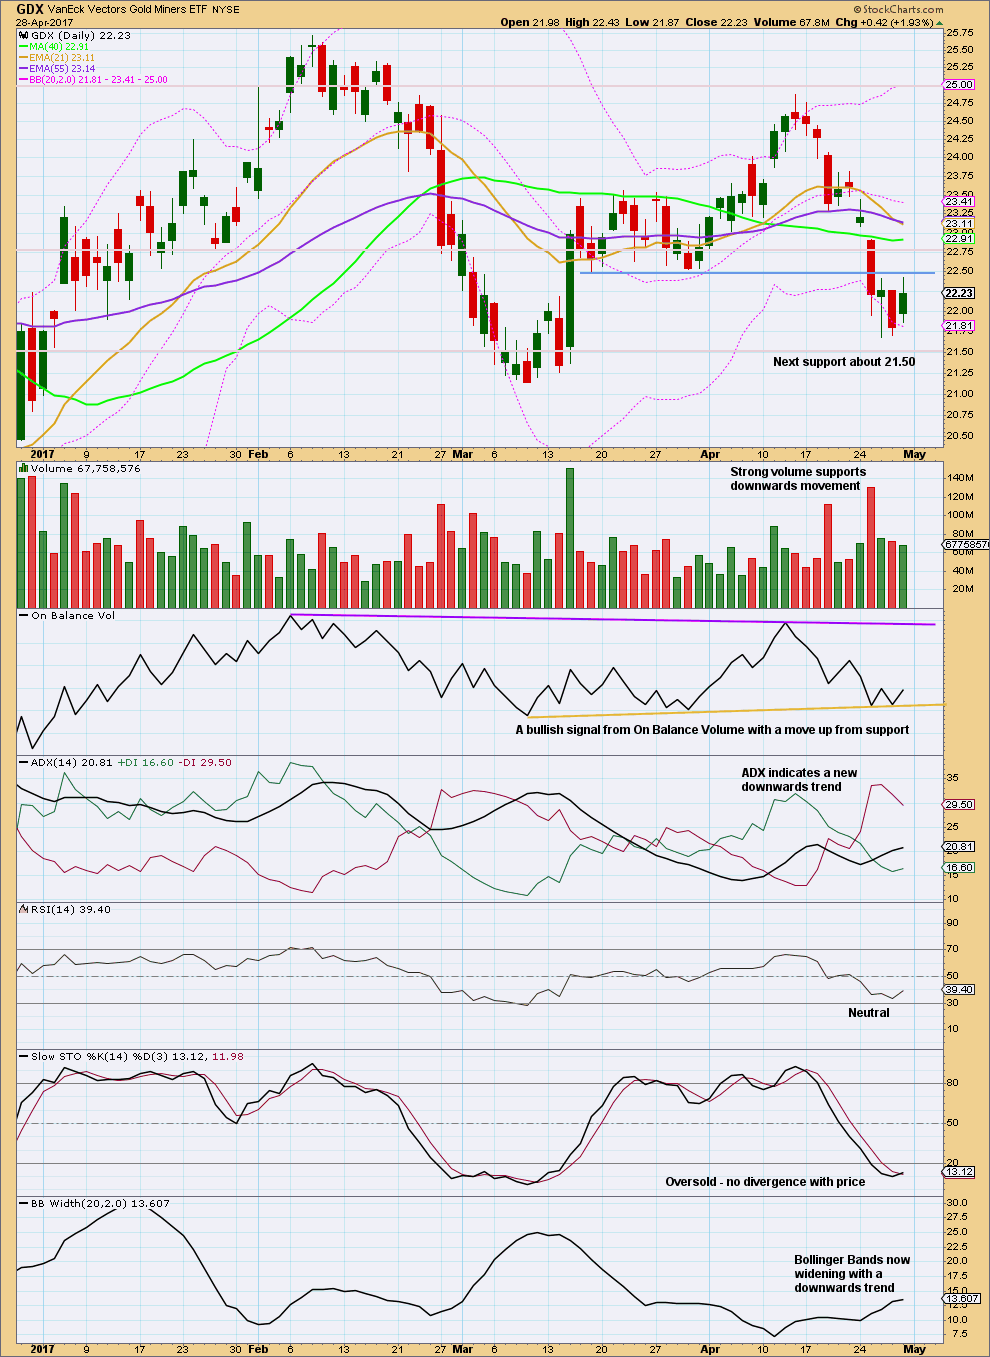
Click chart to enlarge. Chart courtesy of StockCharts.com.
At this stage, it looks like GDX is in a downwards trend. The break below support about 22.50 is now being tested and this area is now providing resistance. This looks like a typical throwback in a downwards trend.
On Balance Volume is bullish.
Everything else is neutral to bearish.
Stochastics may remain oversold for long periods of time during a trend, so this does not indicate price must turn here.
STUDY OF A THIRD WAVE IN $GOLD
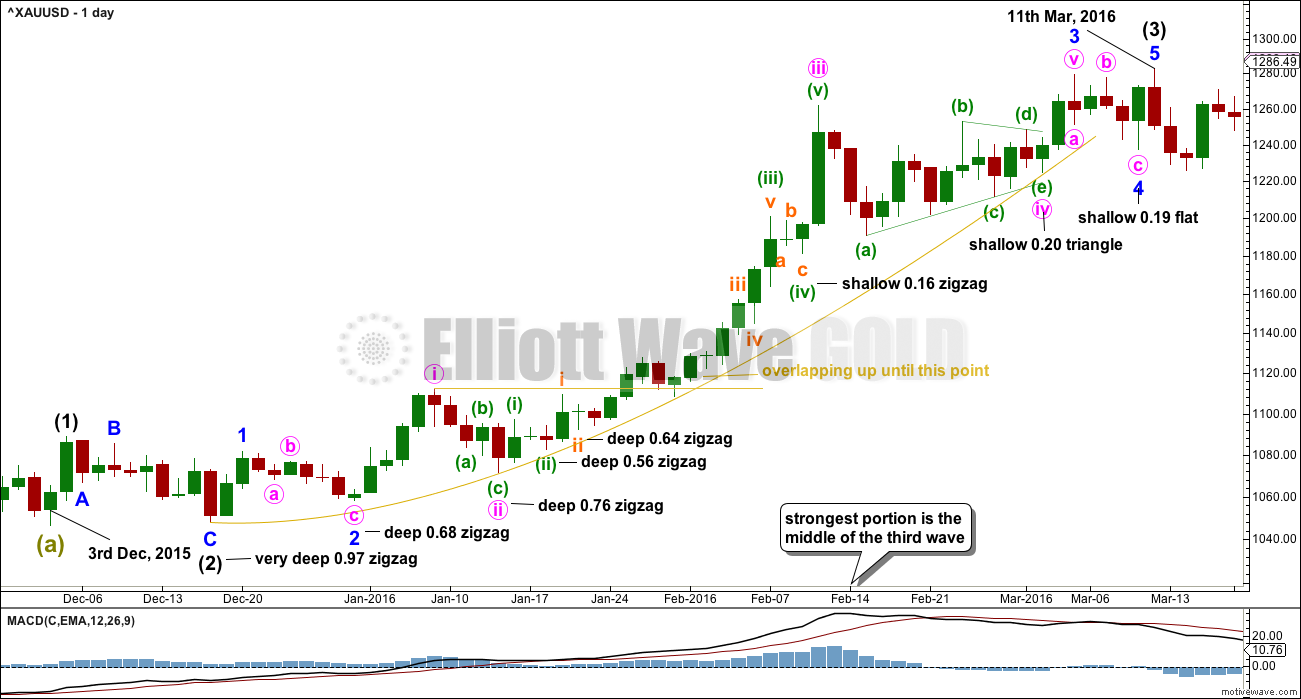
Click chart to enlarge.
This study of a third wave will be left in daily analysis until the current third wave is either proven to be wrong (invalidated) or it is complete.
This third wave spans 59 trading days.
It was not until the 40th day that the overlapping ended and the third wave took off strongly.
The middle of the third wave is the end of minute wave iii, which ended in a blow off top.
There is excellent alternation between second and fourth wave corrections.
This third wave began with a series of five overlapping first and second waves (if the hourly chart were to be added, it would be seven) before momentum really builds and the overlapping ends.
The fifth wave of minuette wave (v) is the strongest portion.
This third wave curves upwards. This is typical of Gold’s strong impulses. They begin slowly, accelerate towards the middle, and explode at the end. They do not fit neatly into channels. In this instance, the gold coloured curve was used.
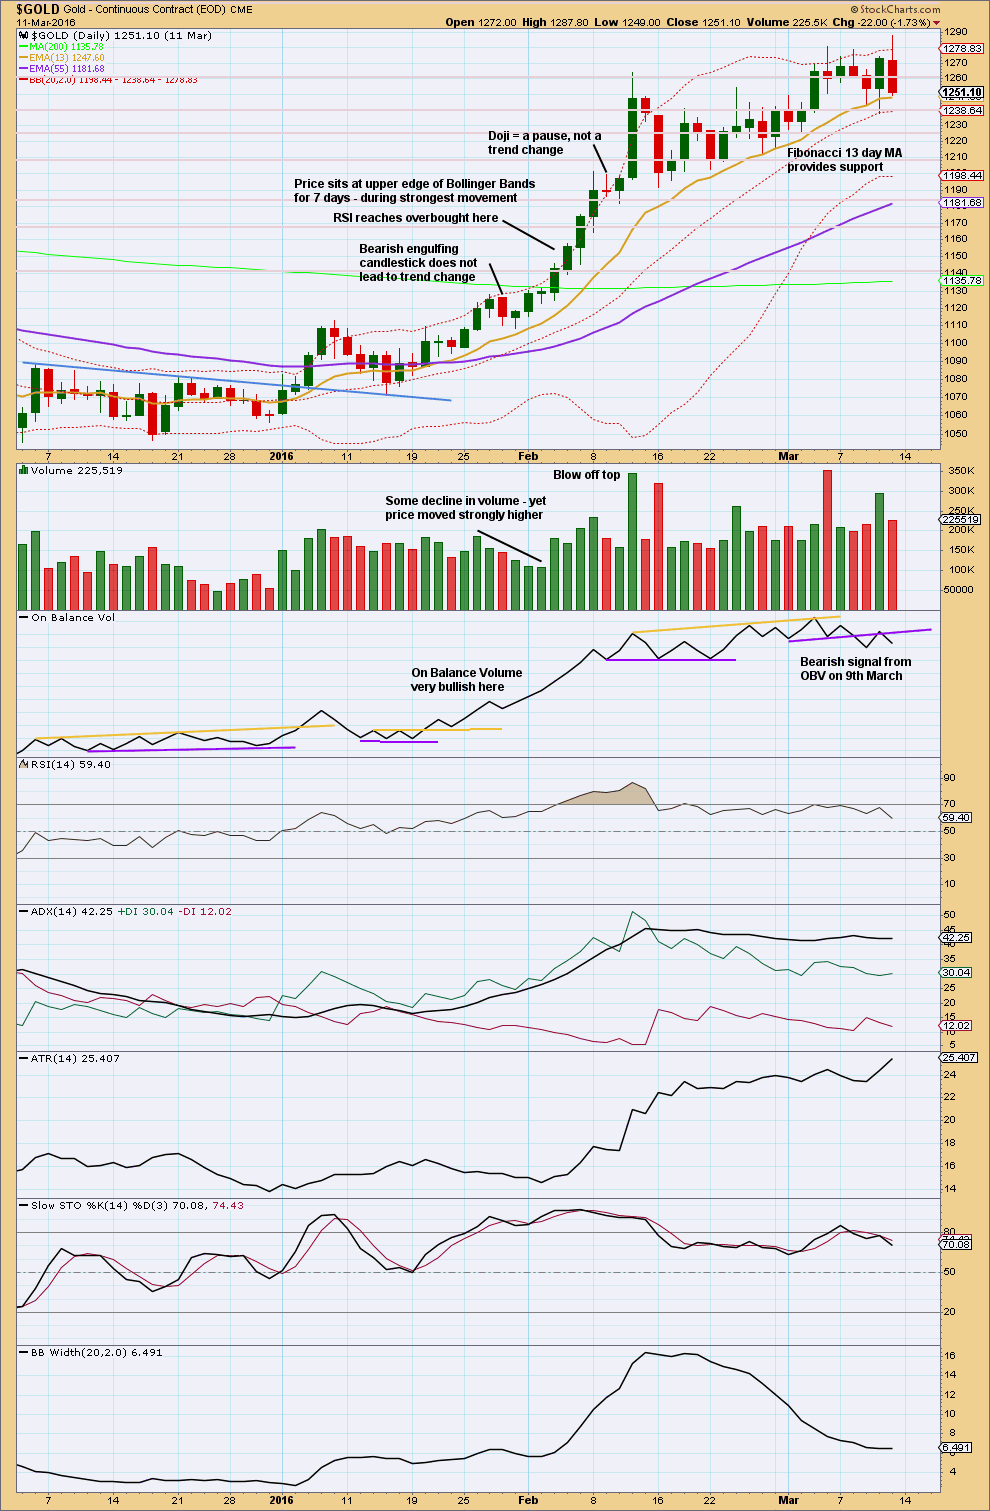
Click chart to enlarge. Chart courtesy of StockCharts.com.
This trend began after a long consolidation period of which the upper edge is bound by the blue trend line. After the breakout above the blue trend line, price curved back down to test support at the line before moving up and away.
RSI reaches overbought while price continues higher for another five days and RSI reaches above 85. The point in time where RSI reaches overbought is prior to the strongest upwards movement.
ADX reached above 35 on the 9th of February, but price continued higher for another two days.
The lesson to be learned here: look for RSI to be extreme and ADX to be extreme at the same time, then look for a blow off top. Only then expect that the middle of a big third wave is most likely over.
The end of this big third wave only came after the blow off top was followed by shallow consolidation, and more highs. At its end RSI exhibited strong divergence with price and On Balance Volume gave a bearish signal.
Third waves require patience at their start and patience at their ends.
This analysis is published @ 10:52 p.m. EST on 29th April, 2017.
Lara
What does copper count suggest ?
Just looked at that. Not sure. Copper’s off the table for now.
😊
Here’s another idea. The low could be in. But we need some confidence in this idea before we should trade on it.
Good morning everybody 🙂
As Dreamer points out, looks like minuette (c) needs a fourth and fifth wave to complete…
Subminuette iv may not move back up into subminuette i price territory.
How many hours different is the time zone for you Lara from Eastern Standard Time here in the states?
I added to my JNUG today…very, very long now. With a GC contract.
When I’m up about 7am it’s 3pm EST.
So it’s now Tuesday morning here in New Zealand. We’re living in the future down here!
These market makers are absolute criminals. The spread on my NUGT puts is 0 bid, and 4.00 ask. The bid on puts two bucks below my strike price is 1.00. I cannot believe they get away with this stuff.
GLD has clambered back above its 200 dsma and trading at 119.65….atta boy!
Silver really got slammed big time today….Silver eagles anyone??!! 🙂
Gold looks like it needs only subminuette 4 & 5 to complete her main count. Likely bottom on Tuesday, although could be Wednesday if subminuette 4 is slow motion shallow correction.
Silver just dipped into Lara’s target zone for this correction to complete.
Fed announcement Wednesday.
Stay vigilant!
Drop down to 1254 should complete the minor wave 2???
Lara great analysis. Gold has done what you called for it to.
Now brace for 3rd of 3rd ave to unfold.
Thanks
Well, I was certain the bear raid would come after hours but apparently they were confident enough to bring the beat down during the regular session. Futures tagged 1255.55. Let’s see if this holds and we can get a close above the 200 dmsa.
https://seekingalpha.com/article/4067142-sentiment-speaks-gdx-moving-buy-zone?app=1&uprof=51&isDirectRoadblock=false
This weekend’s article by Avi Gilburt on current GDX targets…
Getting close to my expected low of 1250.00
They have now taken a battering ram to the GLD 200 dmsa at 119.64
Gandalf??!! 😀 😀 😀
Looks like they are not quite ready to head for the exits. lol!
Another naked short contract dump in the futures market. You gotta give ’em an “E” for effort.
Must have been Chinese, Russian or Indian buyers…
Have they started to cover?
Futures Gold price shows a gap up at from around 1266.29.
If that level stays open the shorts could be heading for the exits, albeit with a pretended of decorum….
Of course it also could be sovereign funds stepping in to grab some metal on the cheap… 🙂
Long term investing is wealth builder. Thanks to Lara’s excellent analysis of gold.
Since gold bottom in 2015 it has gone up 21%.
However, careful selection of PM junior stocks have done much better in this new PM bull trend.
—————————————————–
From Spock’s Website. Some interesting Facts.I am Posting… without the Matrix Portfolio… of course.
“Below is the SpockM portfolio, based on Fridays close, end of April. Points to note:
1. 30 rocks, none included in the VanEck ETFs (GDX and GDXJ)
2. SpockM rocks are mostly explorers and early stage developers
3. SpockM portfolio up 284% since January 2016 (GDX: up 69%, GDXJ: up 88%, over same time period)
4. Over last 2 weeks, SpockM portfolio is up 2%, GDXJ is down 10%
The figures speak for themselves.
Note: If you happen to own a PM stock, and VanEck is on the register for more than 5% equity in the company, then seriously consider selling the stock, or shorting it as a hedge. Find something else outside their influence. VanEck are a wealth hazard in this sector.
Spock
==========
Idea from Verne, and I’ll copy this comment over to the last US Oil analysis:
APC may be a good proxy for a short trade on US Oil. For those that cannot access the cash market. A nice clear break below a neckline of a head and shoulders pattern, with support from volume. Clear bearish On Balance Volume supports this.
Shorts may have stops just above the neckline (give the market a bit of room to move). That prior support zone should now offer resistance. Always use a stop, do not invest more than 1-5% of equity in any one trade.
Just in case any new member is wondering, No. That is not my definition of a T&C. My two rules for risk management are absolutely serious. I follow these rules myself. Every. Single. Trade. Risk management is the most important aspect of trading.
GDX could have bottomed already, but I think it’s more likely that the bottom will come in the next 3 days, below 21.14 and as low as 20.31
https://www.tradingview.com/x/Awjpl9Ms/
Reminder, 1 for 4 reverse splits in effect Monday for NUGT, JNUG, JDST
http://www.direxioninvestments.com/press-release/direxion-announces-reverse-and-forward-share-splits-of-fifteen-etfs?utm_campaign=Split%20Email%20May%202017
I was holding a few NUGT puts that should have really popped today but that reverse split resulted in an absolutely awful spread on the bid/ask. What a “co-incidink” Figures! 🙂
This is precarious with gold price walking the right rope 1260-59 holding so far. Can’t trust the Big Boys with daily CCI in negative territory & weekly CCI below 100. On a more positive note, 50dma is above the lower band and looks to be heading to cross above the 200dma; keeping it long on the dip/s unless something changes. . . . Wouldn’t worry about the FED/NFP etc – just a smoke screen; better to follow price footprints & walk the walk with price. Best of Labour Day everyone; good trading!
No Trading Room update today. Will hopefully have some time in the next day or two.
Apologies everybody.
As Verne would likely say, be prepared for some “shenanigans” in the coming week:
Fed meeting notes release = Wed, 5/3 11:00am EST
Non Farm Payrolls = Fri, 5/5 8:30am EST
French Election = Sunday, 5/7
One or more of these events may add some volatility and wake up the gold market
Fed rate decision Wednesday @ 2pm est
Yes, sorry, was thinking my time…
On the matter of a possible rate increase, all I hear are crickets.
Why the remarkable silence, I wonder – nary a word about dot plots!
The intelligent thing to do would be to stand pat, but then of course that means a face full of egg. They may indeed try to save face and hike a quarter point, come hell or high-water. If they do, we will probably see both! 🙂
No press conference this time and low GDP as you mentioned recently = no raise this time. That said, the statement will determine the amount of volatility induced into the market.
Also, as Syed correctly states, news events rarely inject more than brief volatility. Price will follow social mood and therefore a correct EW count!
A no hike decision should logically be seen as a FED admission of economic weakness. In this bizzarro market, it will probably be seen as bullish!