
A small inside day indicates a small consolidation.
Today’s candlestick completes a Harami reversal pattern, but this is not a strong reversal pattern though. An alternate Elliott wave count is provided.
Summary: If GDX is again to lead Gold price, then Gold should have a low in place today. Targets for minor wave B are either 1,245 or 1,264, and these are equally as likely. Minor wave B may be a quick sharp zigzag or a time consuming sideways movement lasting weeks. Reasonable confidence that minor wave B has begun may only be had when price breaks above the upper edge of the best fit channel on the hourly charts.
New updates to this analysis are in bold.
Last historic analysis with monthly charts is here, video is here.
Grand SuperCycle analysis is here.
MAIN ELLIOTT WAVE COUNT
For clarity I have decided at this time it may be best to publish on a daily basis weekly charts I and II. Both charts expect a zigzag down to complete and the difference is in the expected depth.
WEEKLY CHART I
Click chart to enlarge.
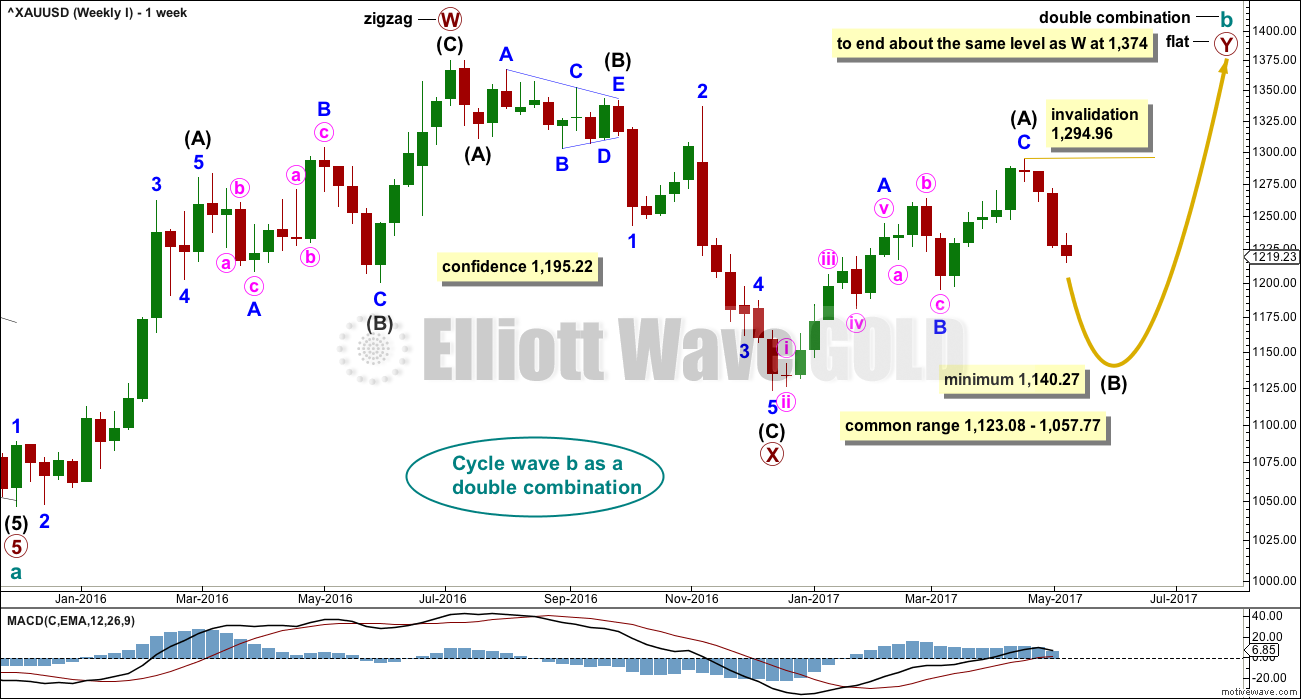
Combinations are very common structures. Cycle degree waves normally last one to several years, and B waves do tend to be more time consuming waves than all other waves. Given these tendencies the most likely scenario at this point may be that cycle wave b is an incomplete double combination.
The first structure in the double labelled primary wave W fits as a zigzag. This upwards movement will subdivide as either a three (zigzag) or a five (impulse). It does have a three wave look to it.
The double is joined by a deep three in the opposite direction labelled primary wave X, which is a 0.77 depth of primary wave W. X waves within double combinations are normally very deep; this one looks right.
The second structure in the combination may be either a triangle or a flat correction. Both of these structures have A waves which subdivide as threes.
At this stage, the upwards wave from the low in December 2016 does now look best and subdivide best as a completed zigzag. This may be intermediate wave (A) of a flat correction or a triangle. Because a triangle for primary wave Y would look essentially the same as the second weekly chart below, only a flat correction is considered here. The most common two structures in a double combination are a zigzag and a flat.
This wave count follows the most common scenario and has the best fit.
Within the flat correction of primary wave Y, intermediate wave (B) must retrace a minimum 0.9 length of intermediate wave (A) at 1,140.27. The most common length for intermediate wave (B) is from 1 to 1.38 times the length of intermediate wave (A), giving a common range from 1,123.08 to 1,057.77.
Intermediate wave (B) may subdivide as any corrective structure, but the most common structure for B waves within flats is a zigzag. At this stage, on the hourly chart it looks like a five down is almost complete, which would indicate intermediate wave (B) is a zigzag subdividing 5-3-5.
The daily and hourly charts will follow this weekly chart. That does not mean the other two weekly charts aren’t possible, they are, but the number of charts must be kept reasonable on a daily basis.
WEEKLY CHART II
Click chart to enlarge.
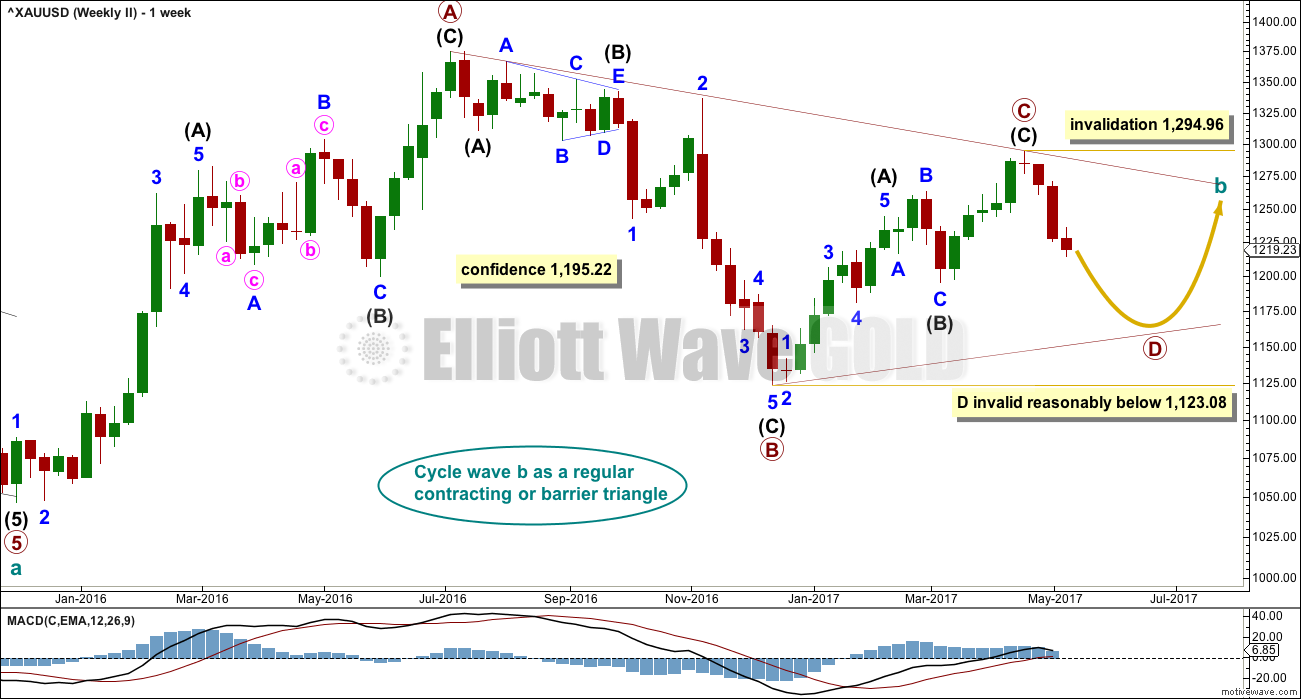
What if cycle wave b is a triangle? This is also entirely possible. Triangles are not as common as double combinations, but they are not uncommon.
Within the triangle, primary waves A, B and C are all single zigzags. One of the five subwaves of a triangle normally subdivides as a more complicated multiple, usually a double zigzag. This may be what is unfolding for primary wave D.
Primary wave D of a regular contracting triangle may not move beyond the end of primary wave B below 1,123.08.
Primary wave D of a regular barrier triangle should end about the same level as primary wave B at 1,123.08, so that the B-D trend line is essentially flat. What this means in practice is that primary wave D may end slightly below 1,123.08 and the triangle would remain valid. This is the only Elliott wave rule which is not black and white.
Thereafter, primary wave E should unfold upwards and would most likely fall a little short of the A-C trend line. If not ending there, it may overshoot the A-C trend line.
DAILY CHART
Click chart to enlarge.
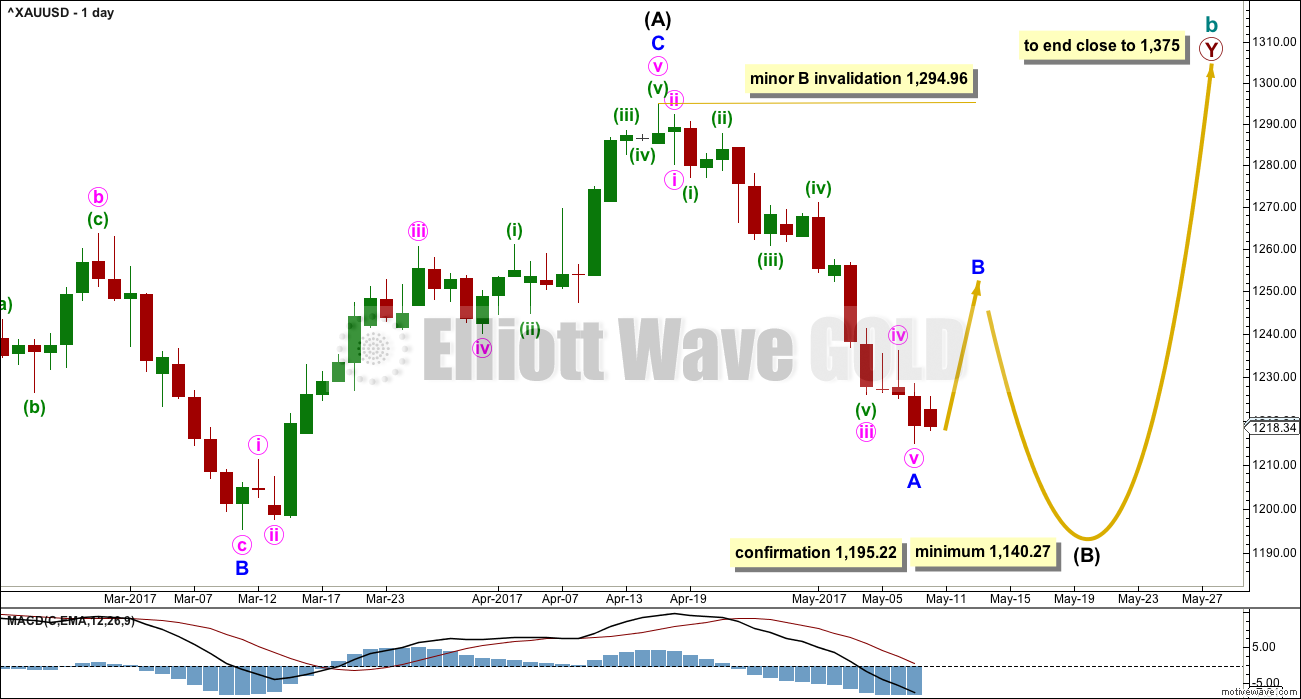
This daily chart will suffice for both weekly charts above, although the labelling follows weekly chart I.
Both weekly charts expect a zigzag downwards. Weekly chart I expects a deep zigzag for intermediate wave (B) to a minimum at 1,140.27. Weekly chart II expects a zigzag down for primary wave D to not move below 1,123.08 and most likely fall well short of that point.
The daily chart follows the expectations for weekly chart I, but the structure for weekly chart II would be exactly the same.
Within the flat correction of primary wave Y, intermediate wave (B) must retrace a minimum 0.9 length of intermediate wave (A) at 1,140.27. The most likely corrective structures to achieve the deep correction required for B waves within flats are single or multiple zigzags. These begin with a five, then a three in the opposite direction. A five down for minor wave A may be complete today. Minor wave B may have begun.
Minor wave B may be deep but may not move beyond the start of minor wave A above 1,294.96.
B waves exhibit the greatest variety in form and behaviour of all waves. They can be quick sharp zigzags or complicated time consuming combinations. There are more than 23 possible corrective Elliott wave structures that B waves may take, and at their start it is impossible to tell which structure may unfold. B waves do not normally present good trading opportunities; they can be time consuming consolidations with strong whipsaws. However, minor degree B waves may present some opportunity, so it is essential when they unfold that risk is managed diligently. The risk of losses is greater during consolidations than during trending markets.
When minor waves A and B are complete, then a target may be calculated for minor wave C downwards to end the zigzag of intermediate wave (B), using the Fibonacci ratio between minor waves A and C. That cannot be done yet.
2 HOURLY CHART
Click chart to enlarge.
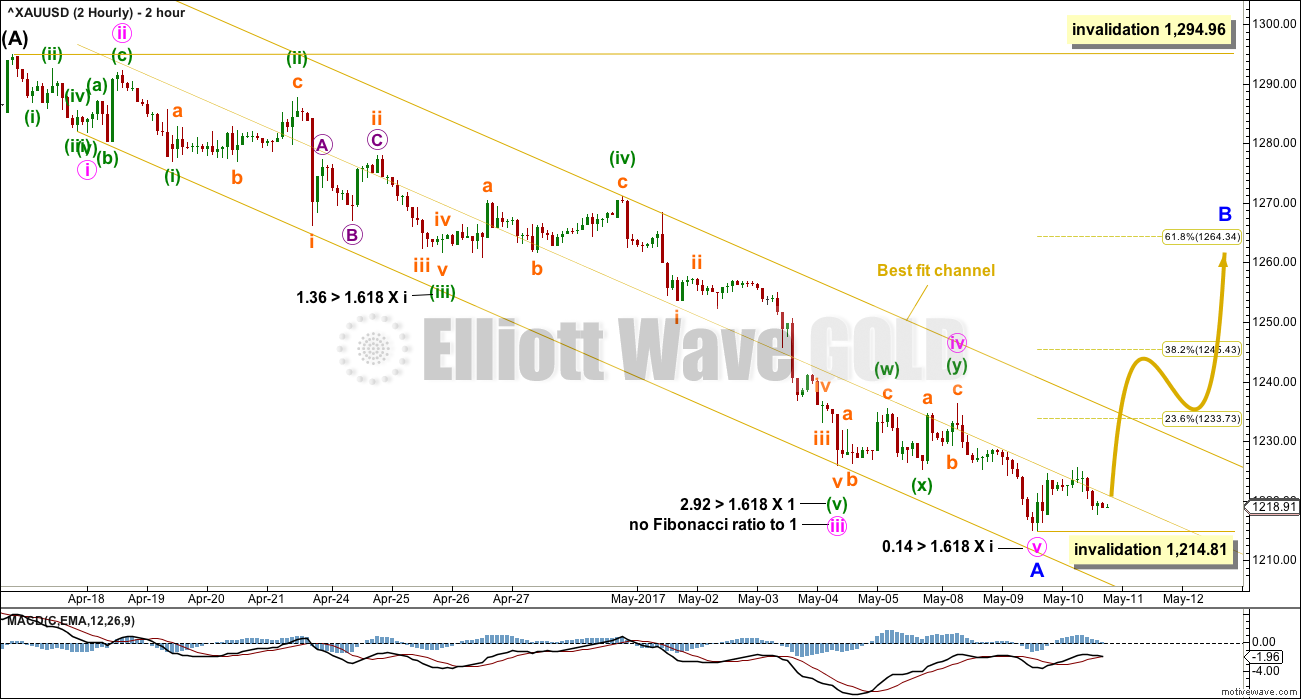
Minor wave A may now be complete. There would be now a Fibonacci ratio between minute waves v and i.
However, price remains within the lower half of the best fit channel, so there is not yet any confidence that a low is in place. Reasonable confidence can only come with a breach of the upper edge of the channel.
If minor wave B has begun here, then the 0.382 Fibonacci ratio at 1,245 and the 0.618 Fibonacci ratio at 1,264 would be targets. Neither of these ratios can be favoured; B waves exhibit huge variety.
If minor wave A is correctly labelled as a five wave impulse, then minor wave B may not make a new high above the start of minor wave A, at 1,294.96.
Minor degree waves normally last weeks. If minor wave A is complete here, then it would have lasted 3 weeks (16 sessions). Minor wave B may be reasonably expected to be about the same duration of three weeks.
At the hourly chart level, the first movement for a minor degree wave should be a five wave structure upwards. That would be still incomplete, so while it is unfolding no second wave correction may move beyond its start below 1,214.81.
HOURLY CHART
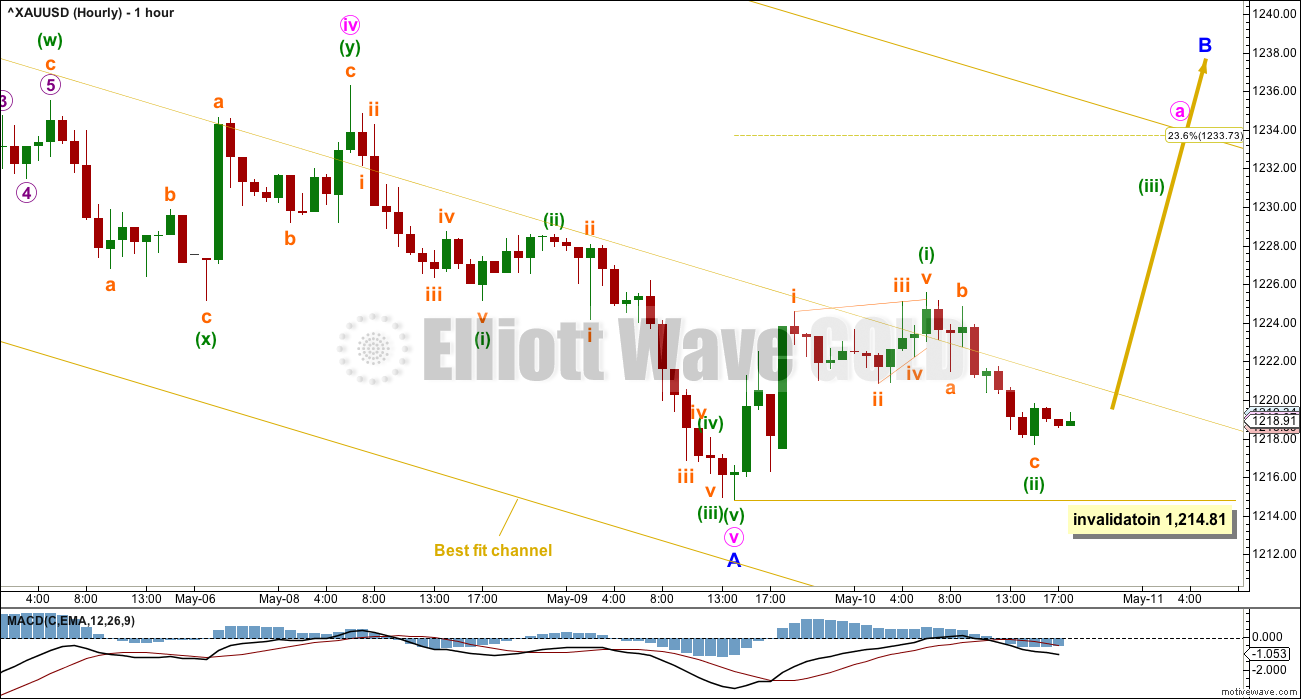
Click chart to enlarge.
If minor wave B has begun, then the very first upwards wave within it will only fit as a leading diagonal. While leading diagonals are not rare, they are really not very common. This slightly reduces the probability of this wave count today and is one reason why the alternate below is provided.
Leading diagonals in first wave positions are usually followed by very deep second wave corrections. Minuette wave (ii) is 0.73 the depth of minuette wave (i), fitting the description of very deep.
If this wave count is correct, then the next wave up for minuette wave (iii) should have the power to break at least into the upper half of the best fit channel, and maybe above the upper edge.
Minuette wave (ii) may not move beyond the start of minuette wave (i) below 1,214.81.
ALTERNATE HOURLY CHART
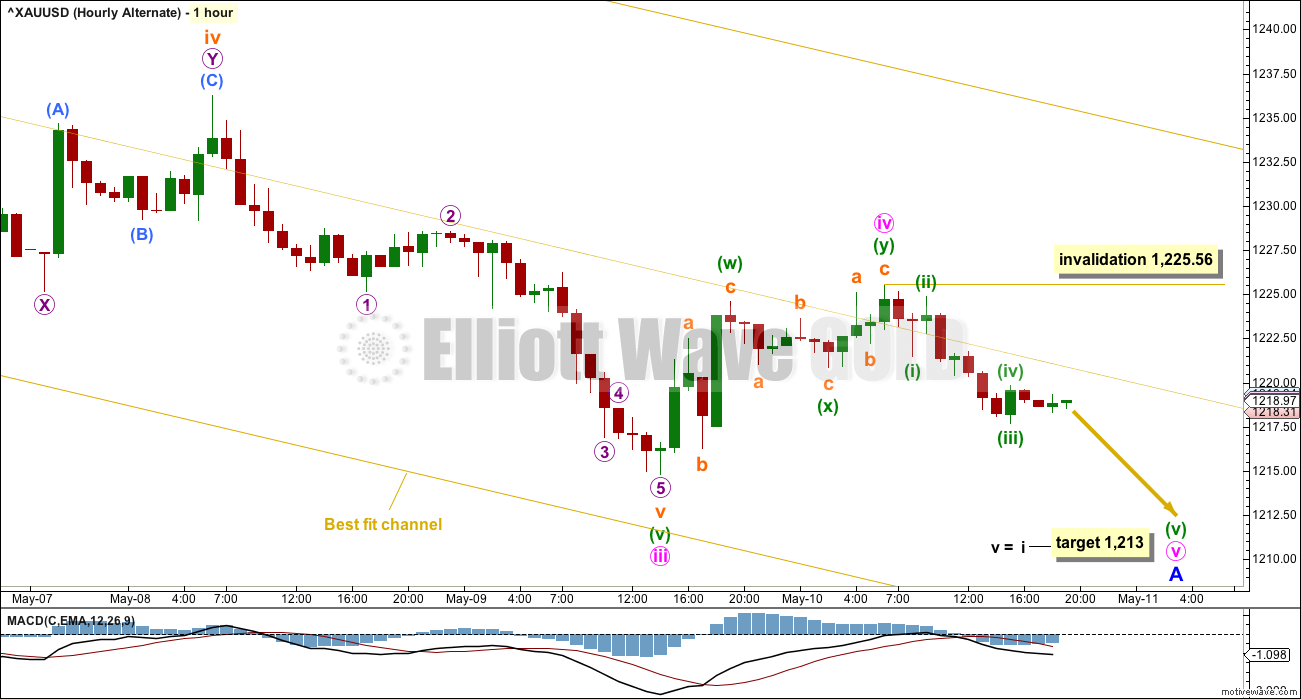
Click chart to enlarge.
There are so many subdivisions within minor wave A so far, so there are multiple ways to label this downwards movement.
It is possible that minute wave iv has only just ended and minute wave v downwards has begun. There is still no Fibonacci ratio between minute waves i and iii with this labelling, so it is very likely that minute wave v would exhibit a Fibonacci ratio to either of minute waves i or iii. The most common Fibonacci ratio for a fifth wave is equality in length with the first.
Within minute wave v, no second wave correction may move beyond the start of its first wave above 1,225.56.
TECHNICAL ANALYSIS
WEEKLY CHART
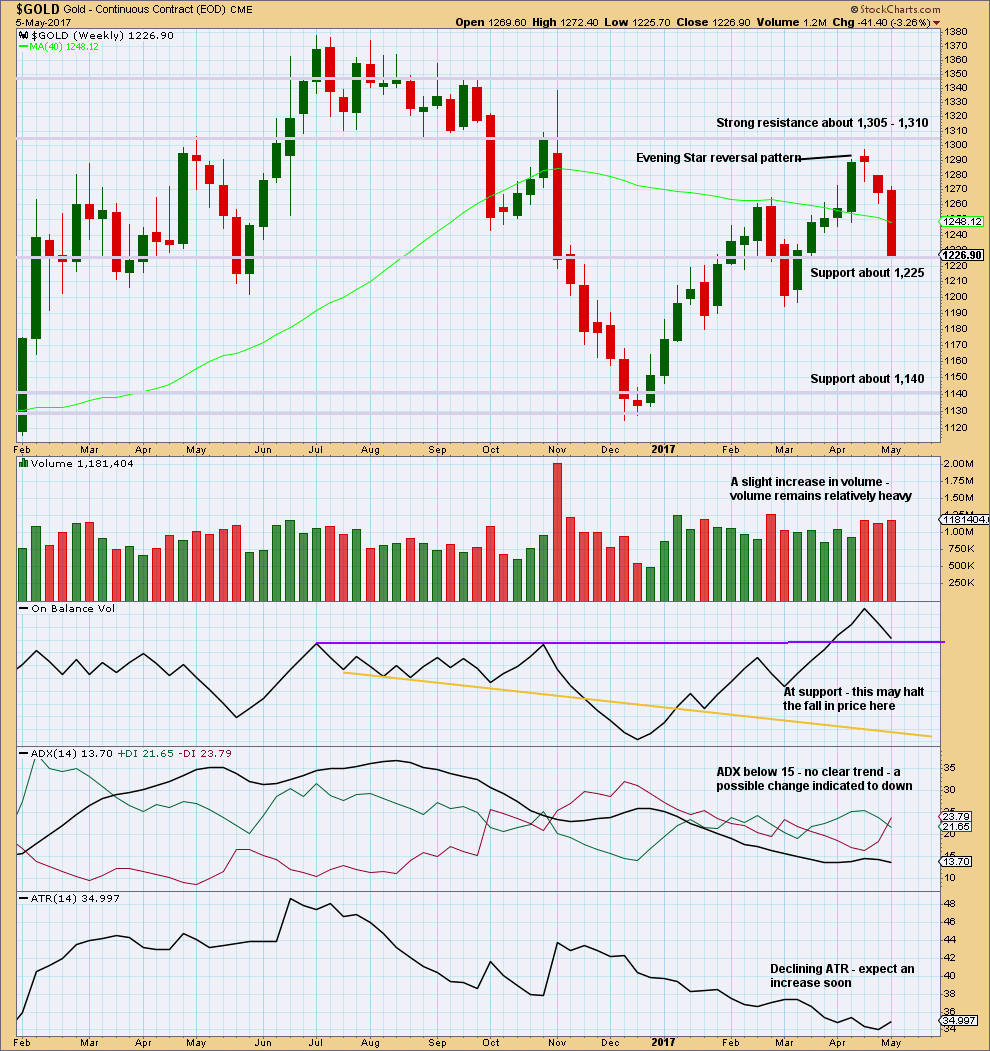
Click chart to enlarge. Chart courtesy of StockCharts.com.
This weekly chart now looks bearish. Volume is bearish. The strong weekly candlestick looks very bearish.
Support for price and On Balance Volume may halt the fall in price temporarily, a bounce about here looks like a very reasonable expectation.
DAILY CHART
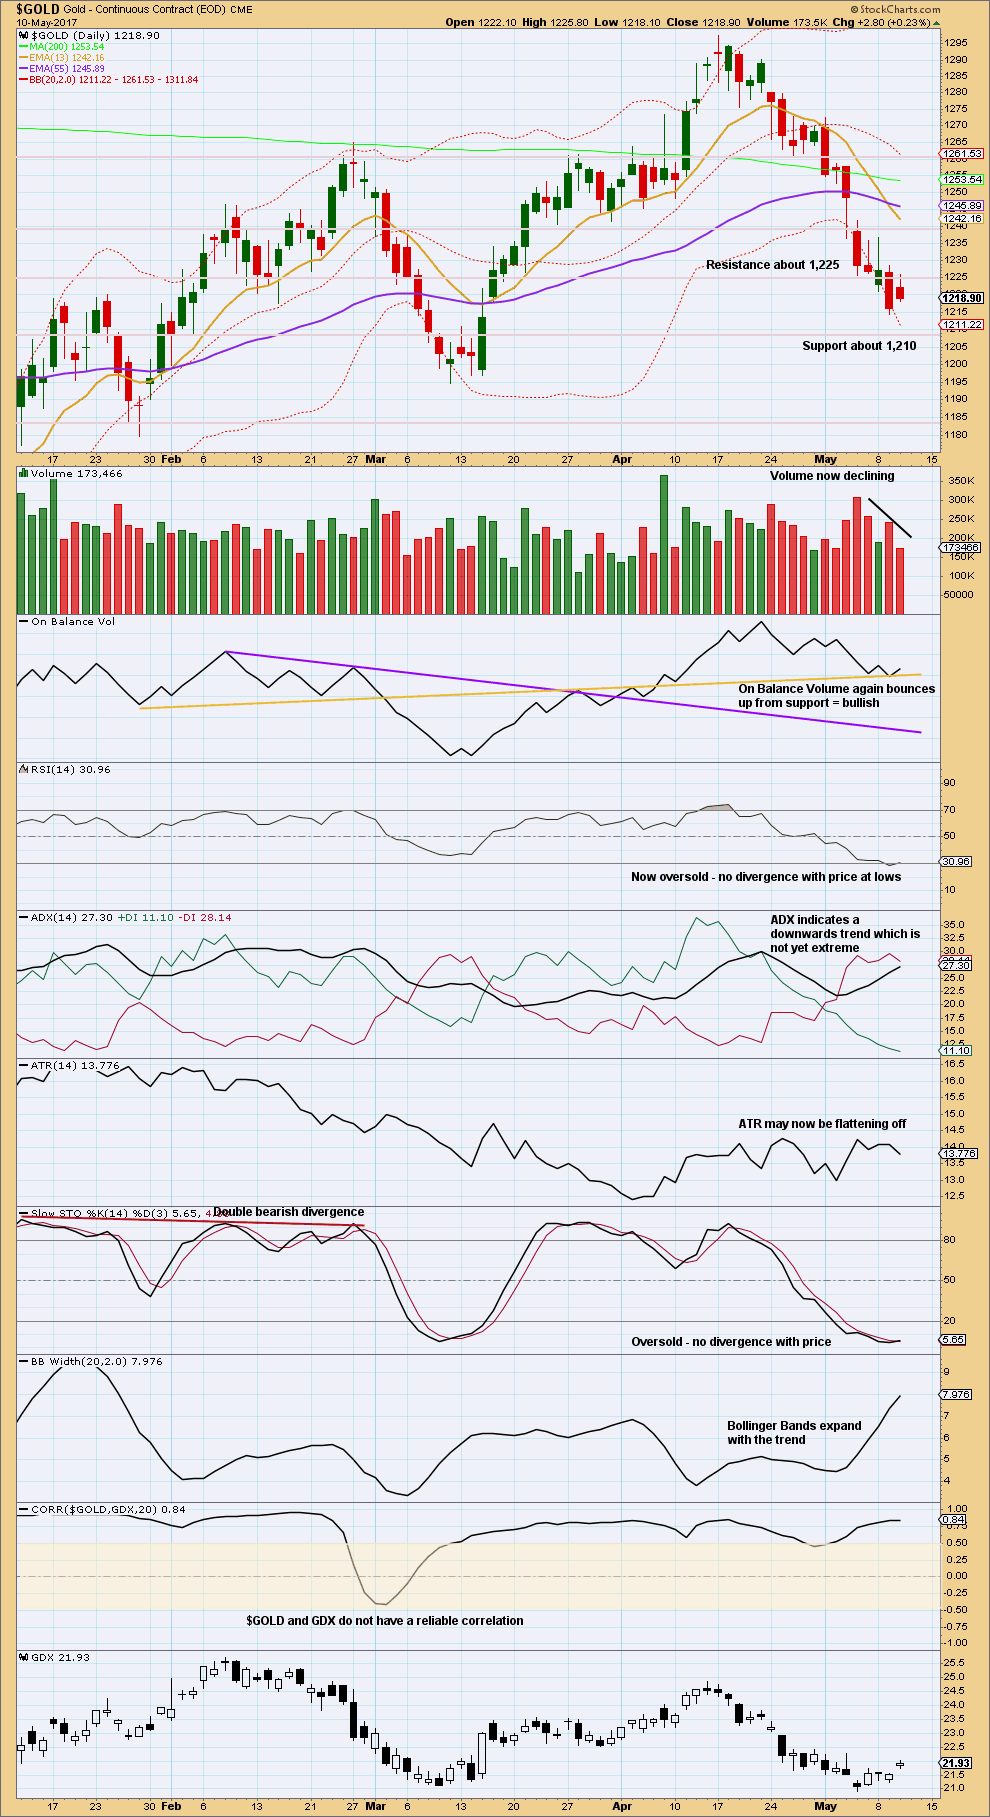
Click chart to enlarge. Chart courtesy of StockCharts.com.
Today’s candlestick completes a Harami reversal pattern. This is not a strong reversal pattern though, so further confirmation would be required for confidence that a low is in place. A green daily candlestick to follow would be good confirmation.
The balance of volume for this inside day was upwards and it shows a decline. The upwards movement during the session was not supported by volume; this is slightly bearish.
On Balance Volume gives a bullish signal today that is given reasonable weight. With On Balance Volume finding support now twice at the yellow trend line, it looks like a low may be at least temporarily in place for Gold. Look for first resistance now about 1,225.
ADX is nearing extreme but not there yet. There is room for price to fall further. ATR flattening off looks like the downwards trend may be temporarily halted, as does RSI and Stochastics returning now from oversold.
GDX
DAILY CHART
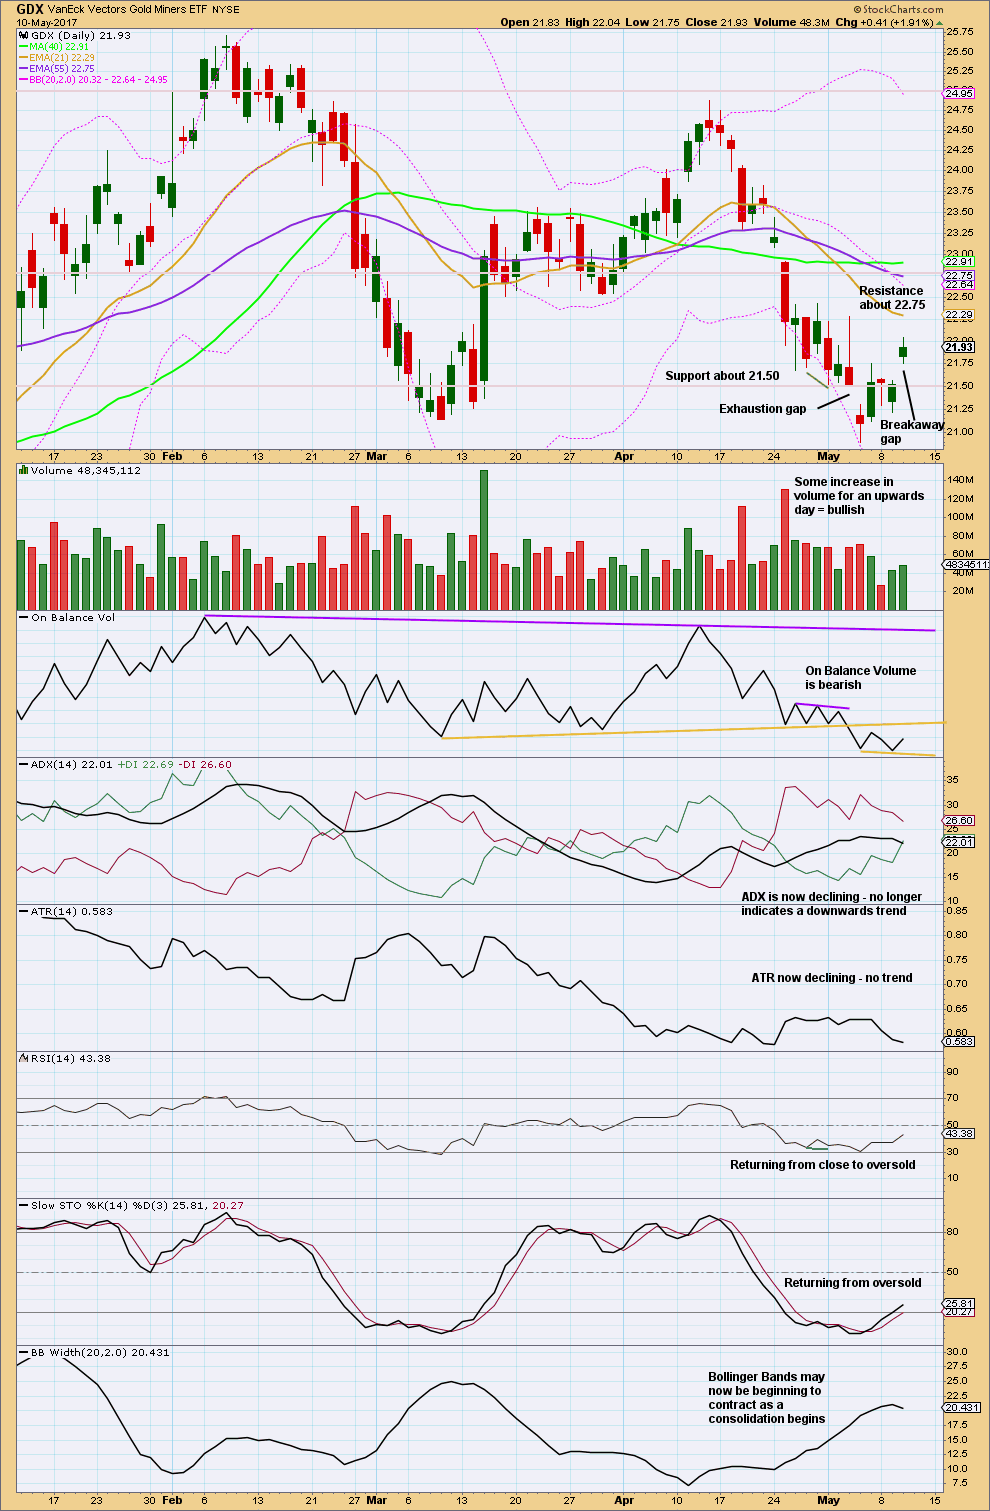
Click chart to enlarge. Chart courtesy of StockCharts.com.
GDX led the last turn for Gold and GDX, let’s assume, may lead the next turn.
The strong upwards gap today looks like a breakaway gap after a small three day consolidation. If GDX is now in a bounce or a new upwards trend, then support may be found for now at the lower edge of the gap. Breakaway gaps are not usually filled for some time.
While On Balance Volume is overall bearish, it does give a small bullish signal today with a turn up from the new trend line. This line has only been tested twice now though, so it does not offer strong technical significance. Look for resistance at the stronger yellow line above to possibly halt the rise in price.
ADX and ATR indicate GDX may have entered a consolidation. With RSI and Stochastics now heading higher, look for a bounce to continue until Stochastics reaches overbought. Next resistance is about 22.75.
This analysis is published @ 08:05 p.m. EST.
OPEC feels the pressure when prices go below $50….
http://money.cnn.com/2017/05/11/investing/opec-oil-u-s-supply/index.html?iid=hp-grid-dom
Price is in the upper half of the best fit channel, for the first time in several days. This is a strong warning that a low may be in place. We can have reasonable confidence in this view if price breaks above the upper edge of the channel.
Hourly chart updated:
Futures oil price went to exactly the invalidation point of 48.22 before reversing. Talk about a beautiful set-up….!
Whew. Held onto my shorts by the skin of my teeth….
Time to add. Feels wrong… could be oh so right
I am adding like there is no tomorrow! 😀
Sticking to the plan, but risking only 1.5% of equity on this new position…
Put a new chart up on Oil post.
Lara/Alan
Thanks for reply. That is what I thought.
Is minor A part of flat structure and wave B is unfolding assuming minor A is complete?
If that is correct than minor wave B of a flat does it have to travel minimum 90% of minor A or not???
OR minor wave B is a different structure??
Lara gave lower target for minor B than 90% of wave A.
Just trying to understand.
=======================================
May 9
Not necessarily. It could be a very shallow correction.
The 0.382 Fibonacci ratio is at 1,245. The 0.618 Fibonacci ratio is at 1,264.
So for minor B to reach 1,286 it would be very deep indeed. It doesn’t have to be.
Papudi.
Consider the social mood. Gold has been battered down big time. Many people had gone euphoric when price first climbed to 1375 but they were quickly brought back to earth. The next joy came at 1295 and again the fires of enthusiasm were quickly doused. So, they would pounce on any opportunity to buy in, what with all the pent-up frustration. Remember what they say about buying the dip. I would expect a simple 3-wave affair for Minor B, not a flat. The price points 1245 and 1264 happen also to be major resistance areas (you may refer to my resistance-support analysis posted two days ago). Lara rightly declared that gold could end up with either. I know many analysts out there are clamouring for the 1264 level. Yet, many are still harbouring negative thoughts, preferring a breakthrough of the 1235 region for a bullish stance.
If you can refer to my earlier post on Ichimoku Daily, I noted the fundamental aspects. There appears to be no positive catalyst on the horizon for a higher price, so unless something drastic happens, I don’t think price can even break the 1264 barrier at the first try. If there is a paucity of geopolitical tension, even 1245 may be hard to come by. So, at this point, I will go with Lara, and trade each day as it comes.
For Weekly I wave count, yes, intermediate (B) could be a flat.
For Weekly II wave count, no primary D cannot be a flat.
This downwards wave which began at the high on the 17th of April is most likely to be a zigzag. Until proven otherwise I’m going with the most likely scenario.
Now, of course as you well know this risks me being wrong. But if I keep with most likely scenarios I’ll be right more often than wrong. On the occasions that I’m wrong then good risk management will save accounts.
The wave down from the 17th of April high looks most like a five wave impulse. Which would be wave A of a zigzag. (it could also be wave 1 of a new impulse down).
Wave B can’t move beyond the start of A above 1,294.96.
It gets complicated. In the end of week video I’ll try to go over this piece of movement and try to clarify as much as I can.
Ichimoku Hourly Update.
The 1-hour chart was a bit slow to show the rally in subminuette 3 of minuette 3. Price had poked its head above the top of the cloud boundary but all is not clear yet for a run for the bull. It needs to completely clear the top of the cloud boundary as a first step.
In short-term trades, I use the 5-minute chart which keeps reasonable pace with price movements. I entered a nibble at the end of subminuette 2 at 1220.39 this morning.
Now, price has cleared the 1225 resistance area, that which it did not manage to break yesterday. And now for the 1235-1237 resistance cluster.
A nibble 🙂
Yes, I did that last night, not wanting to get up too early this morning.
You must stay up in the night Alan? It’s 4:24 am over there?
Looking at the Main Count, price has reached subminuette 1 of minuette 3 at 1222.54. Currently undergoing the C wave of subminuette 2, upon completion there should at last be some semblance of life for subminuette 3 (It still is a third of a third, albeit on a lilliputian scale). At 1.618 Fib, the upmove would be 1.618 * (1222.54 – 1217.69) = 7.85. It could be more.
The fun now begins.
I was afk.
Do you pick a short now and wait for a retest in the hourly of 1217 area?
I will wait for a retest. That would be subminuette 2. It is nearing that now. So, there is ample opportunity to enter a trade when the market opens.
Alan
Where is the starting price point of minor A?
From ? u know how much I know EW!!LOL!
Papudi.
Minor A started from 1294.96 and ended at 1214.81, and this is the current Main Count. In Lara’s Alternate Count, Minor A hasn’t ended yet.
My mistake. The high of 1224.04 was only subminuette 1 of minuette 3 of Minute A.
Lara.
Price has rallied to a high of 1222.54 at 1 am ET today. It has moved into Wave 1 territory in the Alternate Count. This would indicate an ending diagonal for Minute 5 in progress. Moreover, it looks like an expanding diagonal. Does this mean that the Alternate Count has now become much less probable?
An alternative explanation is that Minute 5 has morphed into a combination WXY.
I think the market has overtaken this comment now with a new high above 1,225.56.
The alternate hourly is invalidated. Unless I revive it by trying to see minute iv continuing.
Minute v can’t be a combination. Fifth waves of impulses may only be five wave structures themselves; diagonals or impulses.
Gold to silver ratio is most important indicator for direction of PM trend. When it declines nominal price of bullion goes up and vice a versa.
http://tsi-blog.com/2017/05/what-should-the-goldsilver-ratio-be/
“The gold/silver ratio’s performance over the past five decades suggests that the 45-60 range can now be considered normal, with moves well beyond the top of this range requiring a banking crisis and/or bursting bubble and moves well beyond the bottom of this range requiring rampant speculation focused on silver.”
=========================================
I have been watching the ratio in 4 hour and hourly chart.
Finally it broke below the consolidation triangle. Suggesting nominal price of gold will move higher now.
Thanks Papudi for the post.
It was mentioned that the normal range for GSR is 45 to 60. Now , it is in the mid-70s. Therefore, to return to the normal range, GSR must drop to the region below the lower green line. This is quite substantial. As GSR is the ratio (gold price) / (silver price), this would mathematically imply that:
(1) When both gold and silver prices move in tandem, (a) Gold must fall in price faster than silver; or
(b) Gold must rise slower in price than silver.
(2) When the prices diverge, gold price falls while silver prices rise, in order to obtain a lower GSR.
In both instances, it is much better to buy silver (and sell gold).
The GSR has been studied more than centuries. Investors trade PM based on this ratio.
Yes in PM bull trend silver always outperform gold and bear trend gold always outperform silver means drops faster than gold. Silver trade is speculative.
The ratio is indicative of credit condition in the market. When GSR rises credit is contracting and vice a versa.
If you look at the 2010-2011 chart of GSR or Silver to gold ratio you will notice how this indicator is gives warning!!!
Gold made all time high and silver made high close to 1980 high while GSR dropped to 30’s. That marked the extreme speculation in the market including commodity market.
Look at the attached chart.
Beyond any doubt SGR or GSR is the major indicator to watch. For PM I watch few other indicators.
Ichimoku Hourly Analysis — data as at 3:35 am ET today
===============================================
As mentioned in the daily post, the action is still lethargic. Prices are laying siege at the bottom of the cloud boundary, waiting for an opportunity to break into it. There is not much urgency since the tenkan-sen lies below the kijun-sen. I guess we should have to wait until prices can muster enough strength to break above the upper cloud boundary at the 1225 resistance level before any reasonable inference can be drawn.
Fabulous! Thanks Alan your posts keep us all alert. Imo with an inside day, price coasting above pivot & an upturn in MacdMA suggests a rally to possibly compromise 1226-27 before a break below 1217 is seen. Don’t think the worm has turned for the upside though. All very fluid.
Thanks Syed.
I agree with you, although I feel that price would not go as low as 1217 at the moment. I still think we are in a third of a third, although at a low degree, so the movements are not that great. But, the momentum was not sustained, and that disturbs me, casting some doubts on my wave count. I’ll have to wait for Lara to shed some light.
Ichimoku Daily Analysis — data as at the close of May 10
===============================================
Gold price broke below the bottom of the cloud yesterday, and then rallied in an attempt to re-enter the cloud. The downtrend is still very strong. The bearish pressure in the gold market seems to be steady. The price is below the tenkan-sen, kijun-sen and the upper cloud boundary, so a bullish scenario is not there yet, no, not even close by a mile. The only support that price now has is the chikou span (the dark green line) at 1218.90. The graph shows that gold is still hanging there at the bottom cloud boundary, only just. From the daily Ichimoku perspective, the only indication of an aspiring uptrend is the attempt to get back into the cloud. The intraday picture, as of now, is still woozy. I will post the intraday chart once some good action takes place. There is nothing much to show at the moment.
Let us examine the price movement. The gold market rallied to test the 1225 level yesterday, finding it resistive. It was not surprising since that area was support turned resistance. If prices can break down below 1218.76, the 23.6% of the range from 1195.22 to 1294.96, the market should then grind down to test yesterday’s low of 1214.81. If prices were to break down below there, the market should continue to go much lower and test the bigger area, the psychological 1200 level. But, if prices do break above the 1225 level, it is likely that the market will try to test the top of the previous consolidation area, which is roughly 1235 above.
From a fundamental viewpoint, unless there is a sustained reason to buy the metal either as an investment or as a safe-haven asset, it looks as if prices are likely to continue to drift sideways-to-lower over the near-term with 1198-1200 as the next major target. North Korea and the political fallout from the firing of the FBI Director have the potential to bring investors back into gold, but I’m pretty sure traders are looking for more than just headlines at this time. These are just what-ifs, chimeric and illusive, nothing concrete.
Thanks Allen for sharing your analysis on Ichimoku Cloud. It is always nice to have another arrow in your quiver
Here is his alternate for gold:
Lara, thoughts?
Very interesting.
Yes, possible. The proportions are not too… awful. Not too far off for consideration.
I’ll chart it and look in more detail.
I see they’ve finally fixed the problem of the ending diagonal.
Screenshot from an EWI video by Jeffrey Kennedy (free to the public this week)
His main gold count.
Lara, any thoughts?
That’s pretty similar to my weekly I wave count.
the difference is in how I’m seeing primary Y unfolding.
Looks like they’re seeing cycle b here as a double zigzag, where I’m seeing it as a double combination.
The difference is material. Double zigzags should have a strong slope, combinations are sideways.
Yep. We should have more clues when we know that the B wave down is over.
As Lara notes, GDX may have a breakaway gap today. If so, it won’t be filled anytime soon. The gap up did clear the downtrend channel that has been in place for the last 17 days. It looks like the bottom is in. But how high do we go?
A short term target would be the gap @ 22.92 – 23.08. How GDX reacts at that gap will be telling.
The black line shows the most bullish count; however, if GDX fails to close the gap @ 22.92 – 23.08 and continue higher, then there are more bearish options to consider.
For now, let’s see if we get some upside follow-through.
https://www.tradingview.com/x/Y3bIjQiY/