
Last analysis expected upwards movement as fairly likely. This is what has happened. Targets are the same.
Summary: GDX has a low in place and it looks increasingly like Gold does too. Targets for minor wave B are either 1,245 or 1,264, and these are equally as likely. Minor wave B may be a quick sharp zigzag or a time consuming sideways movement lasting weeks. Reasonable confidence that minor wave B has begun may only be had when price breaks above the upper edge of the best fit channel on the hourly charts.
New updates to this analysis are in bold.
Last historic analysis with monthly charts is here, video is here.
Grand SuperCycle analysis is here.
MAIN ELLIOTT WAVE COUNT
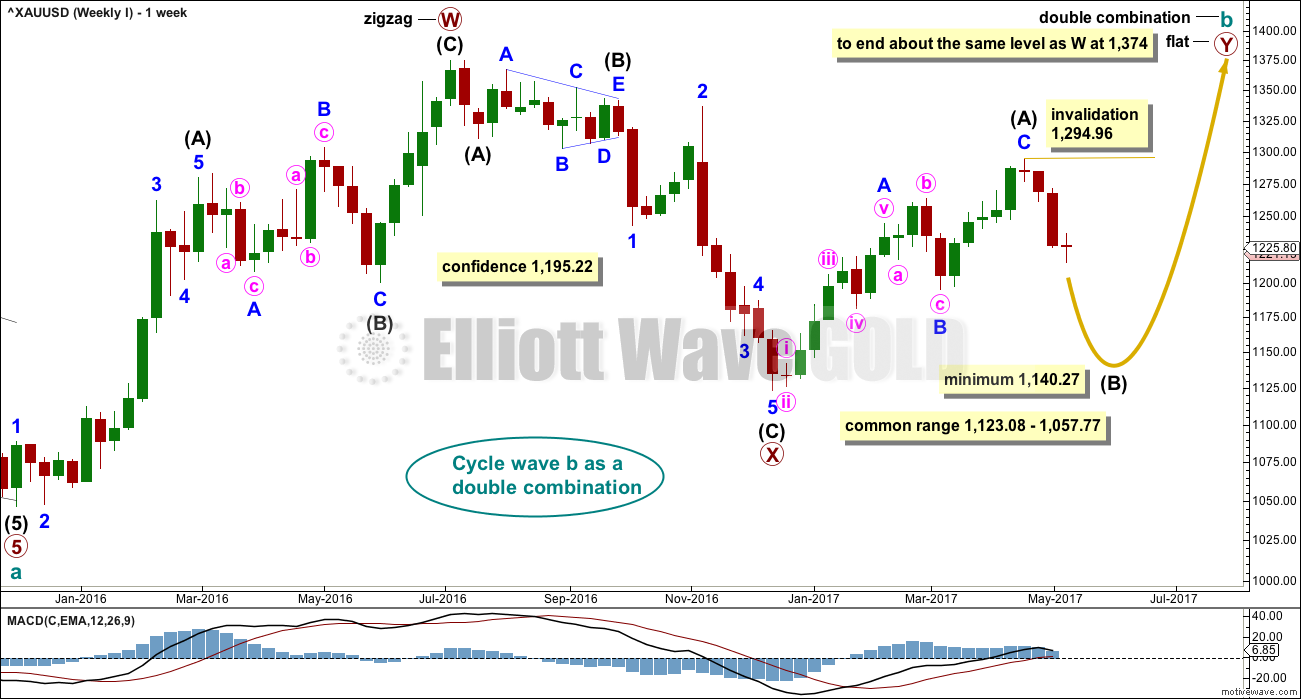
For clarity I have decided at this time it may be best to publish on a daily basis weekly charts I and II. Both charts expect a zigzag down to complete and the difference is in the expected depth.
WEEKLY CHART I
Click chart to enlarge.
Combinations are very common structures. Cycle degree waves normally last one to several years, and B waves do tend to be more time consuming waves than all other waves. Given these tendencies the most likely scenario at this point may be that cycle wave b is an incomplete double combination.
The first structure in the double labelled primary wave W fits as a zigzag. This upwards movement will subdivide as either a three (zigzag) or a five (impulse). It does have a three wave look to it.
The double is joined by a deep three in the opposite direction labelled primary wave X, which is a 0.77 depth of primary wave W. X waves within double combinations are normally very deep; this one looks right.
The second structure in the combination may be either a triangle or a flat correction. Both of these structures have A waves which subdivide as threes.
At this stage, the upwards wave from the low in December 2016 does now look best and subdivide best as a completed zigzag. This may be intermediate wave (A) of a flat correction or a triangle. Because a triangle for primary wave Y would look essentially the same as the second weekly chart below, only a flat correction is considered here. The most common two structures in a double combination are a zigzag and a flat.
This wave count follows the most common scenario and has the best fit.
Within the flat correction of primary wave Y, intermediate wave (B) must retrace a minimum 0.9 length of intermediate wave (A) at 1,140.27. The most common length for intermediate wave (B) is from 1 to 1.38 times the length of intermediate wave (A), giving a common range from 1,123.08 to 1,057.77.
Intermediate wave (B) may subdivide as any corrective structure, but the most common structure for B waves within flats is a zigzag. At this stage, on the hourly chart it looks like a five down is almost complete, which would indicate intermediate wave (B) is a zigzag subdividing 5-3-5.
The daily and hourly charts will follow this weekly chart. That does not mean the other two weekly charts aren’t possible, they are, but the number of charts must be kept reasonable on a daily basis.
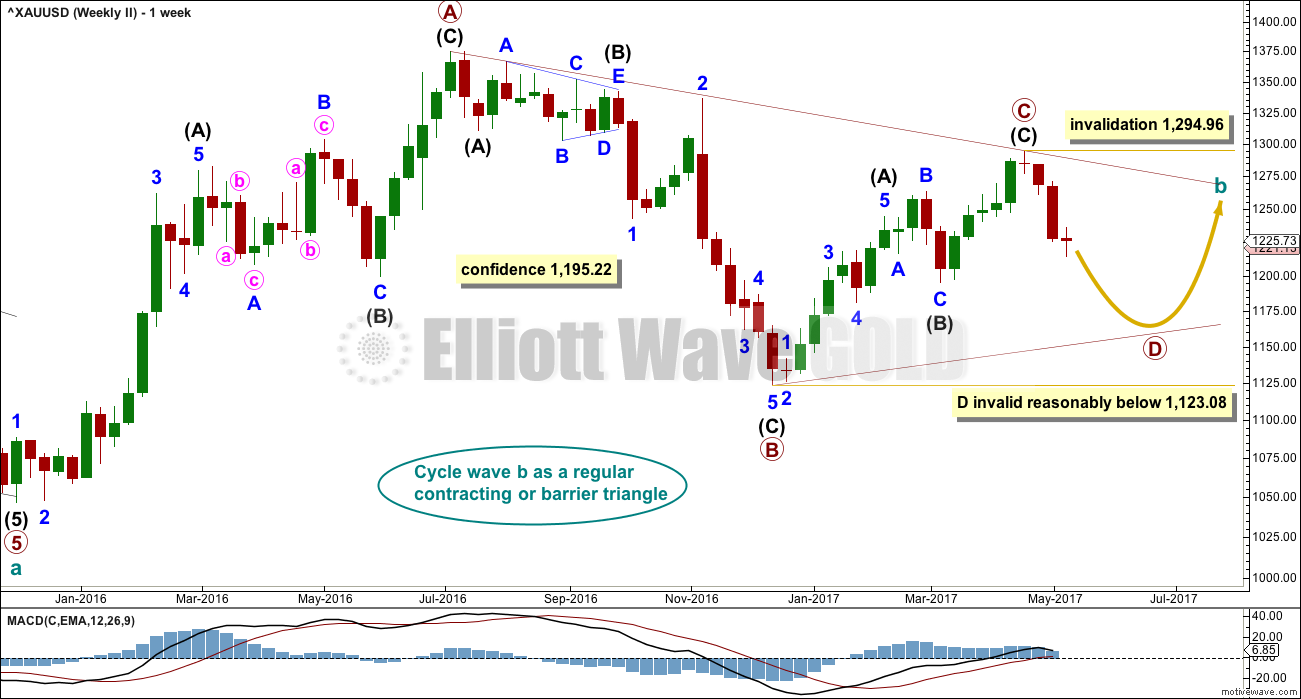
WEEKLY CHART II
Click chart to enlarge.
What if cycle wave b is a triangle? This is also entirely possible. Triangles are not as common as double combinations, but they are not uncommon.
Within the triangle, primary waves A, B and C are all single zigzags. One of the five subwaves of a triangle normally subdivides as a more complicated multiple, usually a double zigzag. This may be what is unfolding for primary wave D.
Primary wave D of a regular contracting triangle may not move beyond the end of primary wave B below 1,123.08.
Primary wave D of a regular barrier triangle should end about the same level as primary wave B at 1,123.08, so that the B-D trend line is essentially flat. What this means in practice is that primary wave D may end slightly below 1,123.08 and the triangle would remain valid. This is the only Elliott wave rule which is not black and white.
Thereafter, primary wave E should unfold upwards and would most likely fall a little short of the A-C trend line. If not ending there, it may overshoot the A-C trend line.
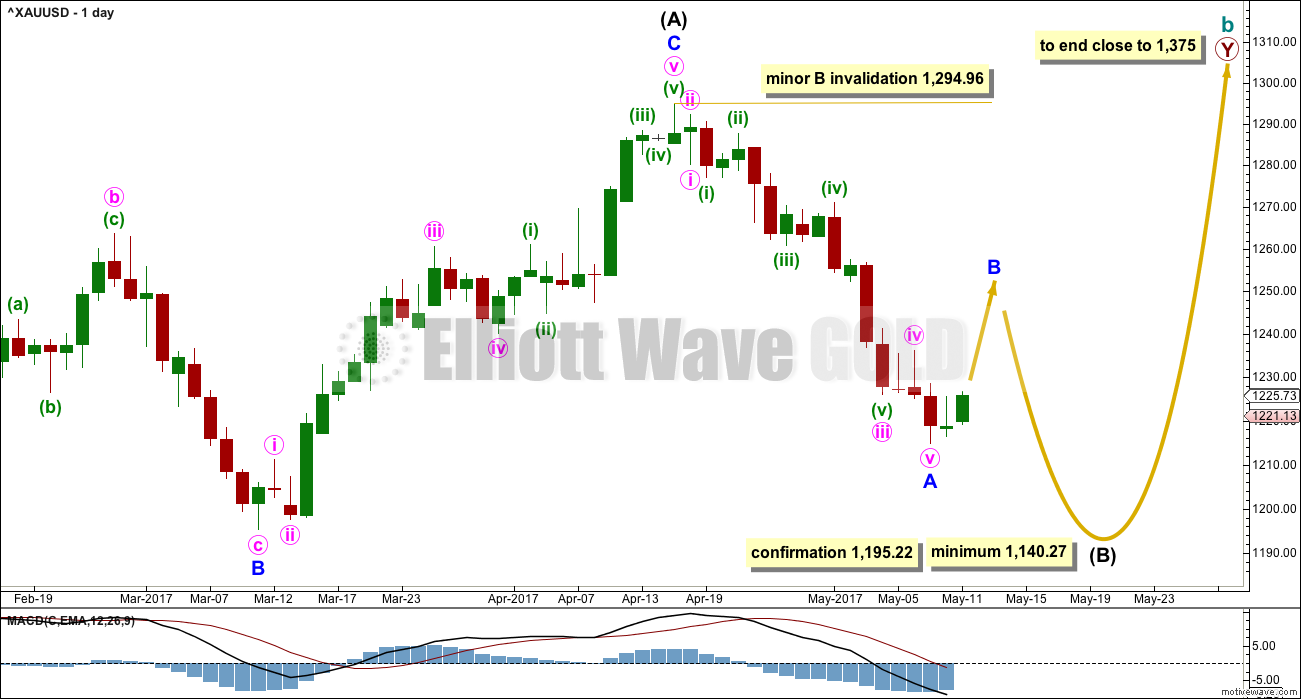
DAILY CHART
Click chart to enlarge.
This daily chart will suffice for both weekly charts above, although the labelling follows weekly chart I.
Both weekly charts expect a zigzag downwards. Weekly chart I expects a deep zigzag for intermediate wave (B) to a minimum at 1,140.27. Weekly chart II expects a zigzag down for primary wave D to not move below 1,123.08 and most likely fall well short of that point.
The daily chart follows the expectations for weekly chart I, but the structure for weekly chart II would be exactly the same.
Within the flat correction of primary wave Y, intermediate wave (B) must retrace a minimum 0.9 length of intermediate wave (A) at 1,140.27. The most likely corrective structures to achieve the deep correction required for B waves within flats are single or multiple zigzags. These begin with a five, then a three in the opposite direction. A five down for minor wave A may be complete. Minor wave B may have begun.
BarChart data shows a Morning Doji Star reversal pattern at the end of minor wave A. This pattern is not the strongest reversal pattern, but it is fairly reliable after a clear downwards trend. This indicates the downwards trend may end here and be followed by either sideways or upwards movement. Reversal patterns make no comment on how far nor how long the next trend may last.
Minor wave B may be deep but may not move beyond the start of minor wave A above 1,294.96.
B waves exhibit the greatest variety in form and behaviour of all waves. They can be quick sharp zigzags or complicated time consuming combinations. There are more than 23 possible corrective Elliott wave structures that B waves may take, and at their start it is impossible to tell which structure may unfold. B waves do not normally present good trading opportunities; they can be time consuming consolidations with strong whipsaws. However, minor degree B waves may present some opportunity, so it is essential when they unfold that risk is managed diligently. The risk of losses is greater during consolidations than during trending markets.
When minor waves A and B are complete, then a target may be calculated for minor wave C downwards to end the zigzag of intermediate wave (B), using the Fibonacci ratio between minor waves A and C. That cannot be done yet.
2 HOURLY CHART
Click chart to enlarge.
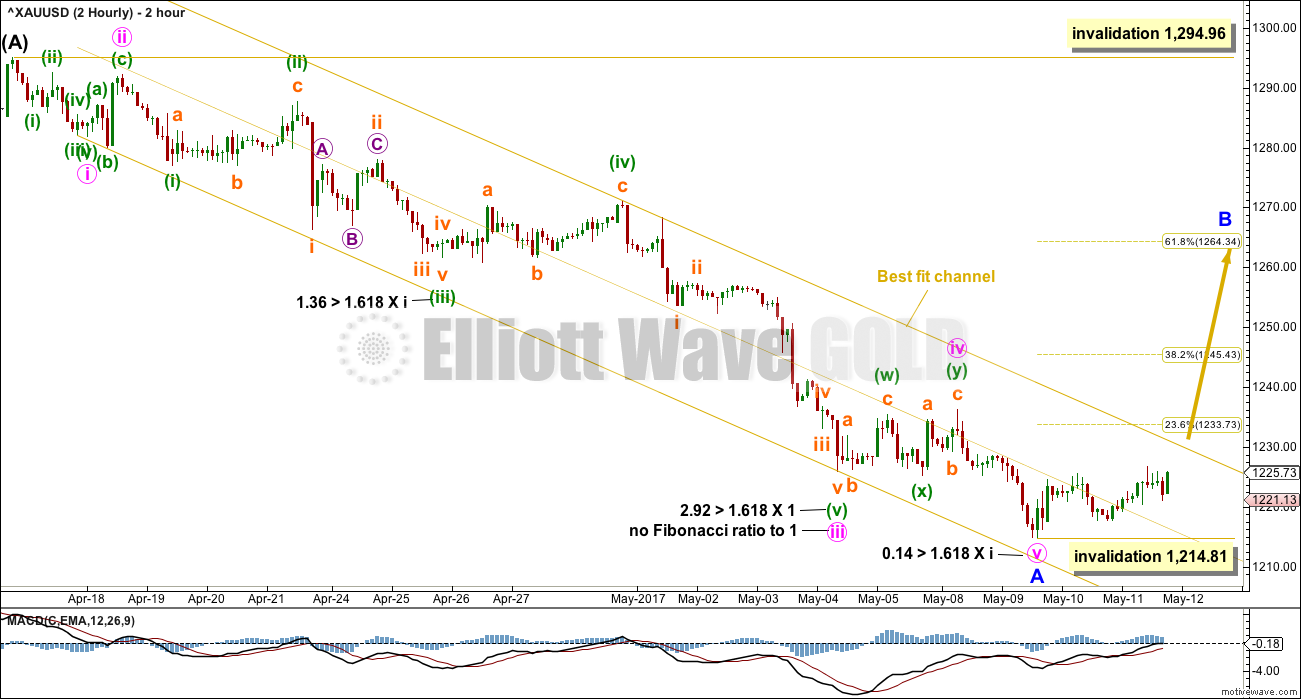
Minor wave A may now be complete. There would be now a Fibonacci ratio between minute waves v and i.
Price is now within the upper half of the best fit channel, for the first time in a few days. This is the earliest indication that a low may be in place. Further confidence may be had if price breaks above the upper edge of the channel. Before that happens though expect some resistance at that trend line.
If minor wave B has begun here, then the 0.382 Fibonacci ratio at 1,245 and the 0.618 Fibonacci ratio at 1,264 would be targets. Neither of these ratios can be favoured; B waves exhibit huge variety.
If minor wave A is correctly labelled as a five wave impulse, then minor wave B may not make a new high above the start of minor wave A, at 1,294.96.
Minor degree waves normally last weeks. If minor wave A is complete here, then it would have lasted 3 weeks (16 sessions). Minor wave B may be reasonably expected to be about the same duration of three weeks.
At the hourly chart level, the first movement for a minor degree wave should be a five wave structure upwards. That would be still incomplete, so while it is unfolding no second wave correction may move beyond its start below 1,214.81.
HOURLY CHART
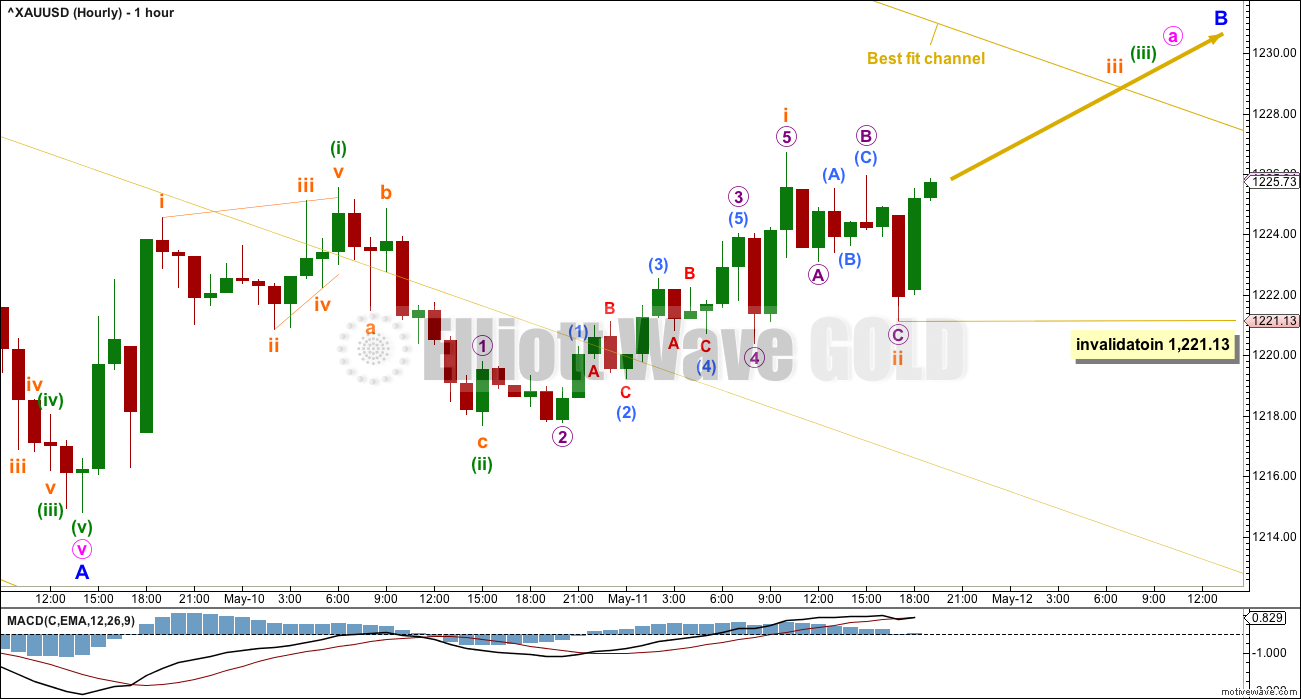
Click chart to enlarge.
If minor wave B has begun, then it needs to complete a five up at the hourly chart level. So far that looks incomplete; what is currently labelled minuette wave (i) is too short for that expectation.
So far there may be two overlapping first and second waves complete. Within subminuette wave iii, no second wave correction may move beyond the start of its first wave below 1,221.13.
B waves exhibit great variety in structure. As this one unfolds the labelling within it will change and alternate wave counts for minor wave B will be required. It is impossible to tell at the start what structure it will be, and usually the structure is not clear until right at the end. Patience and flexibility are essential when analysing B waves.
Members are advised in the strongest possible terms to be diligent about managing risk if choosing to trade this B wave. Accept the risk of trading a correction (be prepared for losses) and manage risk to protect your account, so it is crucial that stops are used. Also, take profits more quickly than usual.
This B wave may be an easy sharp upwards movement lasting only a week or so, or equally as likely it may be a big sideways consolidation with strong whipsaws lasting a few weeks.
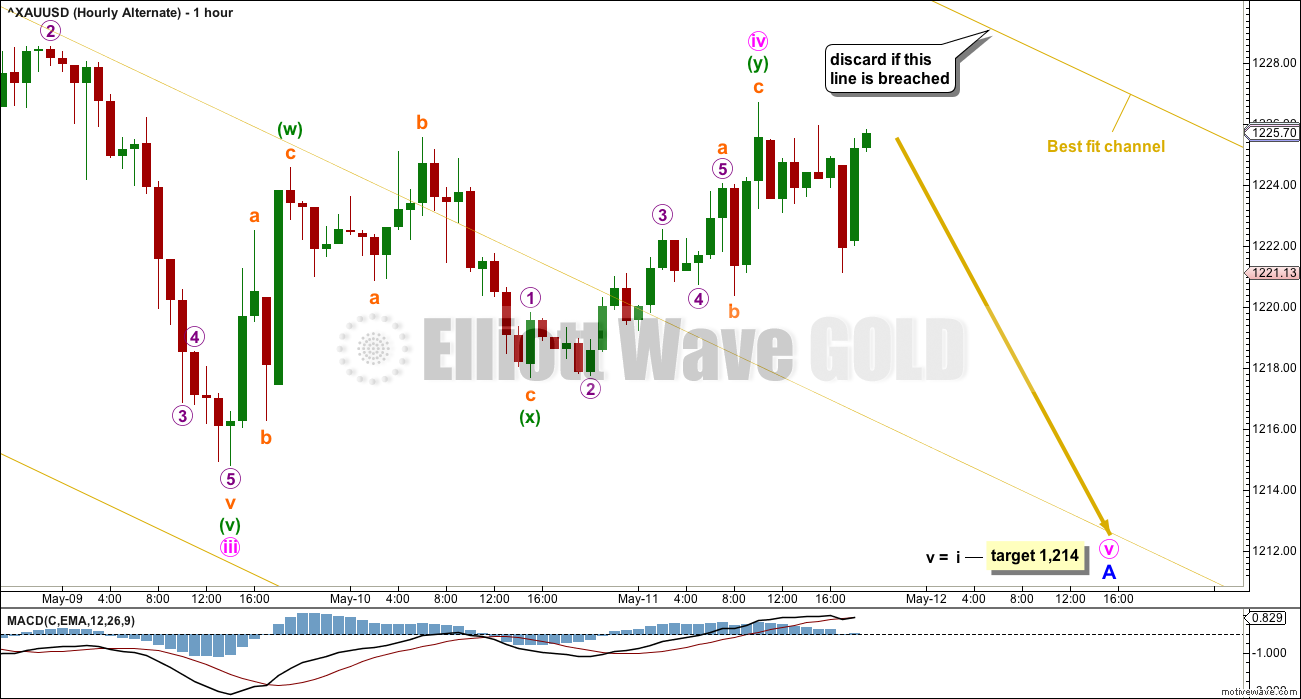
ALTERNATE HOURLY CHART
Click chart to enlarge.
This alternate idea today looks fairly unlikely, but all possibilities should be considered.
What if minor wave A is not over yet? What if only minute wave iv ended at today’s high?
Minute wave iv here is labelled as a double zigzag, but the second zigzag in the double barely deepens the correction. This is technically possible but does not have the right look.
If minute wave iv has just ended and minute wave v has begun, then a new target is calculated for it to end.
If the upper edge of the best fit channel is breached, then this alternate and any other which sees minor wave A as incomplete will be discarded based upon a very low probability.
TECHNICAL ANALYSIS
WEEKLY CHART
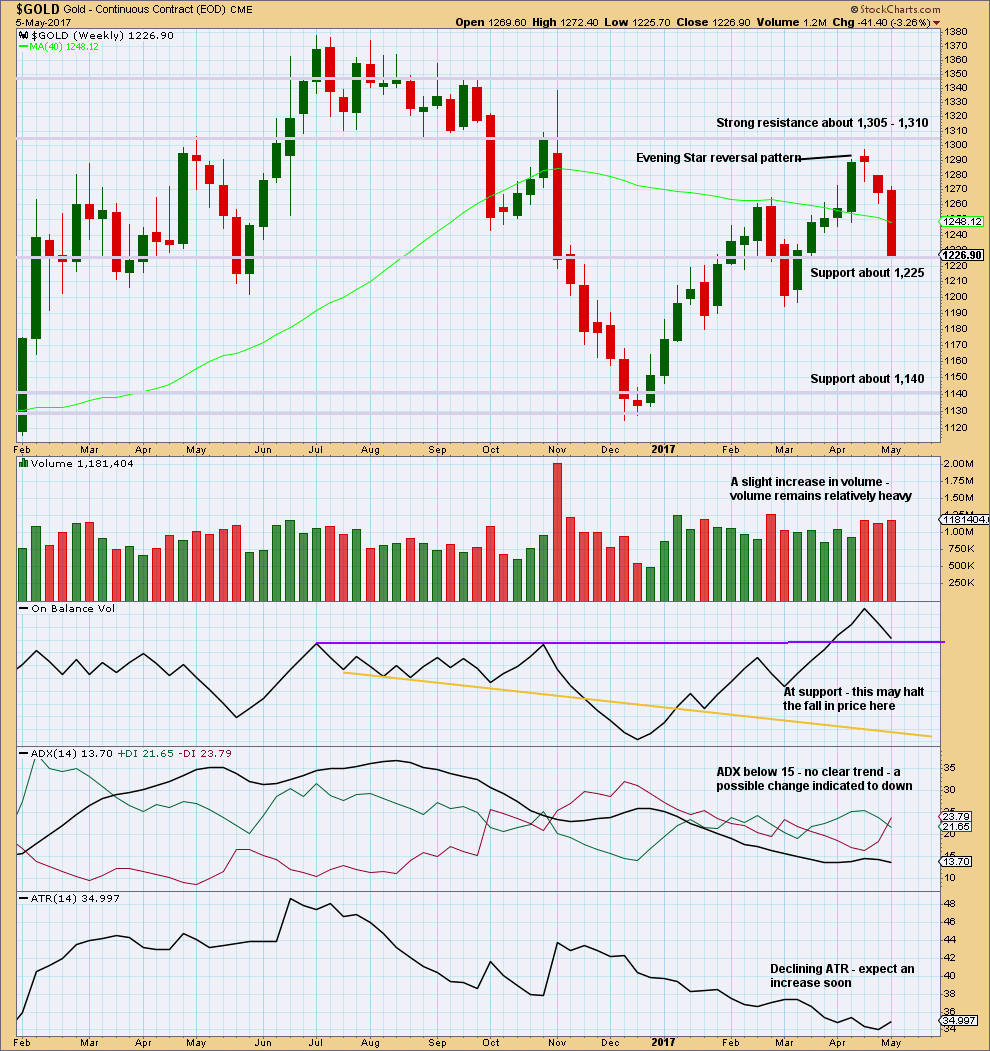
Click chart to enlarge. Chart courtesy of StockCharts.com.
This weekly chart now looks bearish. Volume is bearish. The strong weekly candlestick looks very bearish.
Support for price and On Balance Volume may halt the fall in price temporarily, a bounce about here looks like a very reasonable expectation.
DAILY CHART
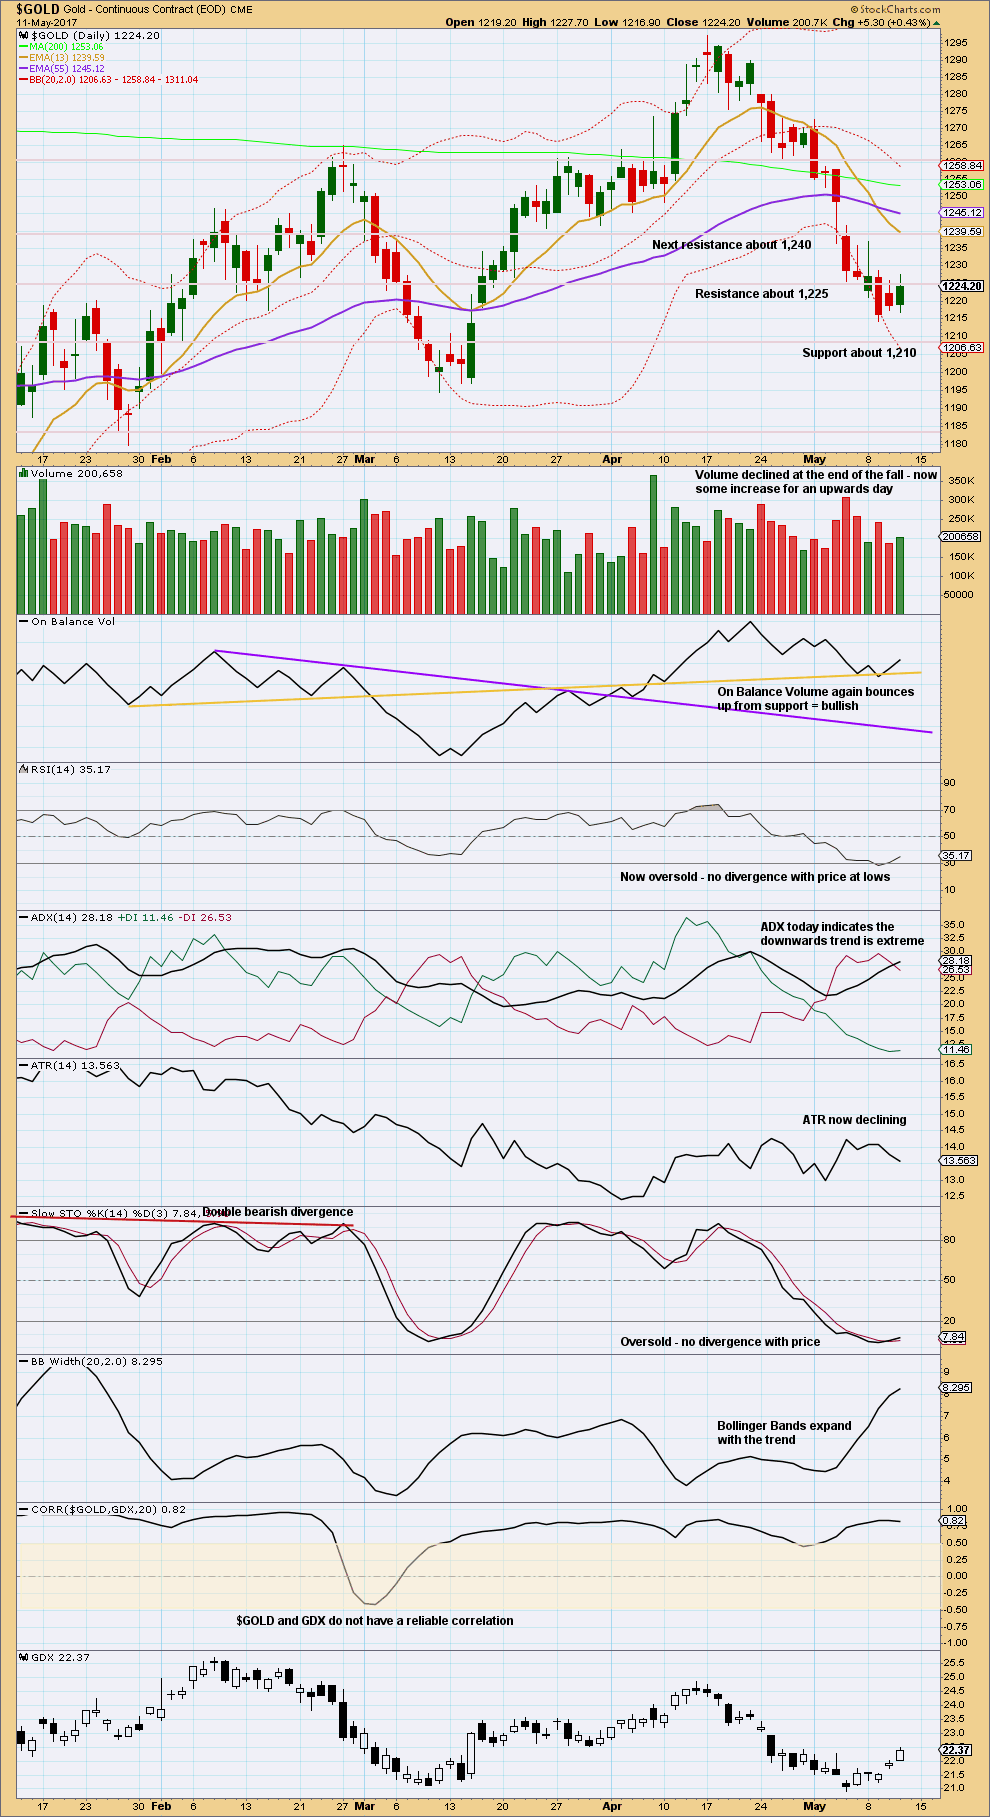
Click chart to enlarge. Chart courtesy of StockCharts.com.
Yesterday’s candlestick completes a Harami reversal pattern. This is not a strong reversal pattern though, so further confirmation would be required for confidence that a low is in place. Today’s green daily candlestick provides nice confirmation of the reversal pattern.
On Balance Volume is bullish (give this indicator significant weight) and it offers good support to the main hourly Elliott wave count.
It is reasonable to expect a bounce here with ADX now at extreme level.
Volume is bullish. It looks like RSI is returning from oversold and Stochastics may be turning up to also return from oversold.
GDX
DAILY CHART
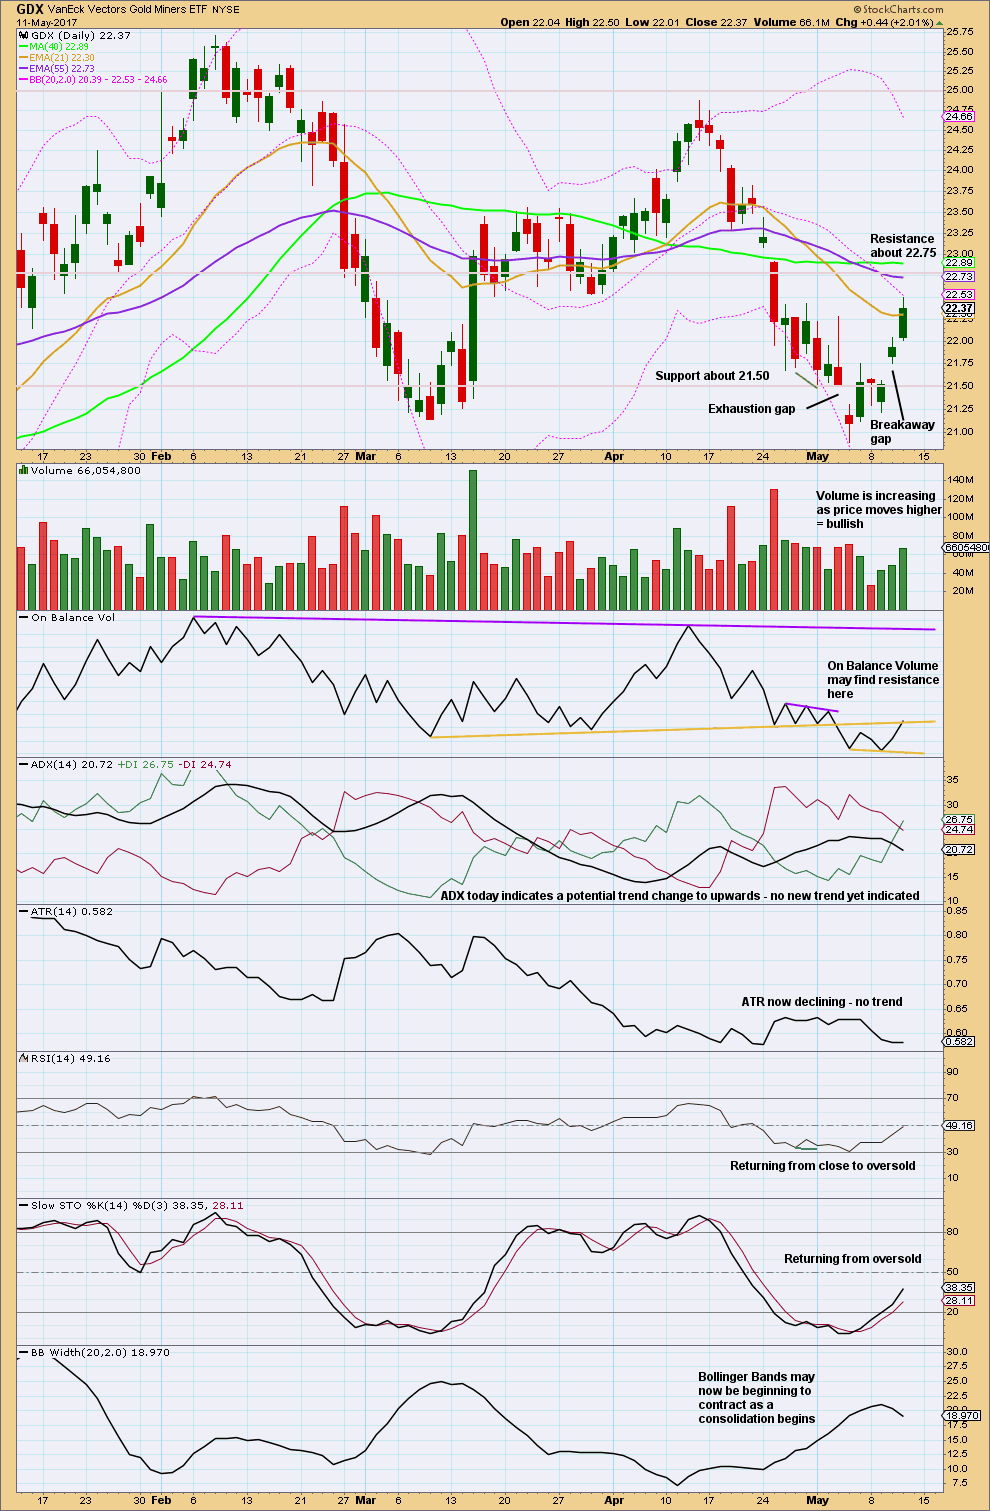
Click chart to enlarge. Chart courtesy of StockCharts.com.
Price is very bullish. It has good support from volume.
On Balance Volume may find resistance here, but it looks like it may be beginning to break above resistance. If it does, that would be a strong bullish signal. If it turns down here, that would be a bearish signal.
With ADX declining, Bollinger Bands contracting, and ATR declining, it looks like this upwards movement is a bounce within a larger downwards trend.
If trading this upwards movement, it is essential that stops are used and risk is managed. This looks like a counter trend movement, albeit one which may last more than a week. Look for the upwards movement in price to possibly end when Stochastics reaches overbought.
This analysis is published @ 08:37 p.m. EST.
Thanks Dreamer, Syed and Alan
For all your comments.
Lara, I would welcome your or anyone else’s views on a dilemma I have.
I tend to lose quite a lot of money by closing my positions before the weekend. I do that because I am afraid their may be a huge spike at the open on the Re-open of markets on Sunday night which would render my stop loss useless ( I gather that if a pair gaps up or down then the broker cannot necessarily operate the stop).
I would welcome any advice you can give on this issue. Perhaps I will just have to wait until my account is big enough to absorb any large losses.
Hey Nick, when I open a position, I generally have an exit strategy (target) at that time. If the price behavior of my position is behaving as expected and moving toward my target, the EW count supports the target, and TA looks good, then I have no issues holding over the weekend. If price action is not behaving as expected, then I would be a little more cautious going into the weekend.
I can’t tell by your wording if you are actually losing money or just “missing” an opportunity for more profit? A winning trade is always good.
A smaller position size may also alleviate some anxiety. GL
Hi Nick! Always a tough one of what to do with ones trades going in to the weekend. It’s down to risk appetite lol…. Where I am at, at the end of the week, all limits (Buy/Sell/SL) automatically get deleted by my brokers system leaving me with Open Positions. This can be dangerous if the market spikes up or down on the open on Monday and goes against ones position. Often its better to close ones positions by 13.30 NY Time on any given day of the week and start all over the next day 🙂 …. Currently Gold price appears to be finding legs (support) just at or above 100dma (1226.64) with downside risk the days low. On Thursday after a spike up to 1226-27 Gold price found support at around 1223-22 and took on 123x to have now fallen back to 1227-26. Imo Gold price has got a little bottomy here, an upturn in MacdMA suggests a rally. Keeping it long for a break above Friday high with a stop at 1224 or just below Friday low. GL and have a fine day!
Nick, please read my response in Lara’s May 12 update.
Speculators lopped off 42 k long contracts on gold, while commercials removed about the same in short positions. This is bullish at least short term. The silver story is even better with specs net pos about 54 k contracts after being about 70k last week. To put in perspective the last silver low had about 60k Long on the spec side. So we are higher here at 16.5 and have less longs. Plenty of room for longs to add.
First / main hourly chart updated:
It’s now possible that the middle of minute a has passed. When the next five up is complete that would complete minuette waves (i)-(ii)-(iii).
And then that’s where it starts to get tricky. Because 1-2-3 of an impulse subdivides exactly the same as A-B-C of a zigzag.
Minute a may be a zigzag, a three wave structure, if minor wave B is to unfold as a flat or triangle.
So once the next five up is complete then I’ll have alternate ideas for minor B. And we can have absolutely no confidence in exactly how it’s going to move, because I can not know for sure which of any one of 23 possible structures it may take.
I’m fascinated by how bearish sentiment is. After a third day of gapping up at the open, I read an analyst who has dubbed today’s GDX gap an exhaustion gap. Successive gaps generally occur at the beginning, and at the end of bullish runs….
I would have thought the correct approach to a gap like that would be to assume it’s a measuring gap, and only expect it’s an exhaustion gap once it’s closed.
Particularly for a small move.
Ichimoku Hourly Analysis — data as at 3:05 am ET today
===============================================
In the near short-term, the picture is more rosy. The tenkan-sen crossed the kijun-sen from below, signifying a return to bullishness. Prices are trading above the cloud, but do note that the red-coloured nature of the cloud mars this idealistic scene. Coupled with the caution given in the longer-term daily view, enthusiasm in the market is ill-advised. Rise it would as some pent-up buying needed to unwind. This is evidenced by the RSI moving from oversold territory below 30, to neutral territory at 35, reflecting accelerating positive momentum, and is considered a buy signal. The MACD histogram moving higher lends credence to this move as it also reflects accelerating positive momentum. But, the overall picture is more bleak. This seeming return to strength in the market is the result of price moving in a third of a third wave. When this is over, the market ought to become more subdued. And, traders would again cry foul, that somewhere somehow they have been short changed.
Looks like the move above the hourly cloud helped to accelerate the move up. Nice. That said, the reality of the rising cloud resistance on the daily will be a challenge. 🤔 Interesting how the top of the daily cloud in early June is just above the higher 1,264 EW target…
Thanks Alan for your consistent sharing!
Alan
Thanks for keeping us updated in intraday period. I notice 6 hour period gold is just below the red cloud at $1234.
That may be the resistance.
In the mean time GSR is dropping after a backtest of the breakdown from a triangle I posted yesterday.
You are correct, Papudi.
In the 4-hour chart, gold is finding strong resistance at the bottom of the cloud. This is the resistance cluster I had been referring to. Price has to overcome this resistance in order to gain access into the cloud. The next resistance is the 1245 price point at the top boundary of the cloud. Isn’t it wonderful that Ichimoku analysis and classical price analysis both lead to the same conclusion?
Ichimoku Daily Analysis — data as at the close of May 11
===============================================
Gold price is still straddling the bottom of the cloud. The cloud is still green indicating the general feeling is one of bullishness, but only weakly so. That the tenkan-sen lies below the kijun-sen warns that the bull is going to struggle. This is not a time for euphoria. This is the time to trade with caution. This is the time to lower our expectations. This is the B wave, notorious for dealing out sucker punches. Make no mistake about it: this is a period of consolidation.
Gold markets rallied during the session yesterday, and even managed to break above the 1225 level, an area that has been resistive recently. I believe that a short-term rally makes sense, but the resistance cluster at 1235-1237 presents a formidable barrier, especially the 10-day moving average at 1236. If gold manages to clear the resistance cluster, then it has to negotiate 1245. Only if it manages to do so will it attempt an attack on 1264. Given the many obstacles in its way, it will only be a matter of time before exhaustion returns to the marketplace, and if it does, this should signal that we would continue the downtrend, in the form of Minor C.
On a fundamental level, the market is being supported by a weaker US Dollar and capped by the prospect of a US rate hike in June. There are still too many bears in the market. Negative opinions on gold are starting to pile up since we do not have a care in the world right now with the easing of geopolitical tensions. Most investors cite receding risk aversion and the Fed rate hike as the main reasons why gold is likely to remain under pressure. Many are still focused on the 1200 level, unless of course there is some type of headline shock from around the world, there being some undercurrents stirring geopolitically which could scare the markets.
Thank you very much for sharing your analysis Alan. And it’s nice to see your general idea agrees with mine; a bounce, yes, but caution.
That adds a bit of confidence to the short term outlook.
GDX had a nice follow-through to the upside today. Looking at the hourly chart, tomorrow may be a sideways day and then I think we get one more push up to the GAP range before a bigger correction. The correction will likely go back down to the lower channel trendline or possibly below it once again.
https://www.tradingview.com/x/cGwCdW7i/
Good analysis, Dreamer.
My work on NUGT also indicates a near-term top, but should traders somehow get too carried away by the frenzy over a rise in price, then the alternative scenario of a breakaway can come to pass.
With signs of life in the miners, here’s a look at the GDXJ to GDX ratio. For the last 3 days and the first time in quite a while, GDXJ has outperformed GDX. This is a positive sign, but there’s resistance ahead.
A break above resistance in the coming week would be very positive for the miners.
I completely agree with your conclusion Dreamer.
Positive signs BUT caution ahead 🙂