
Upwards movement has continued as expected. With some structure now to analyse, targets can be calculated.
Summary: A bounce has begun. It looks like a counter trend movement. Be diligent with risk management if trading this movement upwards. The target for Monday / Tuesday is 1,235 – 1,236.
New updates to this analysis are in bold.
Last historic analysis with monthly charts is here, video is here.
Grand SuperCycle analysis is here.
MAIN ELLIOTT WAVE COUNT
For clarity I have decided at this time it may be best to publish on a daily basis weekly charts I and II. Both charts expect a zigzag down to complete and the difference is in the expected depth.
WEEKLY CHART I
Click chart to enlarge.
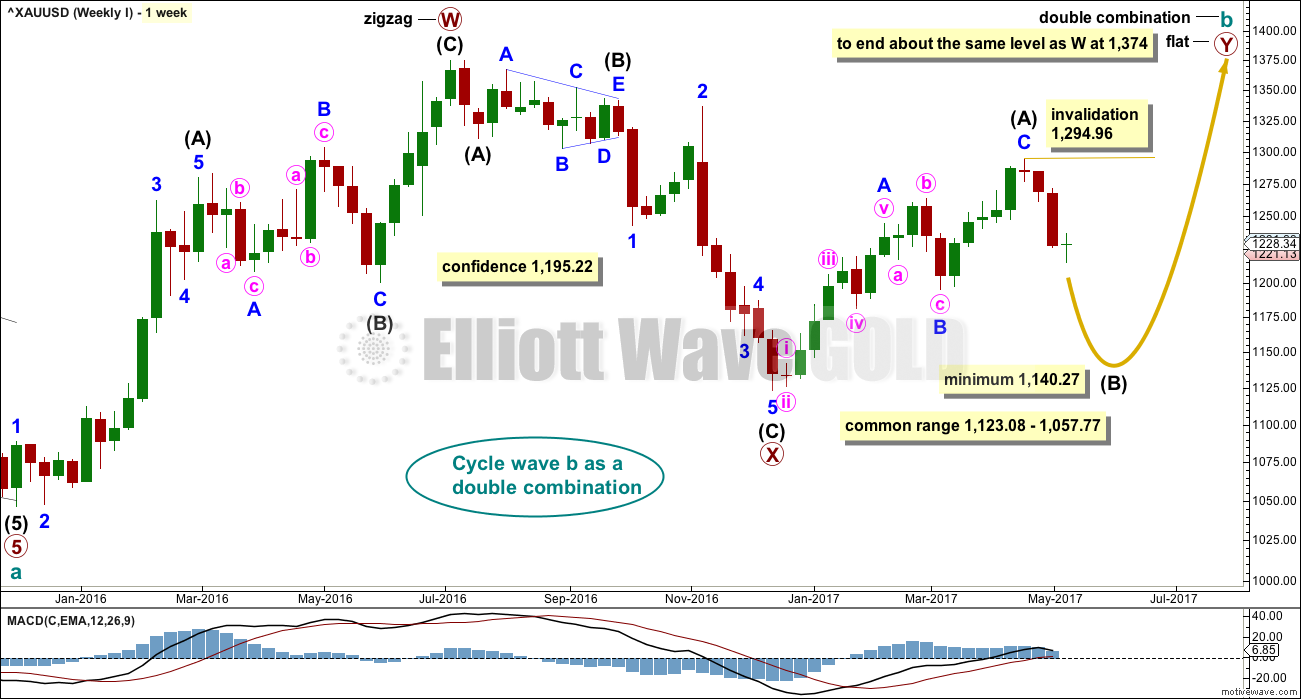
Combinations are very common structures. Cycle degree waves normally last one to several years, and B waves do tend to be more time consuming waves than all other waves. Given these tendencies the most likely scenario at this point may be that cycle wave b is an incomplete double combination.
The first structure in the double labelled primary wave W fits as a zigzag. This upwards movement will subdivide as either a three (zigzag) or a five (impulse). It does have a three wave look to it.
The double is joined by a deep three in the opposite direction labelled primary wave X, which is a 0.77 depth of primary wave W. X waves within double combinations are normally very deep; this one looks right.
The second structure in the combination may be either a triangle or a flat correction. Both of these structures have A waves which subdivide as threes.
At this stage, the upwards wave from the low in December 2016 does now look best and subdivide best as a completed zigzag. This may be intermediate wave (A) of a flat correction or a triangle. Because a triangle for primary wave Y would look essentially the same as the second weekly chart below, only a flat correction is considered here. The most common two structures in a double combination are a zigzag and a flat.
This wave count follows the most common scenario and has the best fit.
Within the flat correction of primary wave Y, intermediate wave (B) must retrace a minimum 0.9 length of intermediate wave (A) at 1,140.27. The most common length for intermediate wave (B) is from 1 to 1.38 times the length of intermediate wave (A), giving a common range from 1,123.08 to 1,057.77.
Intermediate wave (B) may subdivide as any corrective structure, but the most common structure for B waves within flats is a zigzag. At this stage, on the hourly chart it looks like a five down is now complete, which would indicate intermediate wave (B) is a zigzag subdividing 5-3-5.
The daily and hourly charts will follow this weekly chart. That does not mean the other two weekly charts aren’t possible, they are, but the number of charts must be kept reasonable on a daily basis.
WEEKLY CHART II
Click chart to enlarge.
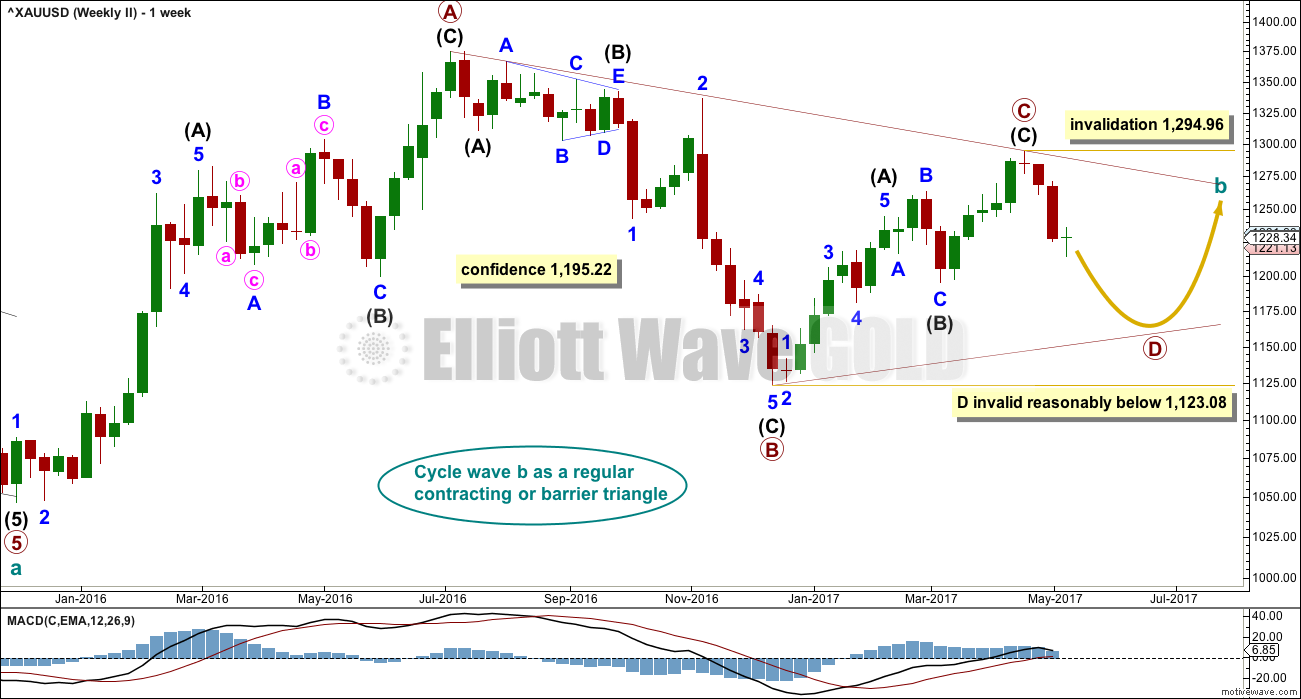
What if cycle wave b is a triangle? This is also entirely possible. Triangles are not as common as double combinations, but they are not uncommon.
Within the triangle, primary waves A, B and C are all single zigzags. One of the five subwaves of a triangle normally subdivides as a more complicated multiple, usually a double zigzag. This may be what is unfolding for primary wave D.
Primary wave D of a regular contracting triangle may not move beyond the end of primary wave B below 1,123.08.
Primary wave D of a regular barrier triangle should end about the same level as primary wave B at 1,123.08, so that the B-D trend line is essentially flat. What this means in practice is that primary wave D may end slightly below 1,123.08 and the triangle would remain valid. This is the only Elliott wave rule which is not black and white.
Thereafter, primary wave E should unfold upwards and would most likely fall a little short of the A-C trend line. If not ending there, it may overshoot the A-C trend line.
DAILY CHART
Click chart to enlarge.
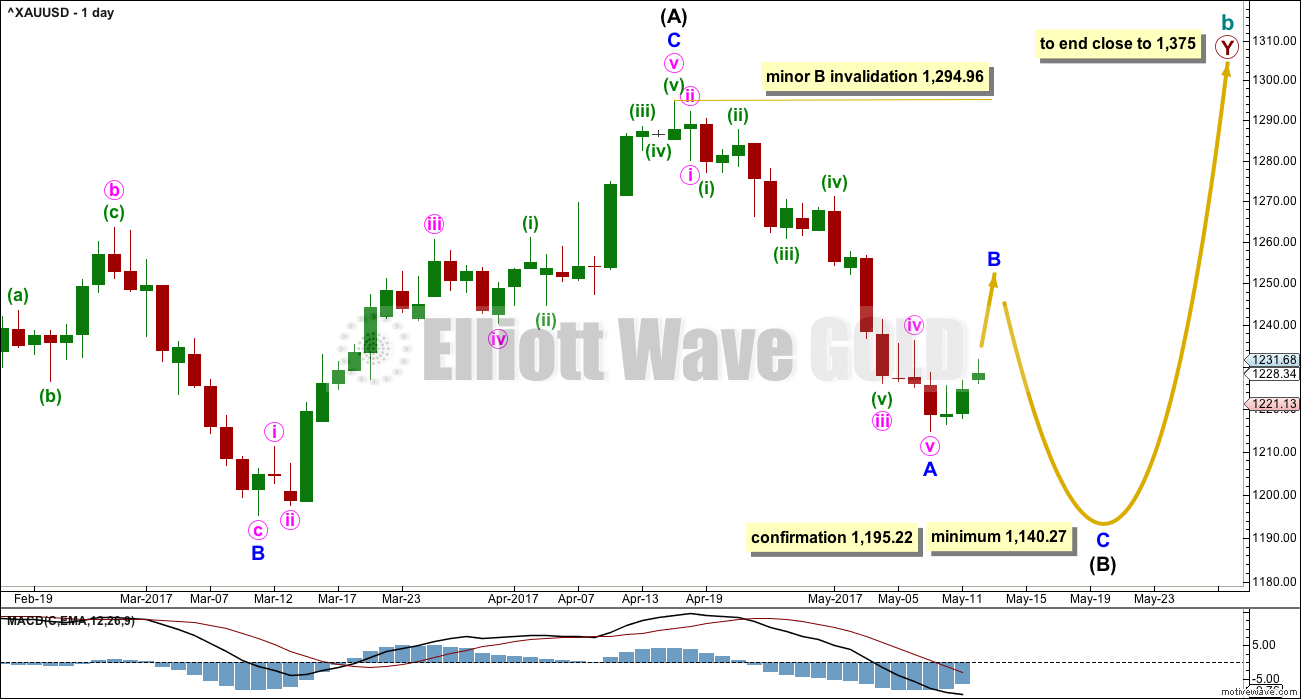
This daily chart will suffice for both weekly charts above, although the labelling follows weekly chart I.
Both weekly charts expect a zigzag downwards. Weekly chart I expects a deep zigzag for intermediate wave (B) to a minimum at 1,140.27. Weekly chart II expects a zigzag down for primary wave D to not move below 1,123.08 and most likely fall well short of that point.
The daily chart follows the expectations for weekly chart I, but the structure for weekly chart II would be exactly the same.
Within the flat correction of primary wave Y, intermediate wave (B) must retrace a minimum 0.9 length of intermediate wave (A) at 1,140.27. The most likely corrective structures to achieve the deep correction required for B waves within flats are single or multiple zigzags. These begin with a five, then a three in the opposite direction. A five down for minor wave A may be complete. Minor wave B may have begun.
BarChart data shows a Morning Doji Star reversal pattern at the end of minor wave A. This pattern is not the strongest reversal pattern, but it is fairly reliable after a clear downwards trend. This indicates the downwards trend may end here and be followed by either sideways or upwards movement. Reversal patterns make no comment on how far nor how long the next trend may last.
Minor wave B may be deep but may not move beyond the start of minor wave A above 1,294.96.
B waves exhibit the greatest variety in form and behaviour of all waves. They can be quick sharp zigzags or complicated time consuming combinations. There are more than 23 possible corrective Elliott wave structures that B waves may take, and at their start it is impossible to tell which structure may unfold. B waves do not normally present good trading opportunities; they can be time consuming consolidations with strong whipsaws. However, minor degree B waves may present some opportunity, so it is essential when they unfold that risk is managed diligently. The risk of losses is greater during consolidations than during trending markets.
When minor waves A and B are complete, then a target may be calculated for minor wave C downwards to end the zigzag of intermediate wave (B), using the Fibonacci ratio between minor waves A and C. That cannot be done yet.
HOURLY CHART
Click chart to enlarge.
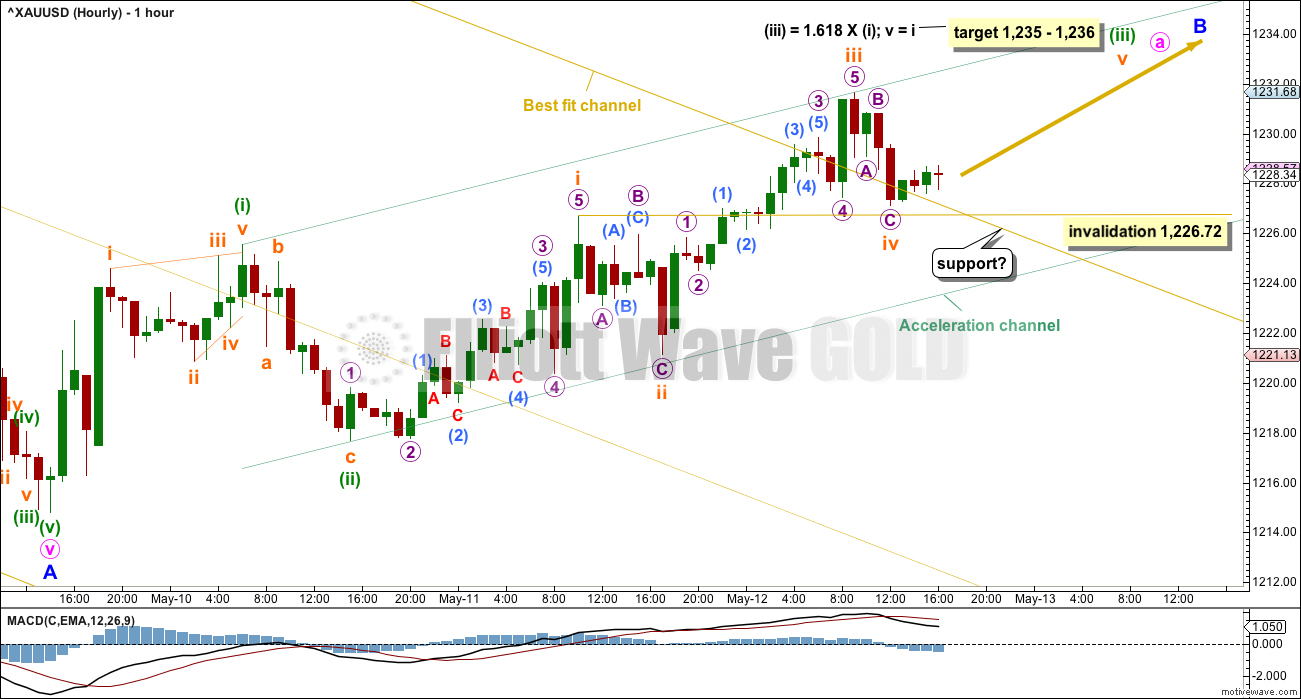
Minor wave B may be any one of more than 23 possible corrective structures.
So far a small five up is complete, labelled minuette wave (i) and that was followed by a three down labelled minuette wave (ii). Now another five up is incomplete, labelled minuette wave (iii).
If minor wave B is unfolding as a zigzag (or multiple zigzag), then minute wave a within it would be an impulse and would be incomplete.
If minor wave B is unfolding as a flat or triangle, then minute wave a within it would most likely be a zigzag and would be incomplete.
A-B-C of a zigzag subdivides 5-3-5, exactly the same as 1-2-3 of an impulse. When the next five up labelled minuette wave (iii) is complete, then alternate wave counts for the hourly chart will be required. At that stage, it would become impossible to predict the next short term movement with any accuracy as it is impossible to tell which structure minor wave B may take.
An acceleration channel is added to this upwards movement. Keep redrawing the channel as price makes new highs: the first trend line from the end of minuette wave (i) to the latest high, then a copy on the end of minuette wave (ii). When minuette wave (iii) is complete, the channel would be an Elliott channel about an impulse.
A target, which is only a $1 zone, is calculated at two degrees and has a reasonable probability.
In the short term, when markets open on Monday, subminuette wave iv may not move into subminuette wave i price territory below 1,226.72 if it continues any further.
TECHNICAL ANALYSIS
WEEKLY CHART
Click chart to enlarge. Chart courtesy of StockCharts.com.
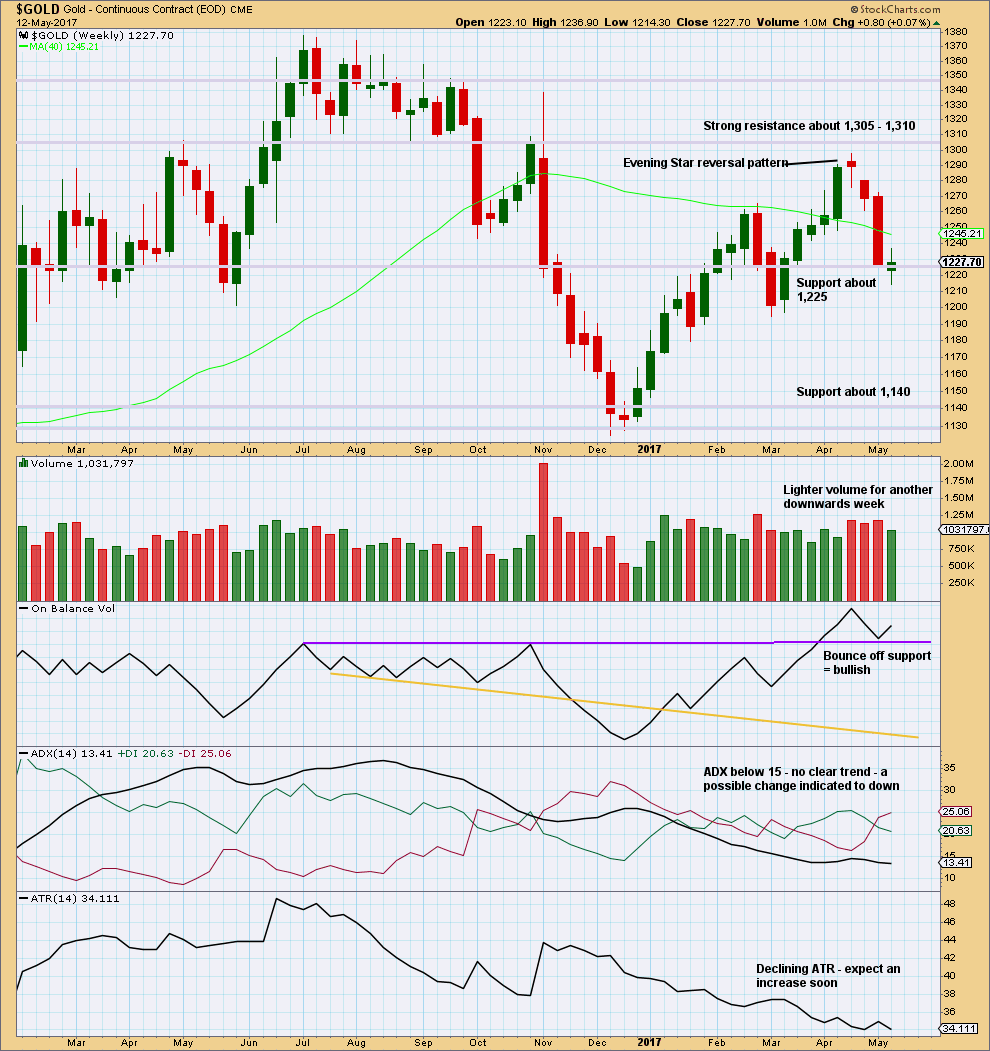
Another downwards week closes green with a small real body. This is a spinning top candlestick that shifts the trend from down to neutral.
The balance of volume is upwards and shows a decline. Upwards movement may be a counter trend movement if it does not have support from volume.
The bullish signal from On Balance Volume suggests next week may see upwards movement.
DAILY CHART
Click chart to enlarge. Chart courtesy of StockCharts.com.
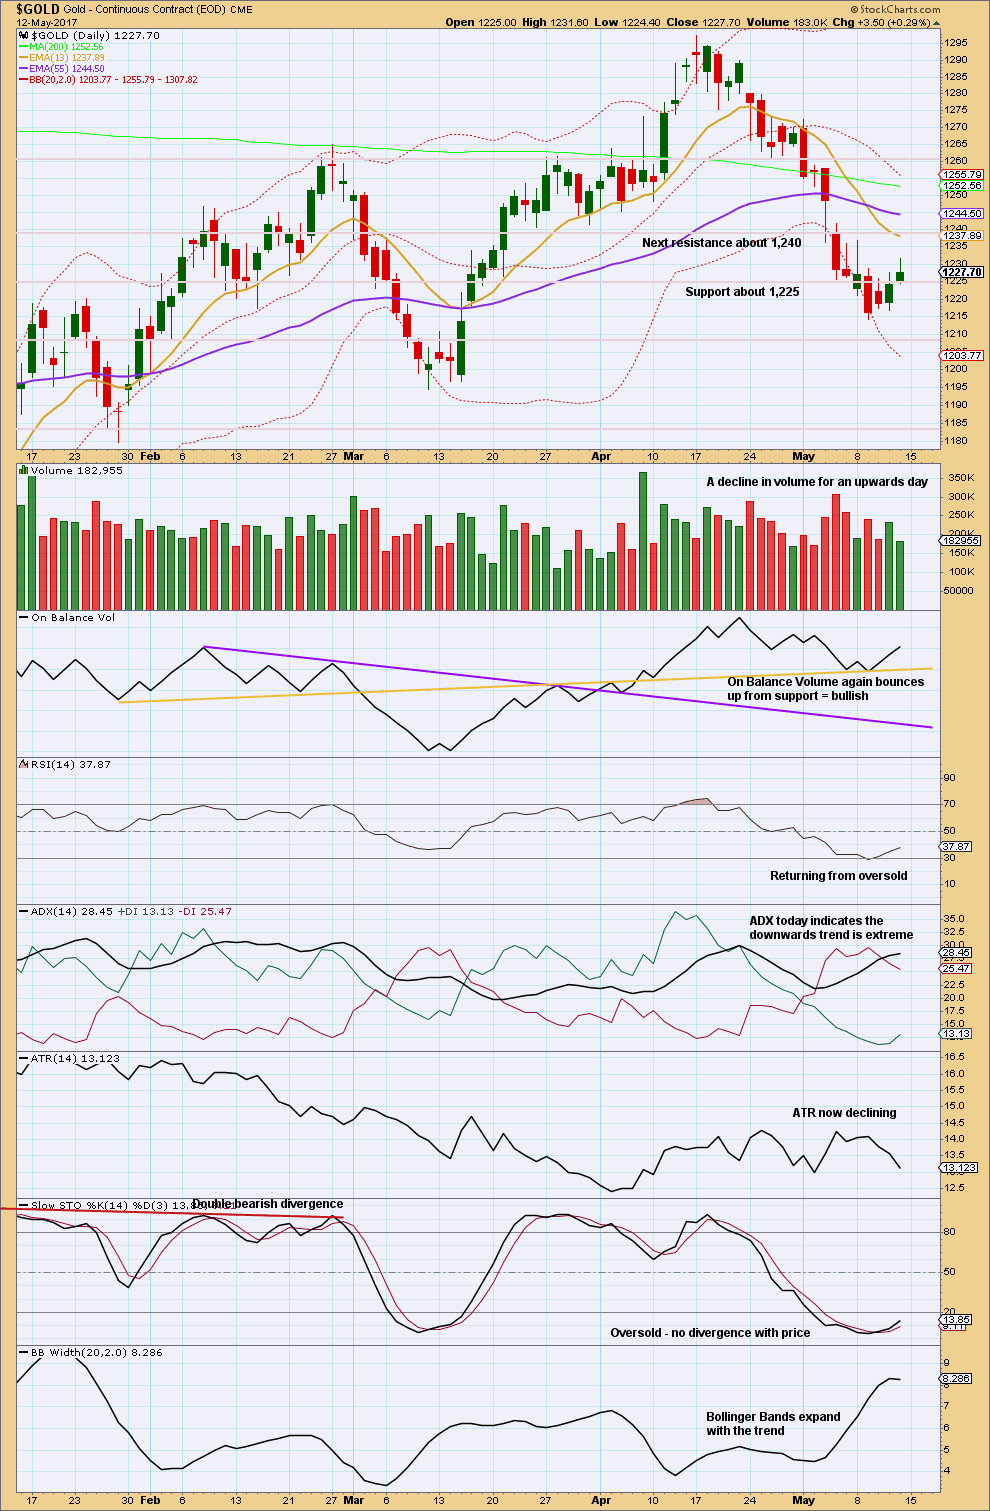
The small real body and long upper wick of Friday’s candlestick suggests upwards movement is facing difficulty. Lighter volume does not support the rise in price. This looks like a counter trend bounce and not the start of a new trend.
Look for the bounce to possibly end when price finds resistance and Stochastics is overbought at the same time. Next resistance is about 1,260.
GDX
DAILY CHART
Click chart to enlarge. Chart courtesy of StockCharts.com.
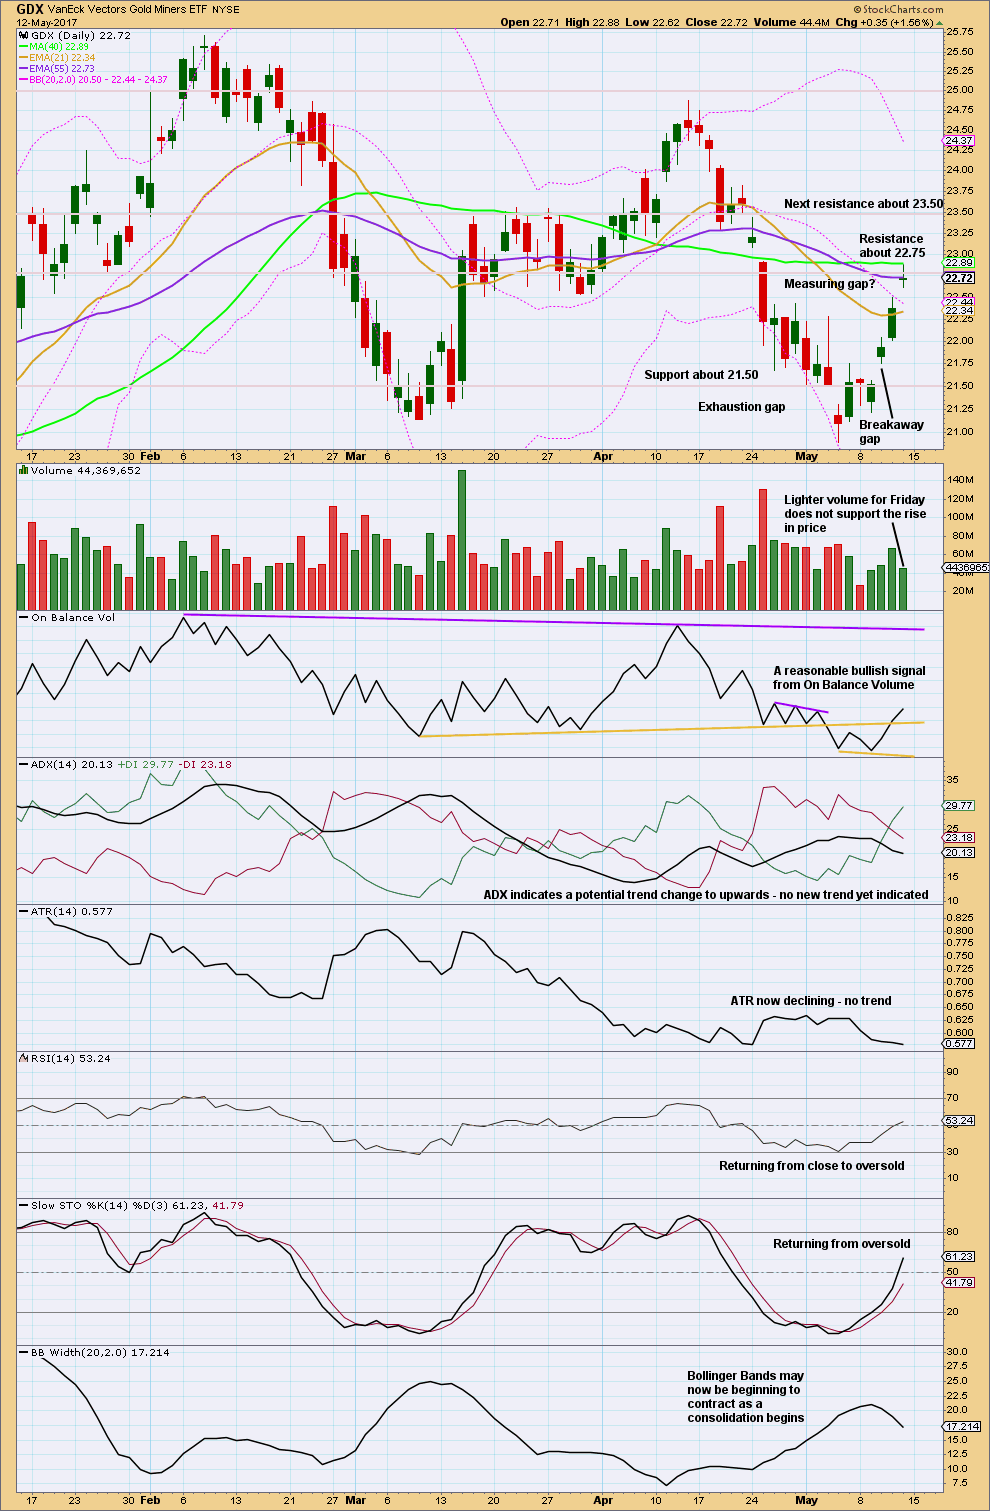
Price is still bullish but Friday looks weak. The small doji shifts the trend from up to possibly neutral. A decline in volume supports this view. It looks like price has found resistance about 22.75.
The gap up for Friday should be assumed to be a measuring gap while it remains open. The measured rule gives a target about 23.35. If the gap is closed, then it would be an exhaustion gap and we should expect a consolidation.
Give reasonable weight to the bullish signal from On Balance Volume. Expect it is most likely that price may overall continue upwards until next resistance about 23.50, just above the target from the measured rule.
This analysis is published @ 12:15 a.m. EST on 13th May, 2017.
Got to go with the flow as mentioned by Lara below. With 1227-26 holding, looks good to rally for a take out of 1236-37; Silver is looking to rally too… Looks like soon enough 20dma (1248.20) will get under both 200dma & 50dma unless Gold price escapes above there before that happens lol…. Taking it one step at a time on the long side….
The spike in oil’s price today being attributed to the Saudis and Russians agreeing to extend production limits. This however does not change overall technical picture in my opinion and I am expecting the gap up today to be closed in day or two at most. Same with the open gap in the indices….
Apologies everybody for not getting this chart up before the close 🙁
Now is when the situation gets complicated. If we see a new high and if price doesn’t make a new low below 1,225.56 then minute a would be a five wave impulse, and so minor B would most likely be a zigzag.
If price now makes a new low below 1,225.56 then minute a would be a zigzag and minor B would be a flat, combination or triangle.
I’ll now start to have alternate hourly wave counts and TBH they’ll all be close to even in probability.
A pretty good target too. Only 0.88 above.
Any thoughts on GDX at the present?
That fat red candlestick looks rather bearish. Maybe a small pullback within the short term upwards trend here?
that’s my hope. Thanks – but ah how deep does it go? Really I think I’m in the ‘its driving me crazy’ stage. Thanks for the price differentiation on minute a and minor B.
A timely report from Bob Hoye on gold price vs the major international events.
Interesting post.
http://www.321gold.com/editorials/hoye/hoye051517.pdf
Papudi, this is an interesting concept. It follows the adage “buy the rumour, sell the fact”. In the run-up to an epic event, investors buy in until the frenzy ends when the event actually unfolds. Thereafter, it is downhill.
To the layman, it smacks of the trite and hackneyed joke that romance builds up until the honeymoon, and it is downhill thereafter as the reality sinks in. I hope no sensitivities are being offended. If so, I do apologise unreservedly.
I agree. LOL!
A reliable indicator has warning that gold and silver nominal price will rise.
Godl to silver ratio in 4 hour period has consolidated and broke out after back test now on its way down. So appear.
A reverse symmetry will take the ratio to back down to 68.
When this ratio declines nominal prices go up and vice a versa.
Ichimoku 4-Hourly Analysis — data as at 4:50 am today
==============================================
In the near short-term, the gold price is still rising constructively and is attempting to enter the cloud.
It may get rejected at the lower cloud boundary around 1233-1234 (end of minuette 3) and make another attempt for minuette 5. This will be on course to Lara’s first target of 1235-1236 for Minute A, resulting in the lower target of 1245 for Minor B.
But, if price does manage to break into the cloud, it would encounter resistance at the top of the cloud boundary at 1245.90, a break of which would lead to the higher target of 1264 for Minor B.
On the fundamental level, events taking place over the weekend have whetted investor appetite somewhat. Stoking sentiments are the abrupt firing of FBI Director James Comey by President Donald Trump, the global cyber-attack on computers on Friday, and the firing of a longer-range ballistic missile by North Korea, one that has been calculated as being able to reach as far as Guam Island and hence encroach on US defence.
The controversy over Comey may lead to further delays in the implementation of Trump’s economic agenda. If Congress could not approve the tax reform in a timely manner, it may weigh on equity markets as the run-up to new heights in the S&P Index was predicated on this. Disgruntled investors could then exit the stock market, already perceived by many as being in bubble territory, and put their money into safe-haven assets like gold and the Japanese Yen.
The firing of a ballistic missile by North Korea could lead to a breakdown in negotiations, which may then lead to an escalation of military activity in the region. This could send shivers down the spines of equity investors who had hitherto called the North Korean affair a bluff.
The extent of the damage caused by last Friday’s cyber-attack may not be known as yet. The computer virus may continue to spread on Monday when employees go back to work. There is also the chance that the perpetrators of the event may step up their efforts, making things worse.
Any one of these three events may be enough to drive investors out of higher-risk assets and into protective assets like gold, and this is what we will be watching for today. As these events have not yet escalated to crisis proportions, I’m pretty sure investors are likely to adopt a wait-and-see attitude: they will see how the US stock markets react before making their trading decisions.
Price has already ventured into the cloud. Now straddling the bottom boundary of the cloud, it could mean a period of consolidation. As long as it does not exit downwards, the slow grind would eventually bring it up to the top boundary to test 1245-1250.
For those trading the Oil short, J Kennedy’s count sees the .618 retrace as a likely end to the downward move. A little different view than Lara’s.
Daily Oil
Futures blew past the invalidation point for Lara’s count at 48.22.
I took profits on half my position on Friday and will be stopped out at the open for certain. I do still think we are seeing a counter-trend move even though it has gone farther than I expected. I think the breakdown we saw earlier is still intact and only a close above 50.00 -51.00 area would have be rethinking that thesis.
I know we’ve had the debate about whether of not $USD trades with an inverse relationship with Gold…. If it does, it’s certainly not consistent.
Anyway, J Kennedy sees the $USD going down toward 95 near term. Seems like this MAY help gold go up?
Daily $USD
Posting a few charts from Jeffrey Kennedy’s FREE Friday video.
Lara, what do you think of JK’s Coffee count? If you agree that a wave 2 bottom is due in the next month or so, this could be a great TRADING ROOM trade for buy and hold over the next year or so… We could enjoy profits daily with a nice cup of coffee!
Coffee Daily
Dreamer,
Glad to see that I am not the only one long /KC. /KC 2018 calls are a great way to play for the up move. I am bullish on /KC long term.
Thanks for sharing these charts Dreamer. I’ll take a look at Coffee later today, I need to see the bigger picture before I can draw any conclusions on JK’s count.
You’re right, if the count is on then it could be a good buy and hold trade.
Thanks Alan for your comment on long term chart of gold below.:
“In my opinion, it would take an earth-shattering event to propel gold through that line, possibly a stock market collapse, bond market collapse, the loss of US reserve currency status, WW3 and the like.”
It may not.
I was of the same opinion that such a crisis will propel gold to higher level. But now history tells otherwise.
Bob Hoye a financial historian declared in Nov 2007 at market top that crisis has began. Of course once in life time crisis did not happen till fall of 2008 and it was the world wide crash of all markets. Babies were thrown out withe the water. Including gold and gold miners.
With such a pre judgement how and what gold will do has doomed me personally in 2009. Knowing the recommendations of Bob Hoye I should have gone in 100% cash.
An excellent EW counts and charts TA analysis such as Lara’s and yours will determine what to expect in gold.
Wishing Lara and all mothers a Happy Mothers Day! 😇😍
Thank you very much Dreamer 🙂
I had a lovely Mothers day and my son wrote some very nice words for me. So that’s what I wanted 🙂
Horrible to have to trade this, very tricky, conflicting signals, specially with Silver looking to rally. Expecting Gold price to pullback for the week and will look to sell short an upturn. Upside risk 1233-41 range. Lets see if the Gold bulls can get this past 10dma as Alan mentioned and 38.2% retrace of L 1195 / H 1295. Nimble two sided trade imo. Or maybe take to the sidelines for a while. GL all!
Looking at bigger picture: Look at the forest than grass.
On a monthly chart gold is very close to cross the resistance line from 2011 top..
The month is not over so the chart is incomplete for this month.
Lara wave count will cap gold price below this line.
If it does decide to move higher than story will be different.
The numbers on the chart are reversal points and nothing to do w/EW waves.
Papudi. That is correct.
In the big picture, the 2011 downtrend line is the last stumbling block to gold’s climb. Until that line is taken out, gold will continue to pullback every time it encounters that strong resistance. I think this time round it won’t be any different. In my opinion, it would take an earth-shattering event to propel gold through that line, possibly a stock market collapse, bond market collapse, the loss of US reserve currency status, WW3 and the like. Even if price breaks above that line, all is not in the clear yet. I would prefer to see a convincing rise at least above the 2016 July high of 1374.91, also the end of Primary W, before I can have complete confidence that the next leg up in gold is underway.
If cycle b is a triangle that trend line could remain intact for many months, if not years more.
I agree with both of you .
I will keep watching this S/R line.
Alan
Thanks very much for your thoughts, much appreciated.
Just playing with “trend lines”. This may not be a conventional analysis technique but it does yield some interesting insights.
The brown line is the support line I mentioned in the Ichimoku weekend analysis. I use this as an alert that something awry is brewing with prices.
The purple line shows that price has broken below that line in the rather deep Minor A down. Prices may now backtest that line on the way up. If so, the 1245 test would not happen. Also, the 1264 test would happen nearer the top of the cloud as Dreamer had mused yesterday. Coincidentally, it would happen a week or so before June 14, the day of the next FOMC meeting when the rate hike would very most probably be announced.
Nice chart Alan. I think those trend lines are important. For the Bears, that purple line could be the top of a right shoulder and the brown line could end up being the neckline. Could be a very bearish pattern developing. Something to watch for.
Ichimoku End of Week Analysis
Data as at the close of May 12
==========================
Gold price has moved inside the green cloud, indicating the mood is one of muted bullishness, best described as being neutral with a hint of the bull. That the tenkan-sen lies below the kijun-sen warns that the bull is going to struggle. Furthermore, the daily candle has a longer upper wick than the lower. Coupled with the fact that price had already gone past the better part of the third wave, only the fourth and fifth waves remain before a move downward inevitably occurs. Caution is still advised.
The same uninspiring picture can also be gleaned from price movement. Gold prices initially moved higher on Friday, as the dollar dipped in the wake of the tame US CPI report. Price ran into resistance near the 10-day moving average near 1232. Momentum waned as the trajectory of the MACD histogram has moved slightly higher reflecting consolidation from the recent gain in prices.
The silver lining is that the bottom is quite well-cushioned recently, as Syed mentioned in a comment yesterday. If you draw a line from the last three lows from late January, respectively 1179.70, 1194.50, and 1214.30 on the graph, that trendline acts as a well-tested strong support. The struggling bull will still be alive and kicking until that floor gives way. As for me, I am holding on to my long position in gold over the weekend for that reason. (Nick, this is one such instance). To me, the following week will be an important one, even vital for the future direction of gold. If the trendline is tested and held, then the bull will live another day, and a test of the formidable 1235-1237 resistance cluster would get underway. But, should price break down below the trendline I mentioned above, then the market could reach 1200, or even less, in a hurry since the market ambience is still one of bearishness. This scenario is beginning to sound scary. Lara had rightly alluded to the possibility that Minor B can unfold as a flat or a triangle, meaning that once the third wave is complete, then price will drop.
I will provide the intra-day analysis when markets open on Monday. Have a pleasant and refreshing weekend, everybody, and thanks for reading.
Nick. This is in response to your query yesterday. It might be better to post a reply here as you may not go back to read the previous post.
Just like Dreamer said, trades have to be planned meticulously. When I plan a trade, I look at the trend and the price movement, and select an appropriate entry point, together with my position size. I base it on EW analysis for the big picture, embellished with resistance/support levels, and execute the trade with Ichimoku and candlestick analyses. At the same time, I calculate my stop and exit point. You may call me a control freak but I do not like to let the vagaries of the market get over me. The approach is sterile, never fun, even considered boring. But that’s discipline. Best of all, it leaves no avenue for emotions. No cursing, swearing or pulling out hairs (not that I have much), just plain business-like. Of course, if you desire some thrills, set aside a small sum to “gamble”. I do it once in a while for trades with possible large gains in order to break up the monotony.
The other important factor to guard against is greed. Some investors like to shift their goal-posts. They up their targets whenever the going is good. This is not a bad thing to do provided they have a proper strategy in place, like trailing stops. This also applies to position size. As they say, “don’t put too many eggs in one basket”. Always take money from the table when there is the chance to do so. Also, I do not like to have an underwater position. This have the potential for the loss to mount higher and higher. A bad trade is like a dead fish: the longer one keeps it, the worse it smells. And the worst thing one can do is to compound the error by adding to, or “averaging” losing positions, throwing good money after bad. It is much more desirable to make less, or sometimes even to take a small loss, rather than lose a lot. We are not billionaires with a bottomless account.
If done properly, one would only need to periodically monitor the price movement, and not having to be glued to the computer screen, fretting and hoping, over-stressing oneself. That’s why some of us have plenty of time to write on this forum even in the midst of trading. Near the end of the day, and especially over the weekends, particularly those with a Monday holiday, I assess the probable price movement. Don’t assume prices are going to be linear, they rarely are. What can go wrong have an uncanny ability to do so. That’s Murphy’s Law at its worst. My maxim is that unless I’m pretty sure the trend is strong (evidenced from the Ichimoku chart), I will not hold a position overnight. Nowadays, markets move very quickly. I think technology is part of the blame. Ready access to the Internet plus online trading without the need to call a personal broker over the phone, as well as online realtime charts complete with indicators, make information so easily obtainable that anybody can make a trade. Gone are the days of buy-and-hold, unless as you said, you happen to be a Warren Buffett.
Nicely done Alan. As strange as it may seem to some, a ” stop-gain” can be ss important as a stop-loss… 🙂