
A downwards day, which was expected as most likely, followed the blow off top.
Summary: It may be slightly more likely that price may move sideways and slowly higher towards 1,276 (the target may be too high). Alternatively, a high may be in place now and this would be confirmed with a new low below 1,214.81.
New updates to this analysis are in bold.
Last historic analysis with monthly charts is here, video is here.
Grand SuperCycle analysis is here.
MAIN ELLIOTT WAVE COUNT
For clarity I have decided at this time it may be best to publish on a daily basis weekly charts I and II. Both charts expect a zigzag down to complete and the difference is in the expected depth.
WEEKLY CHART I
Click chart to enlarge.
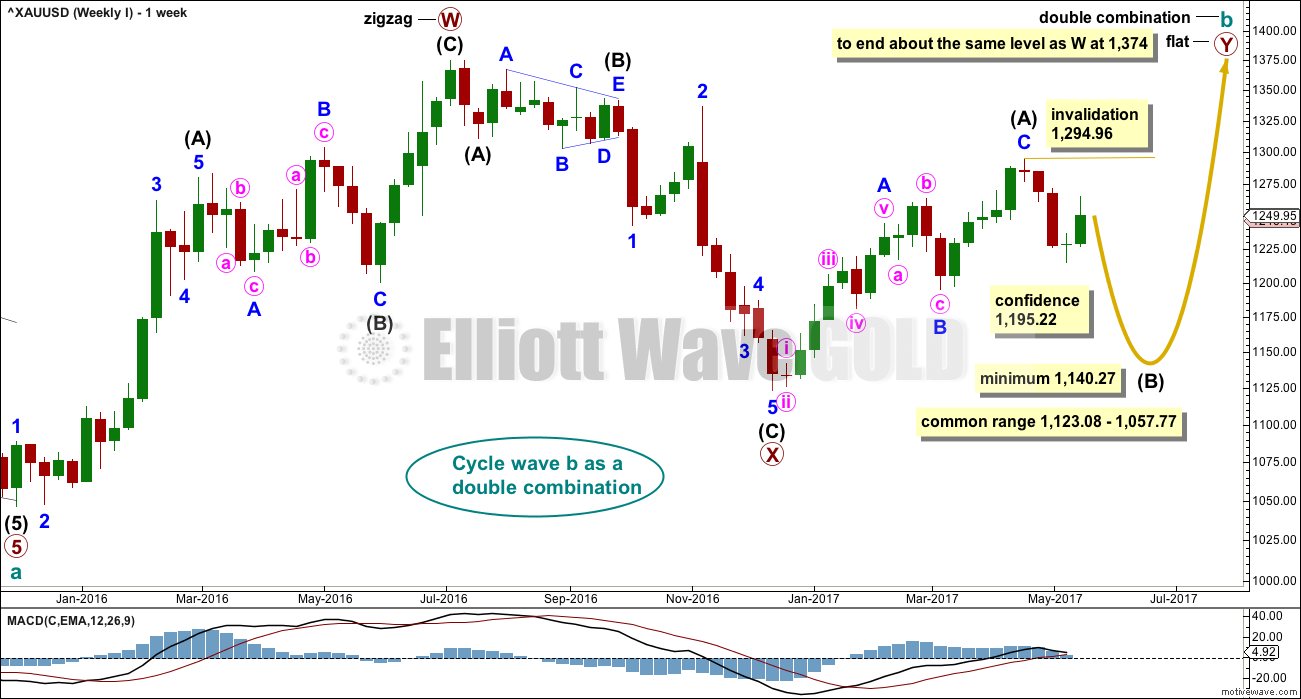
Combinations are very common structures. Cycle degree waves normally last one to several years, and B waves do tend to be more time consuming waves than all other waves. Given these tendencies the most likely scenario at this point may be that cycle wave b is an incomplete double combination.
The first structure in the double labelled primary wave W fits as a zigzag. This upwards movement will subdivide as either a three (zigzag) or a five (impulse). It does have a three wave look to it.
The double is joined by a deep three in the opposite direction labelled primary wave X, which is a 0.77 depth of primary wave W. X waves within double combinations are normally very deep; this one looks right.
The second structure in the combination may be either a triangle or a flat correction. Both of these structures have A waves which subdivide as threes.
At this stage, the upwards wave from the low in December 2016 does now look best and subdivide best as a completed zigzag. This may be intermediate wave (A) of a flat correction or a triangle. Because a triangle for primary wave Y would look essentially the same as the second weekly chart below, only a flat correction is considered here. The most common two structures in a double combination are a zigzag and a flat.
This wave count follows the most common scenario and has the best fit.
Within the flat correction of primary wave Y, intermediate wave (B) must retrace a minimum 0.9 length of intermediate wave (A) at 1,140.27. The most common length for intermediate wave (B) is from 1 to 1.38 times the length of intermediate wave (A), giving a common range from 1,123.08 to 1,057.77.
Intermediate wave (B) may subdivide as any corrective structure, but the most common structure for B waves within flats is a zigzag. At this stage, on the hourly chart it looks like a five down is now complete, which would indicate intermediate wave (B) is a zigzag subdividing 5-3-5.
The daily and hourly charts will follow this weekly chart. That does not mean the other two weekly charts aren’t possible, they are, but the number of charts must be kept reasonable on a daily basis.
WEEKLY CHART II
Click chart to enlarge.
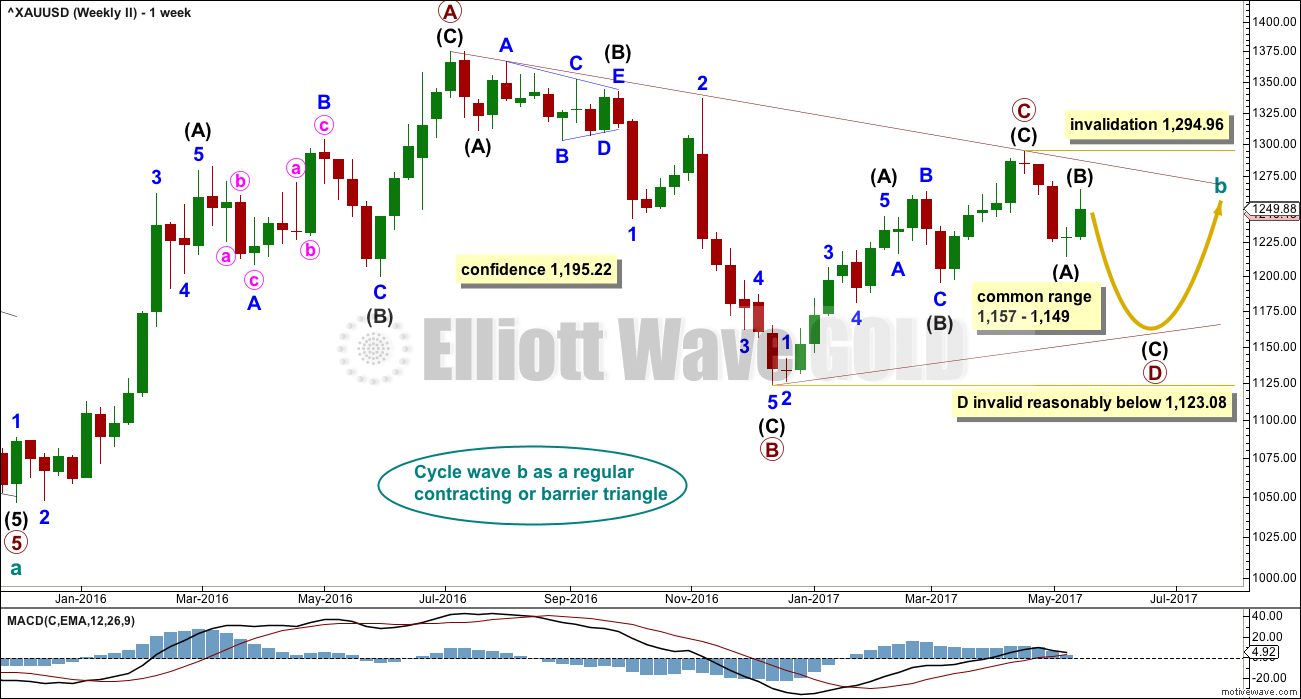
What if cycle wave b is a triangle? This is also entirely possible. Triangles are not as common as double combinations, but they are not uncommon.
Within the triangle, primary waves A, B and C are all single zigzags. One of the five subwaves of a triangle normally subdivides as a more complicated multiple, usually a double zigzag. This may be what is unfolding for primary wave D.
Primary wave D of a regular contracting triangle may not move beyond the end of primary wave B below 1,123.08.
Primary wave D of a regular barrier triangle should end about the same level as primary wave B at 1,123.08, so that the B-D trend line is essentially flat. What this means in practice is that primary wave D may end slightly below 1,123.08 and the triangle would remain valid. This is the only Elliott wave rule which is not black and white.
Thereafter, primary wave E should unfold upwards and would most likely fall a little short of the A-C trend line. If not ending there, it may overshoot the A-C trend line.
At this stage, the structure on the hourly chart is still the same for both this weekly wave count and the first weekly wave count: a zigzag downwards is unfolding. However, they now diverge in how far down the next wave is expected to go. This second weekly wave count expects a more shallow movement to not end reasonably below 1,123.08.
DAILY CHART
Click chart to enlarge.
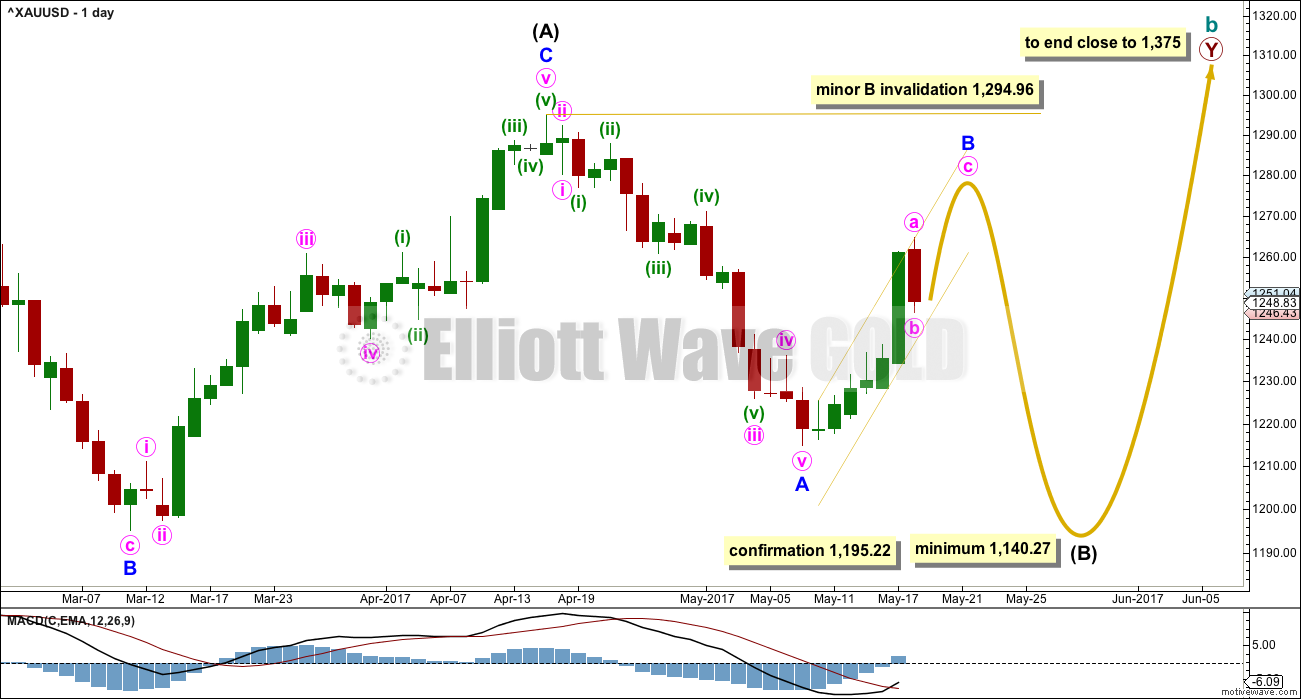
This daily chart will suffice for both weekly charts above, although the labelling follows weekly chart I.
Both weekly charts expect a zigzag downwards. Weekly chart I expects a deep zigzag for intermediate wave (B) to a minimum at 1,140.27. Weekly chart II expects a zigzag down for primary wave D to not move below 1,123.08 and most likely fall well short of that point.
The daily chart follows the expectations for weekly chart I, but the structure for weekly chart II would be exactly the same.
Within the flat correction of primary wave Y, intermediate wave (B) must retrace a minimum 0.9 length of intermediate wave (A) at 1,140.27. The most likely corrective structures to achieve the deep correction required for B waves within flats are single or multiple zigzags. These begin with a five, then a three in the opposite direction.
Minor wave A is complete. Minor wave B may be an incomplete zigzag. Volume remains heavy, price remains within a best fit channel, and the candlestick for the 18th of May closed with a long lower wick (StockCharts data). This looks slightly more like minor wave B is incomplete than not.
Minor wave B may not move beyond the start of minor wave A above 1,294.96.
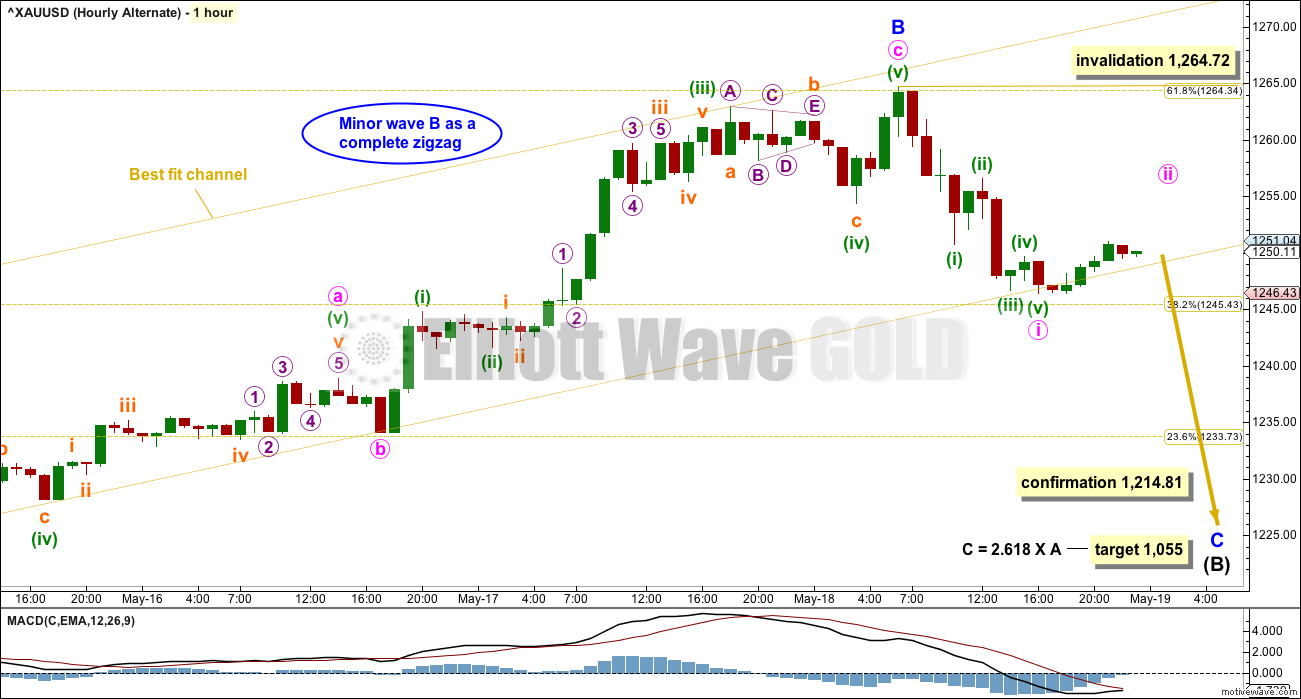
HOURLY CHART
Click chart to enlarge.
It is my judgement after some consideration that the hourly wave counts should be swapped over.
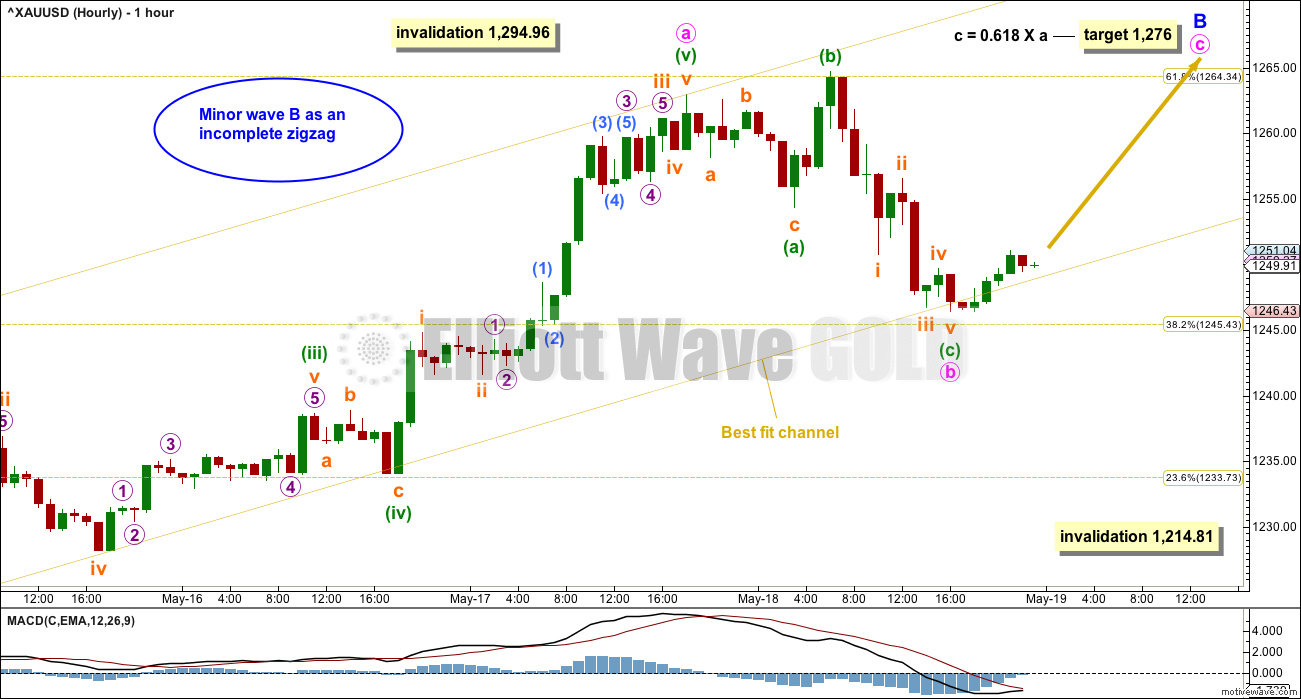
Minor wave B may be incomplete.
After blow off tops, price usually immediately reverses to retrace some or all of the blow off top. That happened today. It then very often moves sideways and makes new highs a few days after the blow off top, before a final trend change.
The proportion of minute wave b is much better here than the alternate below. Minute wave b is an expanded flat correction.
If the target is wrong, it may be too high. Minute wave c may not exhibit a Fibonacci ratio to minute wave a.
Minute wave b may yet move further sideways to take up more time. It may not move beyond the start of minute wave a below 1,214.81.
I would judge this main wave count to have about a 55% probability.
ALTERNATE HOURLY CHART
Click chart to enlarge.
This alternate wave count may have a slightly lower probability than the main wave count.
If minor wave B is over, then within it minute wave b was a very quick zigzag. This is acceptable, but it doesn’t have quite as good a look as the larger minute wave b on the main hourly chart.
Within minor wave C, minute wave ii may not move beyond the start of minute wave i above 1,264.72.
I would judge this alternate wave count to have about a 45% probability.
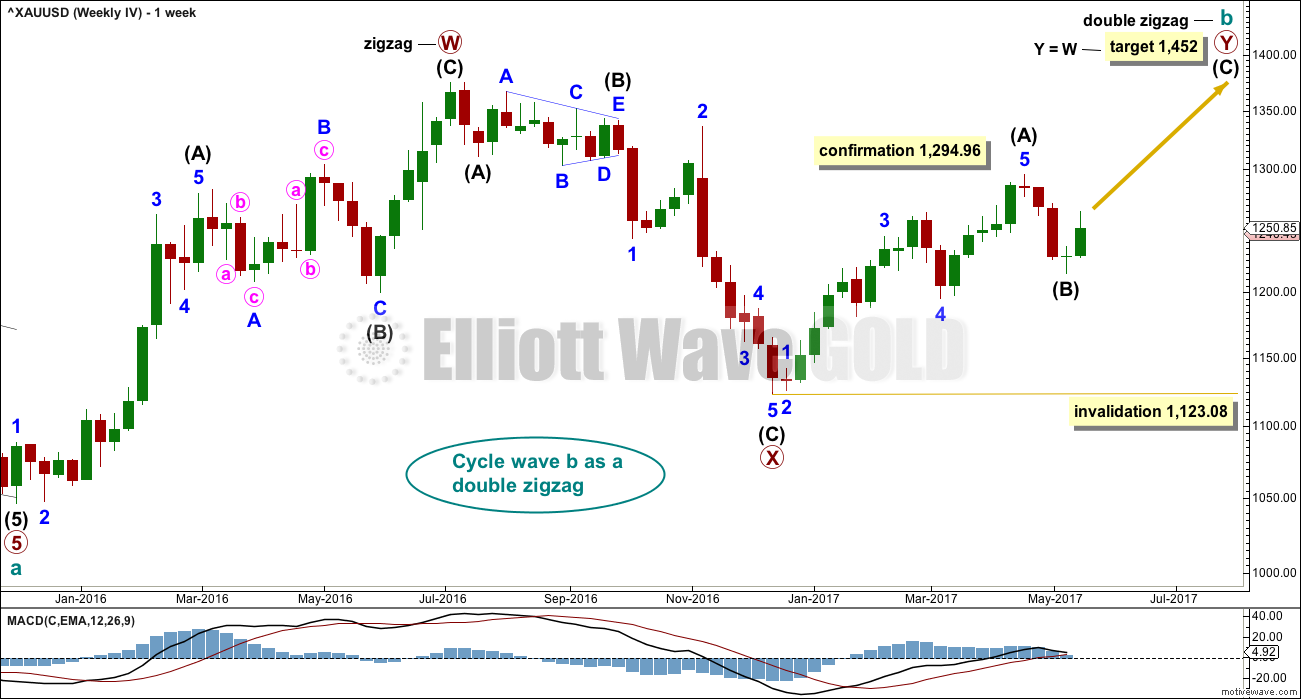
WEEKLY CHART IV
Click chart to enlarge.
What if the bull market beginning in December 2015 remains intact? Price has essentially been moving sideways since that date, so all possibilities should be considered.
A possible Morning Doji Star reversal pattern at the low labelled intermediate wave (B) would support this wave count.
This wave count requires confirmation above 1,294.96. That would invalidate the first three weekly charts (the third is seen in historic analysis only).
It is possible that cycle wave b is continuing higher as a double zigzag. However, double zigzags normally have brief and shallow X waves. The purpose of the second zigzag in a double (and the third when there is one) is to deepen the correction when price does not move deep enough in the first (or second) zigzag. Thus double (and triple) zigzags normally have a strong and clear slope against the prior trend. To achieve this look their X waves normally are brief and shallow.
In this case, primary wave X is neither brief nor shallow. It is a 0.77 depth of primary wave W and lasted 0.74 the duration of primary wave W. Overall, this does not have a typical look of a double zigzag so far.
This wave count also must see the rise up to the high labelled intermediate wave (A) as a five wave impulse, not a three wave zigzag. This looks a little forced, so it reduces the probability of this wave count.
This wave count should only be used if confirmed with a new high above 1,294.96. Low probability does not mean no probability, but should always be given less weight until proven.
TECHNICAL ANALYSIS
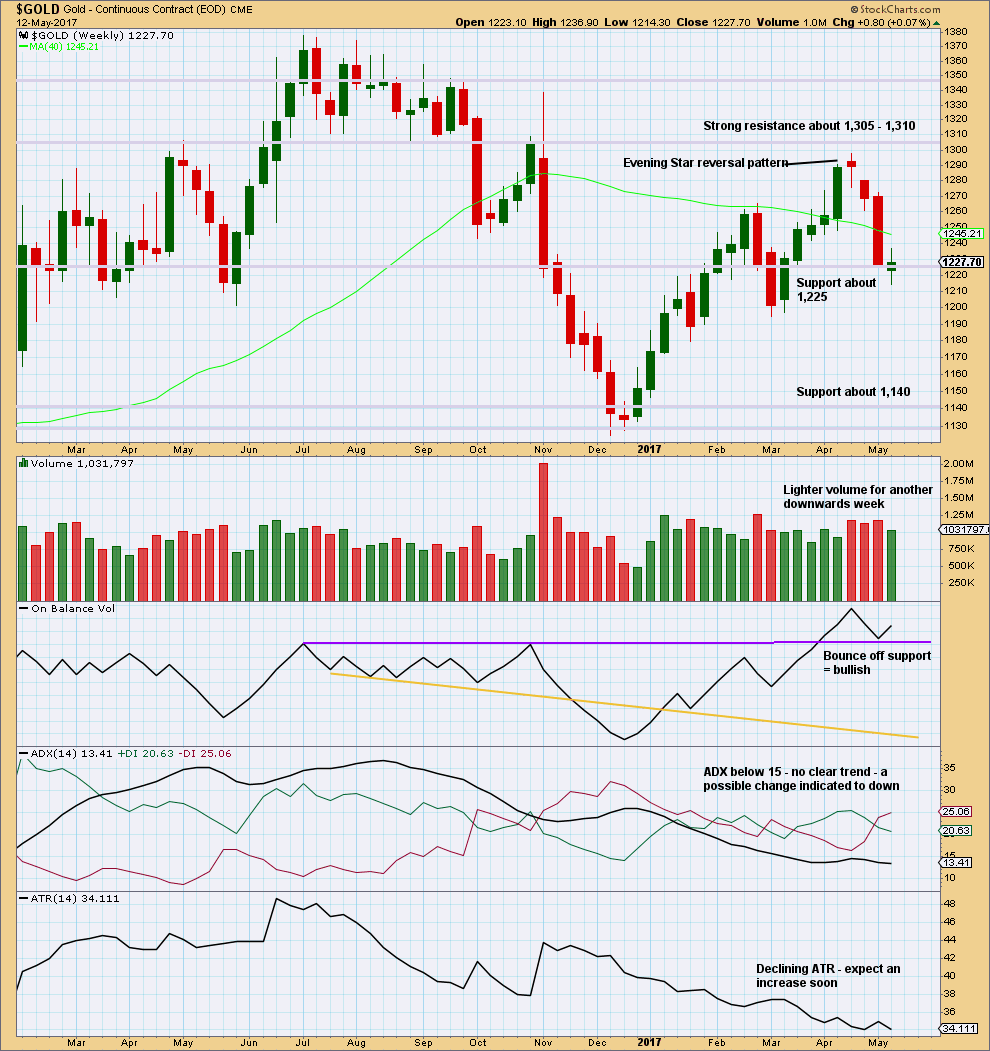
WEEKLY CHART
Click chart to enlarge. Chart courtesy of StockCharts.com.
Another downwards week closes green with a small real body. This is a spinning top candlestick that shifts the trend from down to neutral.
The balance of volume is upwards and shows a decline. Upwards movement may be a counter trend movement if it does not have support from volume.
The bullish signal from On Balance Volume suggests this week may see upwards movement.
DAILY CHART
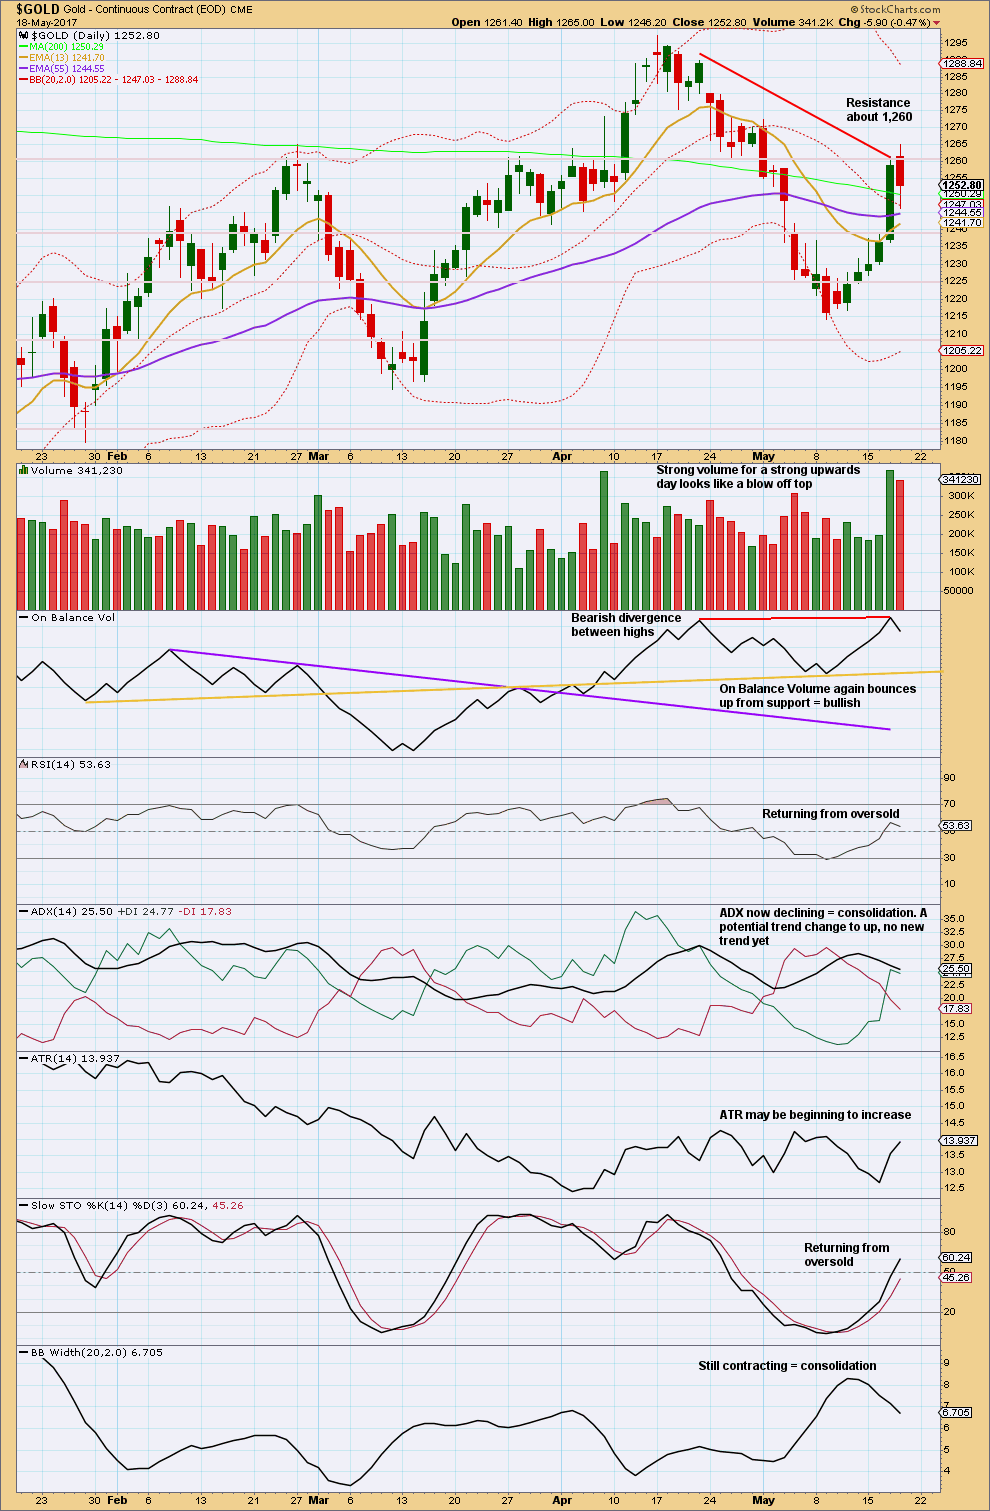
Click chart to enlarge. Chart courtesy of StockCharts.com.
The blow off top has been followed by an upwards day, which made a slightly higher high and a higher low but closed red and has the balance of volume downwards. There was strong support for downwards movement during the session from heavy volume. This is bearish.
The long lower wick on this daily candlestick is bullish.
After a blow off top, price either moves sideways for a few days then trends slightly higher before a trend change, or sometimes the blow off top occurs at the final high.
The bearish divergence between On Balance Volume and price is slight. It may signal a reversal here, but divergence can develop further before price turns.
Bollinger Bands clearly contracting as price moves higher indicates this movement is more likely a counter trend movement. Normally, during a trend, Bollinger Bands expand then contract as price consolidates.
GDX
DAILY CHART
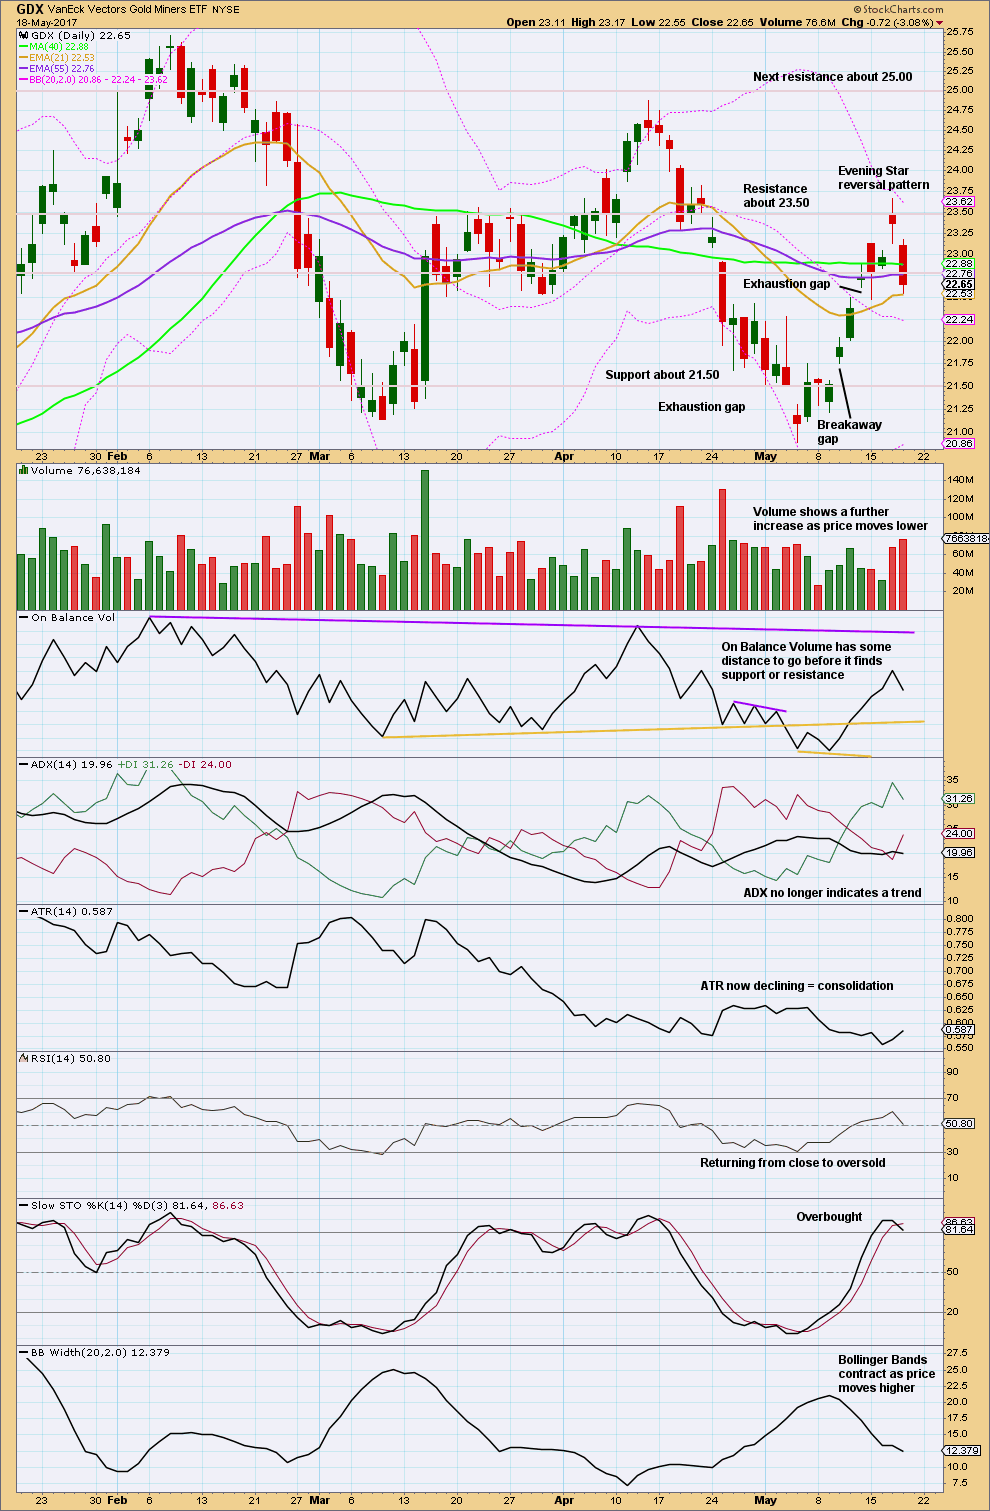
Click chart to enlarge. Chart courtesy of StockCharts.com.
The Evening Star candlestick pattern is supported by heavier volume on the last candlestick. This supports the idea of a high in place now for GDX.
Bollinger Bands expand when markets trend and contract when they consolidate. With the bands contracting as price has moved higher, it looks like this is a counter trend movement. It may now be over.
This analysis is published @ 12:35 a.m. EST on 19th May, 2017.
Updated main hourly chart:
So far so good. But I need to have another alternate hourly chart to consider minute b continuing sideways. It could continue as a combination or triangle.
So far I can’t see a completed five up. This could either be the start of minute c, soon to increase momentum and move through the middle of a small third wave
OR
It could be part of a continuing correction for minute b to go sideways.
Gold and silver commercials continue to unload short positions. That may favor more upside. Silver looks more favorable with only 43k Long on big speculators. It bottomed around dec -Jan at 20k. Encouraging that during this move up commercials have not shorted the market as much as they have gone long.
GSR acted very strange yesterday in 4 hour period.
While GSR was going higher and made new high gold /silver remained in trading range in +tiv territory.
Currently it is on its way down. There are two price markers: 1297 and 1214. Let see what happens?
Ichimoku Hourly Analysis
Data as at 3:50 am ET today
=======================
The 1-hour Ichimoku chart shows gold price inside the green cloud. Prices are now in a period of consolidation. They could still go either way, breaking out above the top cloud boundary around 1256, or breaking down below the bottom cloud boundary around 1248. The 1256 area was support now turned resistance, and the 1248-1249 region had been providing strong support yesterday. Until a clear breakthrough has been forged, it would be a sleepy trading session.
Hi. Thanks for all your updates. Interesting week with a H/L 1265/1227 ending with a wishy washy inside day and Gold price closing above daily pivot. Looks like 1252/48 is holding for some upwards movement on Monday to take out 1259-60. Expecting a pullback during the week though. Advantage bulls. Lets see how this goes and if can take out May 1 high 1270.
Syed. Good forward thinking. I will post my thoughts once Lara updates. I usually look at the after-hours price close to have an idea of investor sentiment towards the next day. Gold has closed marginally higher at 0.13% gain. So, it is advantage bull, unless of course something happens over the weekend.
Ichimoku Daily Analysis
Data as at the close of May 18
=========================
Gold markets finished lower on Thursday after posting its biggest one-day gain since the Brexit announcement last June. Both the tumble in the US dollar and the slip in the S&P leveled out yesterday. By no means is sentiment returning to the “preferred” trends; a return to political risk remains a prevailing threat. But, gravity in complacency in the past few years has been a strong motivator: investors have been weaned on the notion that the US government will always bail the market out, and therefore the drop in the stock market was seen as only a one-day anomaly.
The daily Ichimoku chart is still painting an uncertain picture. The cloud is still green, offering a glimmer of hope for a bullish rebound. But, all is not clear. The daily candle is straddling the top of the cloud boundary. The tenkan-sen is still lying below the kijun-sen. The next few days may be telling. If gold does manage to drop back into the cloud and falls below the bottom cloud boundary, then it will trigger a sharp decline. But if price rebounds off the top of the cloud boundary, this shallow retracement becomes a bullish sign.
The key takeaway is that the picture remains murky. It does appear that gold movements recently have been prone to discrete event risks, especially political noise coming out of Washington. Gold is trading on the “fear trade”; people are buying gold as a refuge from the volatility in the stock market and of course the dollar. With this uncertainty, I feel it is important to remain skeptical of the market movements. At the present moment, placing a large, leveraged and extended risk exposure is anything but a wise move. Caution will hang over the gold market and throttle our trade potential. The market can remain choppy and volatile over the next few days as Lara had rightly pointed out.
Lara. I think you have posted the wrong chart for Weekly IV. The one posted is Weekly III which declared that Cycle B was over.
I am sorry Alan. Fixed now.
Lara, don’t need to be apologetic. This is the bane of loading files from the computer. I have also been guilty of this countless times.
We found Tom the Kiwi today, within about 20 minutes. Third time lucky!
Here’s me with Tom (pic proves it happened 🙂 )
And then because we had time we tracked another Kiwi who needed her transmitter removed.
Here’s Marino. 2.5 kgs of beautiful healthy Northland Brown Kiwi
Those are really lovely birds. They look so docile, almost like pets being cuddled.
Great job Lara, thanks for sharing
That’s quite a bird. I assume they are endangered? Great that you help take care of them. I hope they are gentle; that beak and those claws look dangerous!
Cheers guys!
Yes, they’re endangered. These guys live in my backyard and I help to control predators in their range.
The beak is harmless, they use it for food, it’s very sensitive with nostrils at the end. Very strange.
The feet, yes, they use for defence. The females are bigger and have big claws.
But they’re flightless. So they have no breastbone. So they’re very vulnerable to larger predators. If bitten by a dog, even a small one, on the breast, their lungs can be crushed and they die.
They have a very musky smell, and it’s quite strong. I was coated in it for a while today! And they have long whiskers like a cat.
Really weird and wonderful birds.
These birds r very adorable and seemed docile. They could be pets? 🙂
As they’re an endangered species, no, they can’t be pets.
I think they’d be happier in the wild. They need quite a large territory to forage in and they live in monogamous pairs.
While the pic of me holding Tom looks like he’s docile, he was actually very frisky.
I see, thx for the explanations. They are wonderful birds to look at….
Lara . Do Kiwi birds eat Kiwi fruit? What do they eat? Thnx Stephen New London CT.
Well, no. Kiwi birds don’t eat fruit at all. They’re carnivores. They eat insects and insect larvae. Grubs and bugs, pretty much 🙂
Kiwi fruit originated from China, they’re not native to NZ.
Kiwi birds are endemic to NZ.