Downwards movement was expected for Monday to end about 1,257. Price moved lower as expected reaching 3.52 below the target so far.
Summary: The upwards trend should resume. Confidence may be had in this expectation if price makes a new high above 1,268.38 and breaks above the best fit channel on the hourly chart. The target for now is about 1,392.
Price should find very strong support at the lower edge of the base channel if price does move lower, which would be about 1,240 for tomorrow’s session.
New updates to this analysis are in bold.
Grand SuperCycle analysis is here.
Last monthly and weekly charts are here.
MAIN ELLIOTT WAVE COUNT
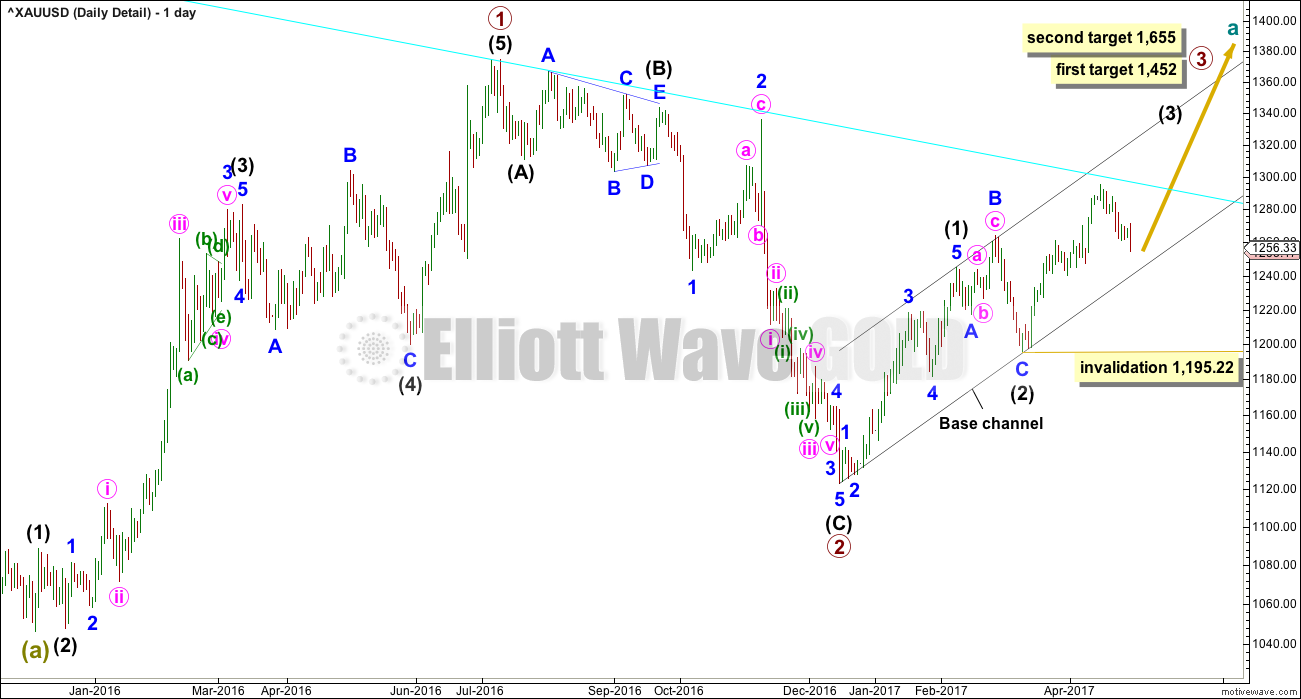
DAILY CHART – DETAIL
This chart steps back to see all movement since the important low on the 3rd of December, 2015.
To see how this fits into the bigger picture, please see the last historic analysis linked to at the start of this analysis.
The first upwards movement labelled primary wave 1 fits well as a five wave impulse. Primary wave 2 fits as a zigzag. It would be difficult to see the downwards wave of primary wave 2 as an impulse because that would require ignoring what looks very much like a triangle at its start (labelled intermediate wave (B) ). To see this as an impulse that movement would need to be a second wave correction, but second waves do not subdivide as triangles.
Primary wave 3 should have begun. Within it intermediate waves (1) and (2) should be complete. Intermediate wave (2) is a very common expanded flat correction.
The middle of this big third wave looks unlikely to have passed, so it is still ahead.
A cyan trend line is added to all charts. Draw it from the high in October 2012 to the high in July 2016. This line has been tested five times. Price is finding resistance at the cyan trend line now. If price can break through resistance here after some consolidation, then that may release energy to the upside for the end of minor wave 3.
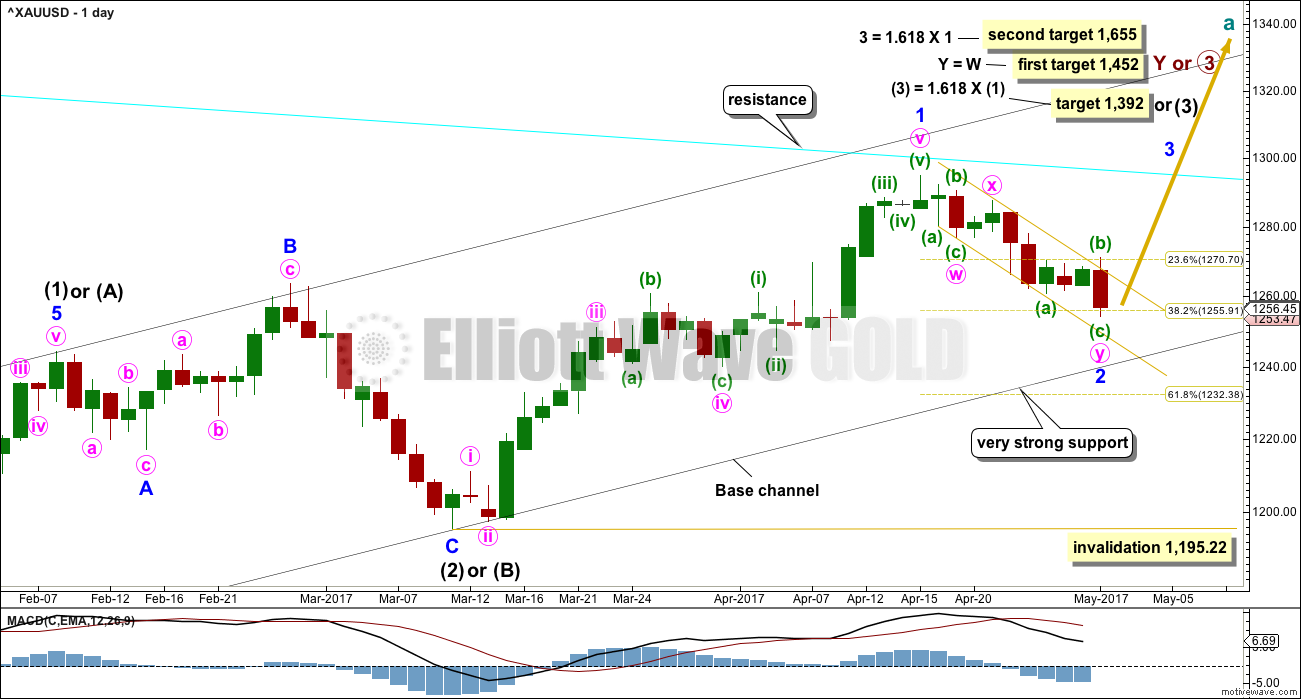
DAILY CHART
This daily chart will suffice for both weekly charts, which can be seen in the last published historic analysis.
Upwards movement at primary degree is either a third wave (first weekly chart) to unfold as an impulse, or a Y wave (second weekly chart) to unfold as a zigzag. If upwards movement is a zigzag for primary wave Y, then it would be labelled intermediate waves (A) – (B) and now (C) to unfold. It is most likely a third wave because cycle wave a is most likely to subdivide as an impulse.
Intermediate wave (1) or (A) is a complete five wave impulse lasting 39 days. Intermediate wave (2) or (B) looks like an expanded flat, which is a very common structure.
It is possible that minor wave 1 is over at the recent high and now minor wave 2 may be unfolding lower. If it gets down to the lower edge of the base channel, it should find very strong support there. If this wave count is correct, then price should not break below this trend line.
If the pullback does continue, then price may come down to touch the lower edge of the base channel. If that happens, it would offer us a gift of a very good entry point to join the upwards trend. If that happens, then members would be strongly advised to enter long with a stop just below the lower edge of the channel (give the market a little room to move and allow for overshoots).
Minor wave 2 may not move beyond the start of minor wave 1 below 1,195.22. However, if the base channel provides support, price should not get close to this invalidation point. Only if the base channel is breached by a full daily candlestick below and not touching the lower edge would a bearish wave count be considered.
The gold best fit channel about minor wave 2 is shown on the daily chart today, so that members may see how it is drawn.
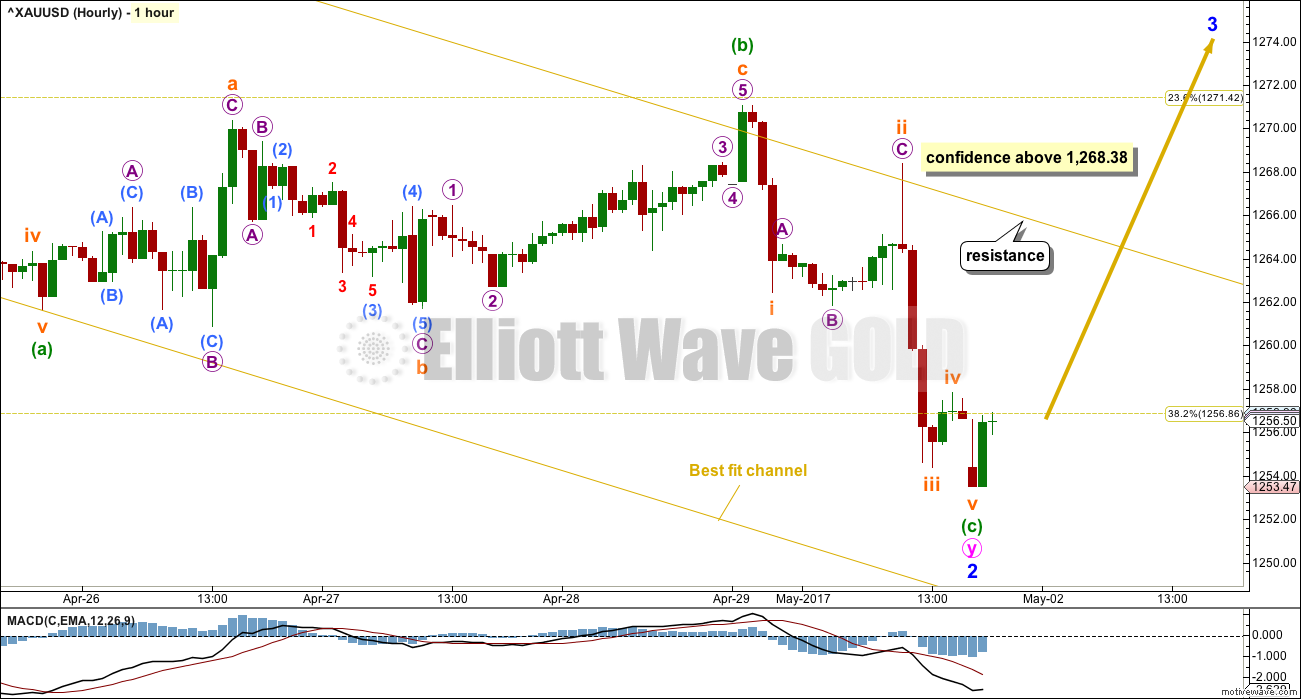
HOURLY CHART
Minor wave 2 may be a complete double zigzag. The second zigzag labelled minute wave y is now a complete structure. Within the zigzag, minuette wave (c) is just 1.47 longer than 0.618 the length of minuette wave (a).
If price breaks above the gold best fit channel with clear upwards movement, not sideways, that shall offer some confidence that a low is in place. A new high above 1,268.38 would offer further confidence.
Allow for the possibility that price could continue lower while it remains within the channel.
TECHNICAL ANALYSIS
WEEKLY CHART
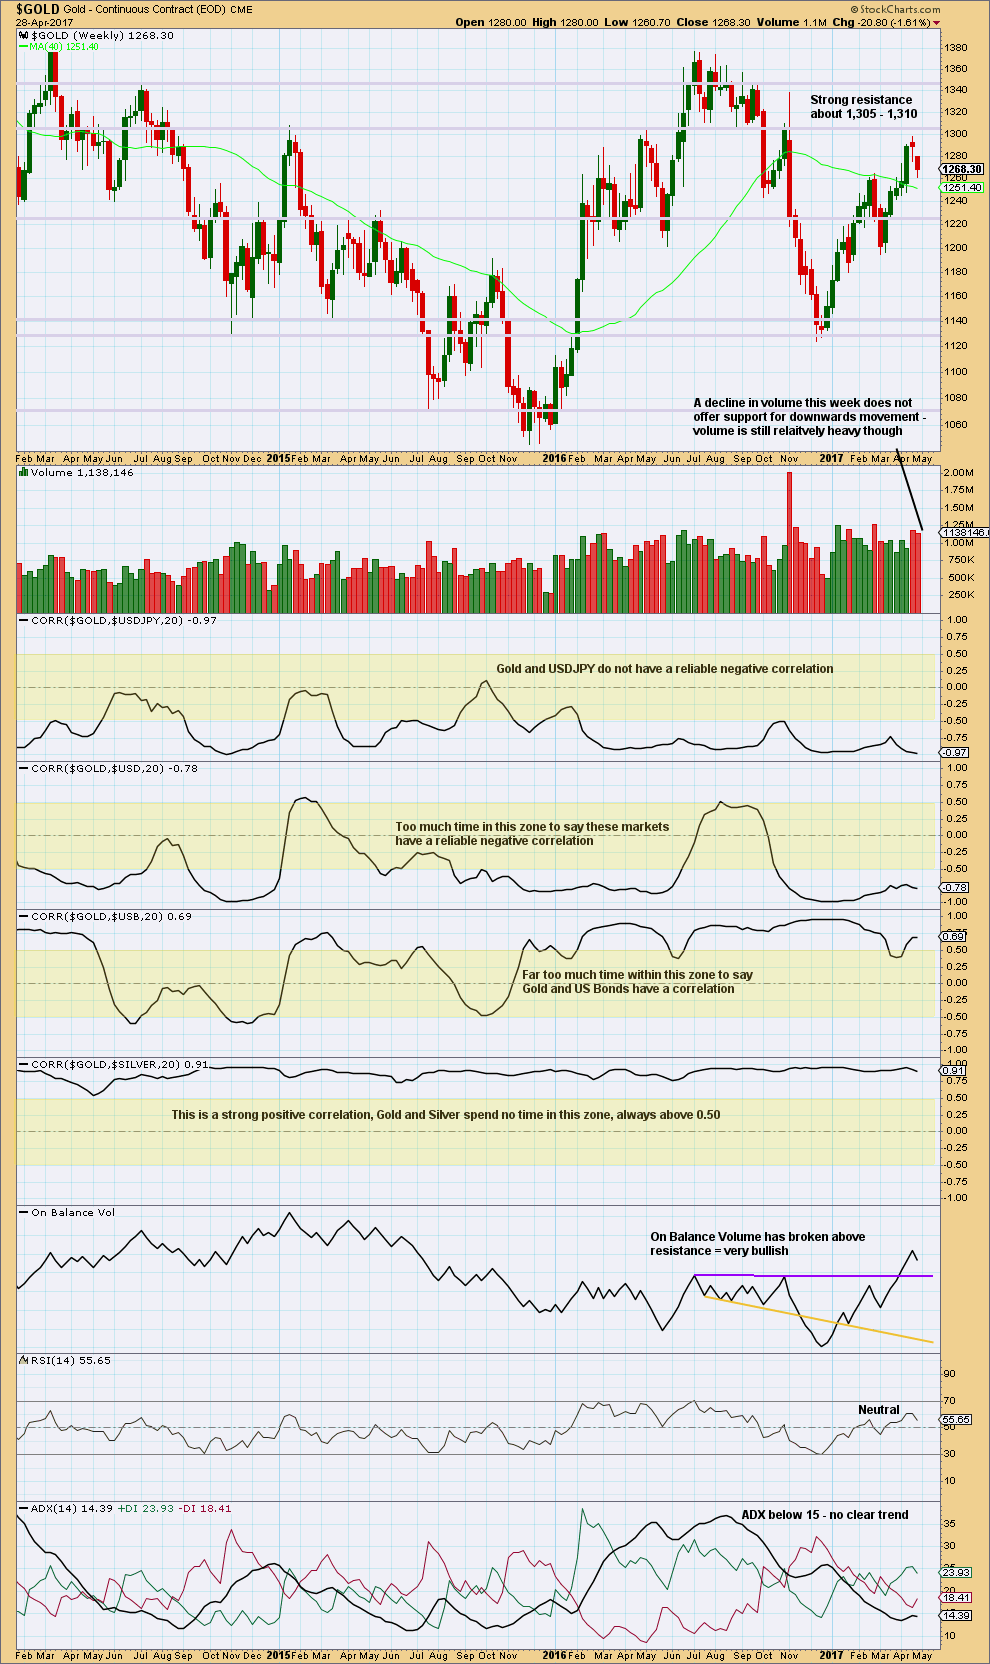
Click chart to enlarge. Chart courtesy of StockCharts.com.
There are a lot of assumptions out there about Gold and its relationships to various other markets. Happily, there is a quick and easy mathematical method to determine if Gold is indeed related to any other market: StockCharts have a “correlation” option in their indicators that shows the correlation coefficient between any selected market and the one charted.
The correlation coefficient ranges from -1 to 1. A correlation coefficient of 1 is a perfect positive correlation whereas a correlation coefficient of -1 is a perfect negative correlation.
A correlation coefficient of 0.5 to 1 is a strong positive correlation. A correlation coefficient of -0.5 to -1 is a strong negative correlation.
Any two markets which have a correlation coefficient that fluctuates about zero or spends time in the 0.5 to -0.5 range (shown by highlighted areas on the chart) may not be said to have a correlation. Markets which sometimes have a positive or negative correlation, but sometimes do not, may not be assumed to continue a relationship when it does arise. The relationship is not reliable.
For illustrative purposes I have included the correlation coefficient between Gold and Silver, which is what strong and reliable correlation should look like.
Volume for last week suggests the downwards movement is a pullback, and it may still continue further as volume remains fairly heavy.
Gold has made a series of higher highs and higher lows since the low in December 2016, the definition of an upwards trend. Assume the trend remains the same until proven otherwise.
This weekly chart still remains mostly bullish with some neutrality.
DAILY CHART
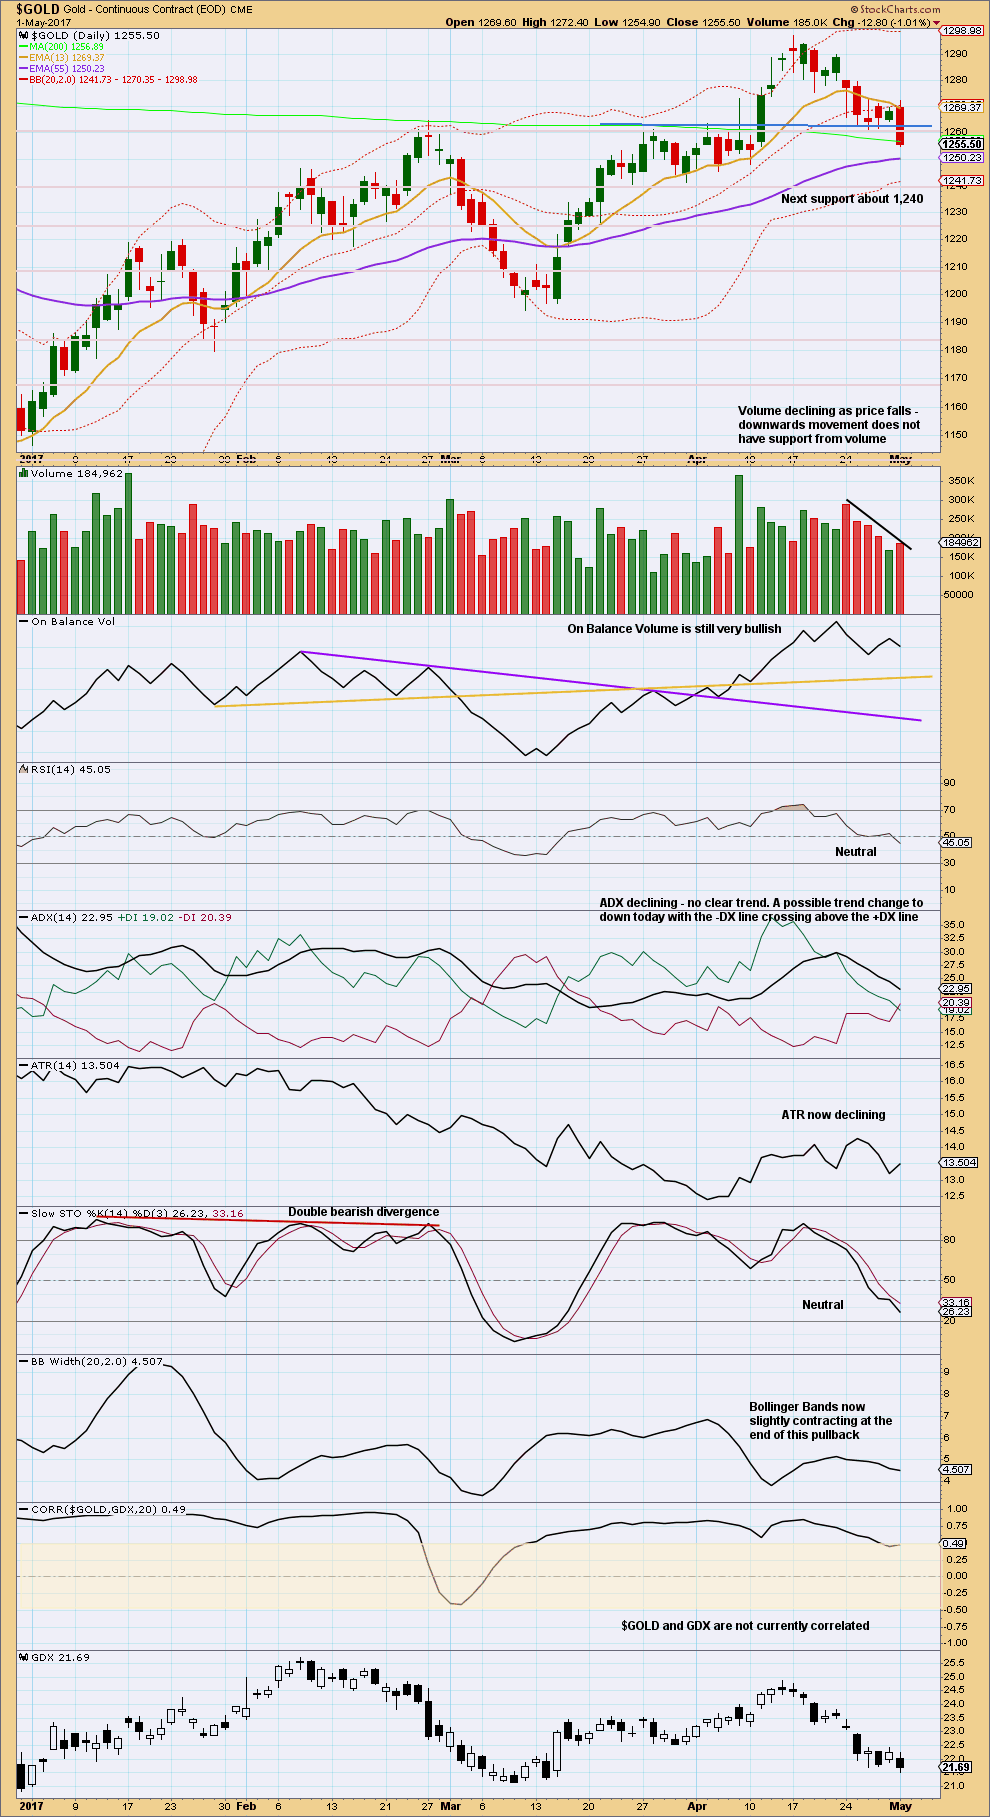
Click chart to enlarge. Chart courtesy of StockCharts.com.
Support about 1,260 – 1,265 has given way. However, volume for this downwards day is the lightest downwards day of this pullback. The decline in volume indicates that the downwards movement is a pullback and not likely a new trend.
Next support about 1,240 nicely coincides with the lower edge of the black base channel on the daily Elliott wave charts.
There is some short term divergence today with a new low for price and a higher low for On Balance Volume. This is bullish.
Bollinger Bands, ADX, ATR, and volume indicate this downwards movement is a pullback. This supports the Elliott wave count.
TRADING ADVICE
More adventurous members may like to enter long here for Gold. If entering a long position here, be prepared to have an underwater position for up to about three days. Stops may be set a little below 1,240.
Always follow my two Golden Rules for risk management.
1. Always use a stop.
2. Invest only 1-5% of equity on any one trade.
GDX
DAILY CHART
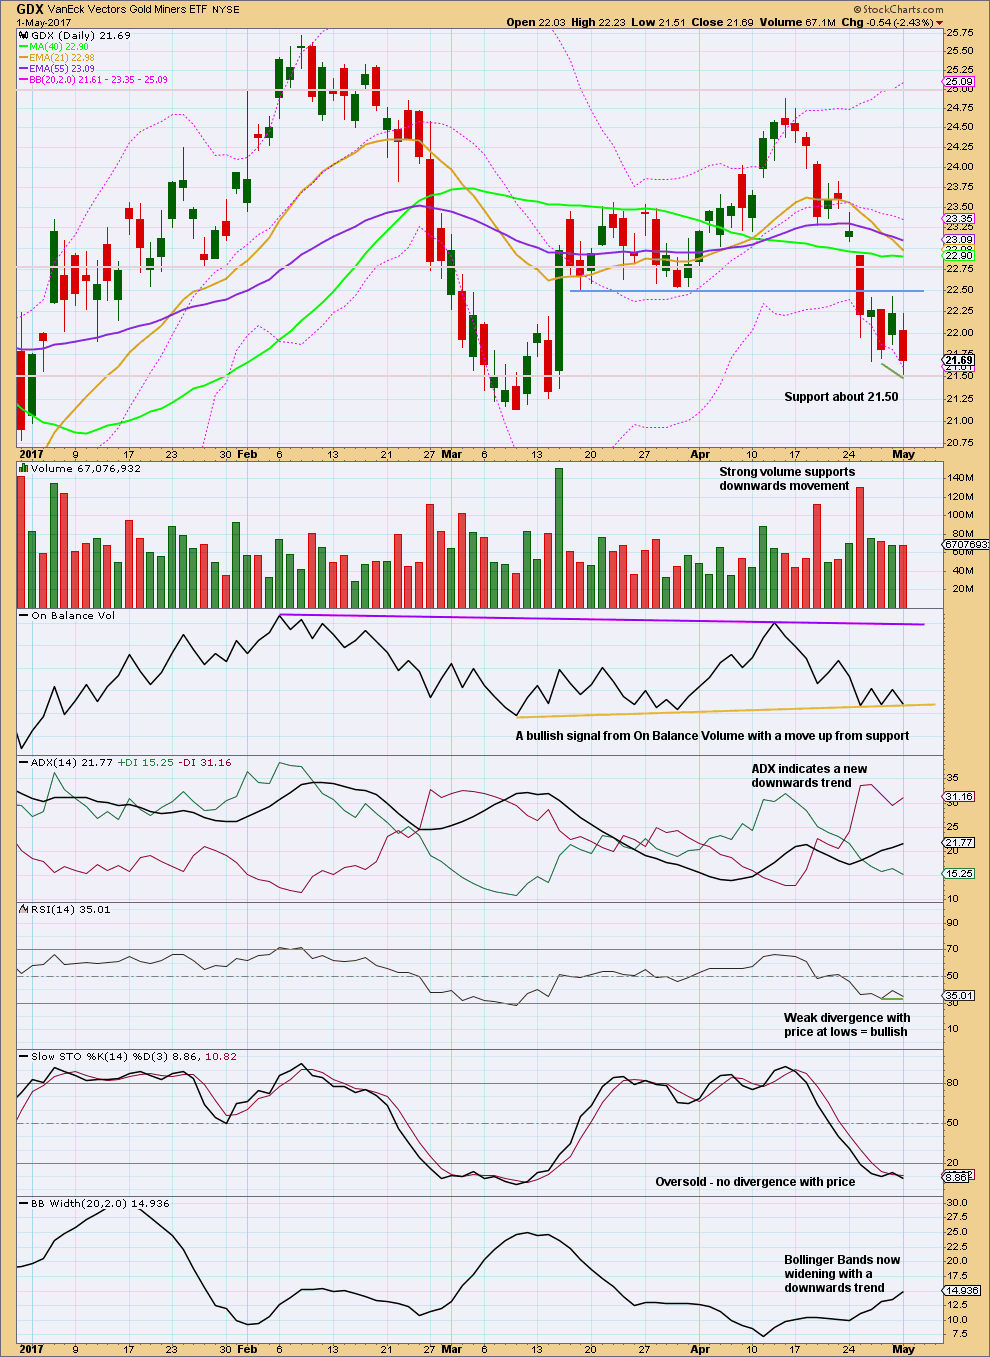
Click chart to enlarge. Chart courtesy of StockCharts.com.
There is some slight bullishness in this chart today.
Price and On Balance Volume are at support. RSI now exhibits single divergence with price at low to indicate weakness in downwards movement. Volume has been lighter and declining now for four sessions.
A low may be in place here or very soon for GDX.
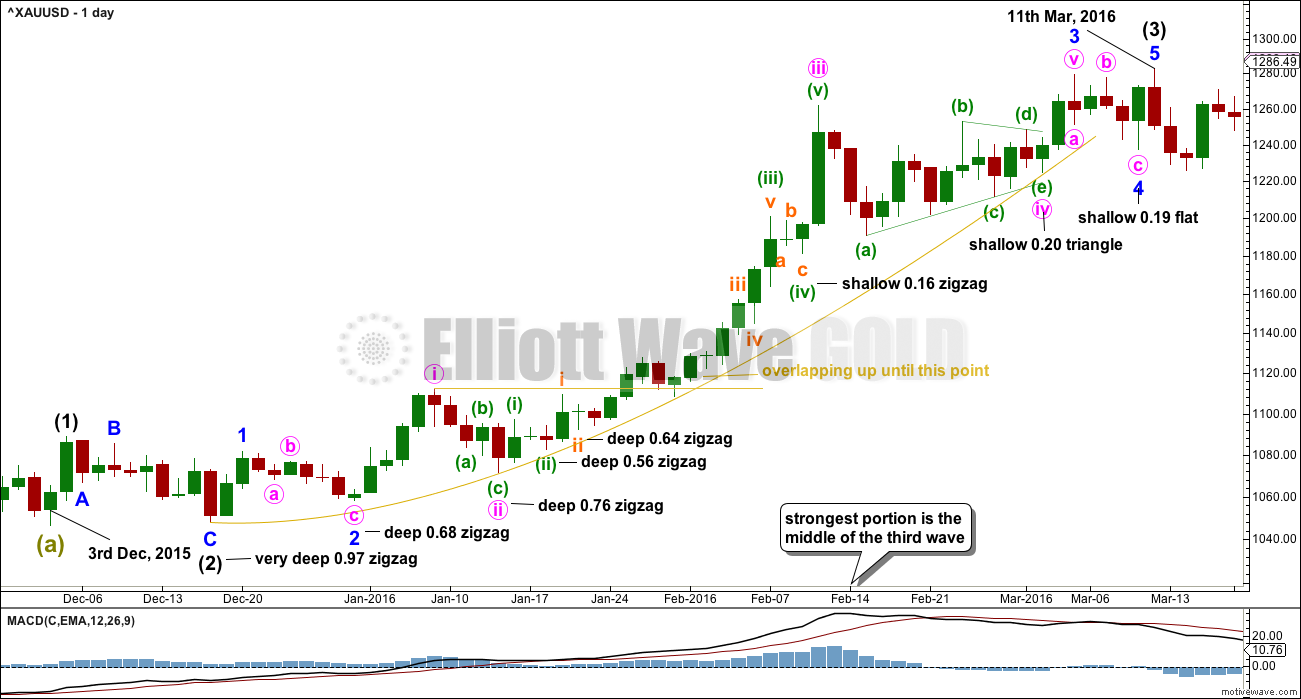
STUDY OF A THIRD WAVE IN $GOLD
This study of a third wave will be left in daily analysis until the current third wave is either proven to be wrong (invalidated) or it is complete.
This third wave spans 59 trading days.
It was not until the 40th day that the overlapping ended and the third wave took off strongly.
The middle of the third wave is the end of minute wave iii, which ended in a blow off top.
There is excellent alternation between second and fourth wave corrections.
This third wave began with a series of five overlapping first and second waves (if the hourly chart were to be added, it would be seven) before momentum really builds and the overlapping ends.
The fifth wave of minuette wave (v) is the strongest portion.
This third wave curves upwards. This is typical of Gold’s strong impulses. They begin slowly, accelerate towards the middle, and explode at the end. They do not fit neatly into channels. In this instance, the gold coloured curve was used.
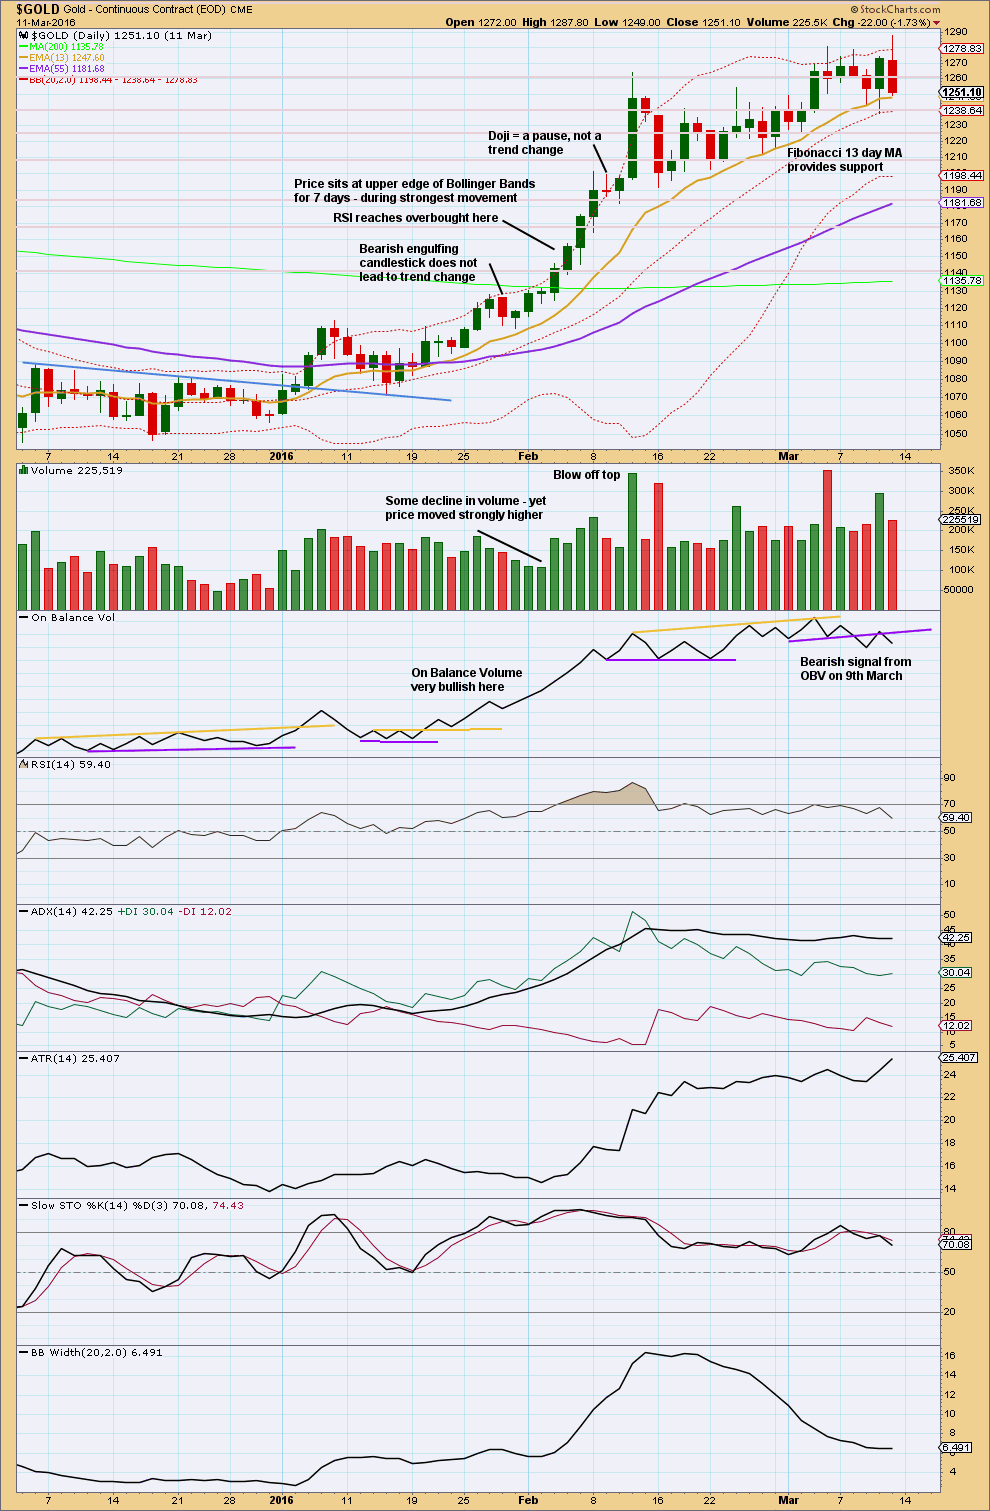
Click chart to enlarge. Chart courtesy of StockCharts.com.
This trend began after a long consolidation period of which the upper edge is bound by the blue trend line. After the breakout above the blue trend line, price curved back down to test support at the line before moving up and away.
RSI reaches overbought while price continues higher for another five days and RSI reaches above 85. The point in time where RSI reaches overbought is prior to the strongest upwards movement.
ADX reached above 35 on the 9th of February, but price continued higher for another two days.
The lesson to be learned here: look for RSI to be extreme and ADX to be extreme at the same time, then look for a blow off top. Only then expect that the middle of a big third wave is most likely over.
The end of this big third wave only came after the blow off top was followed by shallow consolidation, and more highs. At its end RSI exhibited strong divergence with price and On Balance Volume gave a bearish signal.
Third waves require patience at their start and patience at their ends.
This analysis is published @ 08:31 p.m. EST.

Do you recommend waiting to add to longs (gold) at either breakout or after FOMC from here? I have a beautiful harmonic ending here this AM at 1.618 at 1252.xx So I hope it’s an good entry yet with news tomorrow I guess anything can happen with stops but hope they are not too shallow.
US Oil will be updated later today everybody.
Volume supports this downwards movement. Looking good.
How sweet crude is!! 🙂
Oil breaking below a long held support shelf today. Things could get very interesting the next few days. Anybody made the APC trade?
I am rolling positions to day as the move to the downside should accelerate away from its own support shelf. That was one huge topping process! Yikes! 🙂
PS lol! I always end up posting over Lara…look at that time stamp…so sorry!
No worries Verne 🙂
Oil is looking good. The third wave still hasn’t moved below the first, so hold onto your shorts folks. This should keep going down for a bit yet…..
That reminds me of a quaint advert I saw on the side of an electrical contractor’s van recently:
“Let us remove you shorts!” 🙂
A triangle perhaps for subminuette wave iv?
If subminuette iv is over then subminuette v is now also over. And it was really quick and short. Again, the low may be possibly in. BUT we have no confirmation yet.
Today may close as a small doji, and it may be green with a lower wick. That would be pretty bullish if that happens.
In support of my analysis given below, I suggest that the trend is still bearish temporarily as price lies below both the tenkan and kijun lines, but remain above the (green) cloud. (If prices are below the green cloud, then it spells trouble: further drops ahead.) Cloud support is at 1245.95 and that is likely to be where prices are heading today.
Lara. Is it possible that the point labelled subminuette 5 of Minor 2 (1253.47) be actually only subminuette 3?
A possible count for subminuette 3 is 1268.38 – 1263.16 – 1264.11 – 1254.36 – 1257.82 – 1253.47. Currently undergoing a tortuous subminuette 4, a final drop would target the region nearer strong support at 1240.
Yes, I see that on the 5 minute chart. That would fit.
Look at all the interim bottoms. All have wicks. The bottom is likely not in until we get a wick and a reversal.
Update on Copper:
The prior downwards movement now fits only as a diagonal. Second wave corrections following first wave leading diagonals are normally very deep, deeper than the 0.618 Fibonacci ratio. So far minor 2 hasn’t lasted long enough nor is it deep enough to expect it is over.
Once there’s more structure within minor 2 I’ll draw a channel about it. We’ll then wait for the channel to be breached before entering short again.
Hi Lara,
what do you think about Silver, is this the time to buy?
I think either here or very soon indeed. Minor C has moved below minor A, avoiding a truncation, it could be over now. The lower maroon trend line is close, so if price does move lower it shouldn’t be below that line.
If entering long here be prepared to have an underwater position for up to about three days. Long term this may not be the perfect entry (or it could turn out to be) but it looks like it may be close.
Classic TA for Silver:
A good decline in volume is a bit bullish.
ADX and ATR support downwards movement, bearish.
RSI now oversold, but no divergence. Price could move a bit lower.
Only weak single divergence with price and Stochastics. Price could move a bit lower.
Simple is best.
More cautious traders may like to wait for Silver to break above this trend line on the hourly chart before entering long.
More adventurous traders may like to take a punt and enter long here.
Remember my two Golden Rules. Use a stop. A bit below about 16.45, give the market room to move, allow for a small overshoot of that maroon trend line (daily EW chart) but exit longs if that line is breached.
Invest only 1-5% of equity in any one trade. If entering long here perhaps only 1-3%, leave a bit of dry powder to add to the position if the channel is breached.
Things are pretty much going according to plan since last update:
> Gold – came down to back test support at the purple trend line
> Silver – made a new low
> GDX – continued weakness with overshoot of symmetrical triangle trend line. Would like to see a new low below 21.14
> USD – continues to consolidate below the neckline
Bottom likely by Wednesday, if not already
https://www.tradingview.com/x/VMHdh7sl/
Lots of short positions covered with the COT ledger just at about the 50 week average. Perhaps another day or two of sideways action before we get to rockin’
Thanks Lara!
You’re welcome Verne 🙂