
End of week analysis expected sideways or higher movement for the new week.
So far this is what is happening with Monday completing an upwards day that has not yet made a new high above last week’s high.
Summary: It looks like price may continue sideways or slowly higher towards a target about 1,276 (which may be too high). In the short term, a new low now below 1,257.50 would indicate the probability of sideways movement this week has increased. It is still least likely for Gold that a high is in place.
New updates to this analysis are in bold.
Last historic analysis with monthly charts is here, video is here.
Grand SuperCycle analysis is here.
MAIN ELLIOTT WAVE COUNT
For clarity I have decided at this time it may be best to publish on a daily basis weekly charts I, II and IV. Both weekly charts I and II expect a zigzag down to complete and the difference is in the expected depth. Weekly chart IV has a very low probability and will only be given serious consideration if price makes a new high above 1,294.96.
WEEKLY CHART I
Click chart to enlarge.
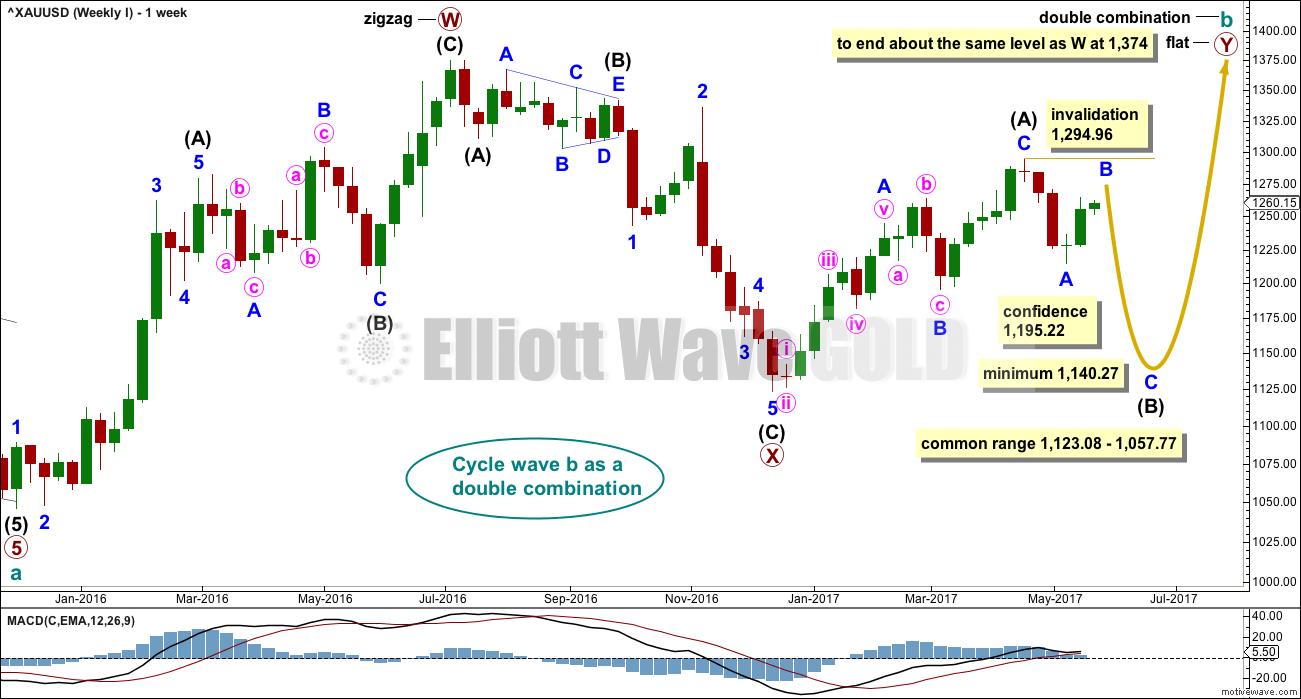
Combinations are very common structures. Cycle degree waves normally last one to several years, and B waves do tend to be more time consuming waves than all other waves. Given these tendencies the most likely scenario at this point may be that cycle wave b is an incomplete double combination.
The first structure in the double labelled primary wave W fits as a zigzag. This upwards movement will subdivide as either a three (zigzag) or a five (impulse). It does have a three wave look to it.
The double is joined by a deep three in the opposite direction labelled primary wave X, which is a 0.77 depth of primary wave W. X waves within double combinations are normally very deep; this one looks right.
The second structure in the combination may be either a triangle or a flat correction. Both of these structures have A waves which subdivide as threes.
At this stage, the upwards wave from the low in December 2016 does now look best and subdivide best as a completed zigzag. This may be intermediate wave (A) of a flat correction or a triangle. Because a triangle for primary wave Y would look essentially the same as the second weekly chart below, only a flat correction is considered here. The most common two structures in a double combination are a zigzag and a flat.
This wave count follows the most common scenario and has the best fit.
Within the flat correction of primary wave Y, intermediate wave (B) must retrace a minimum 0.9 length of intermediate wave (A) at 1,140.27. The most common length for intermediate wave (B) is from 1 to 1.38 times the length of intermediate wave (A), giving a common range from 1,123.08 to 1,057.77.
Intermediate wave (B) may subdivide as any corrective structure, but the most common structure for B waves within flats is a zigzag. At this stage, on the hourly chart it looks like a five down labelled minor wave A is complete, which would indicate intermediate wave (B) is a zigzag subdividing 5-3-5.
The daily and hourly charts will follow this weekly chart. That does not mean the other three weekly charts aren’t possible, they are, but the number of charts must be kept reasonable on a daily basis.
WEEKLY CHART II
Click chart to enlarge.
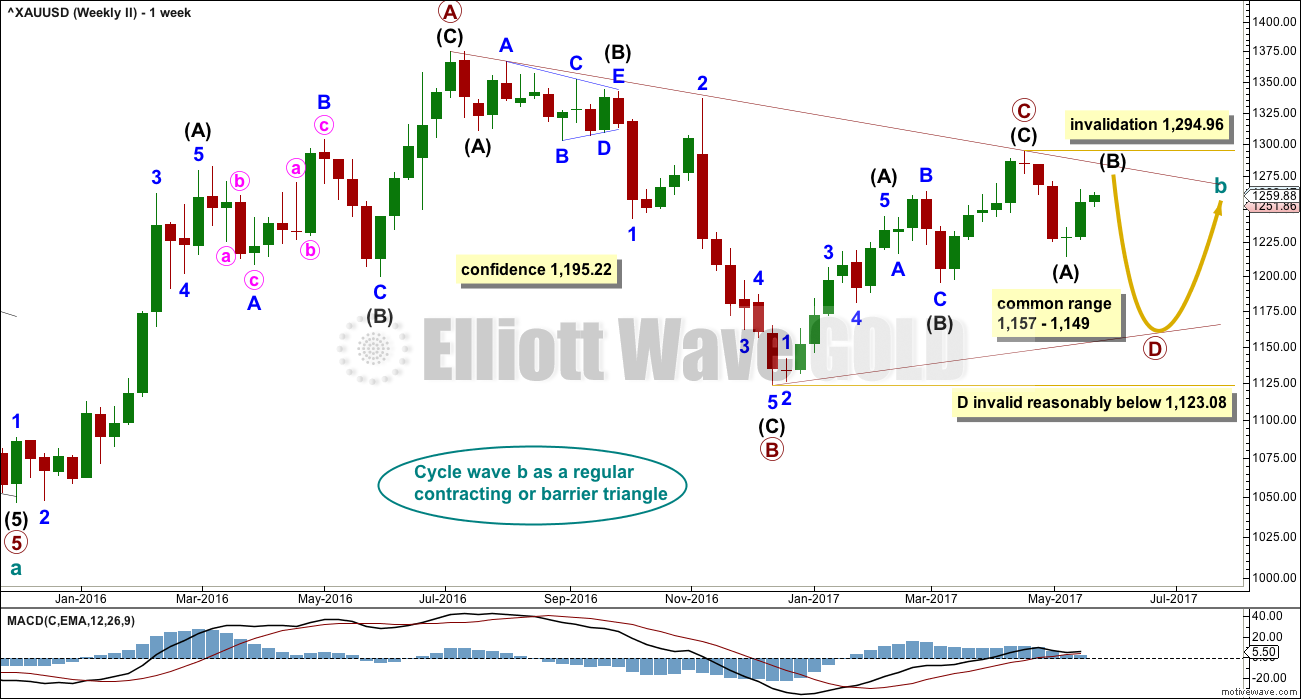
What if cycle wave b is a triangle? This is also entirely possible. Triangles are not as common as double combinations, but they are not uncommon.
Within the triangle, primary waves A, B and C are all single zigzags. One of the five subwaves of a triangle normally subdivides as a more complicated multiple, usually a double zigzag. This may be what is unfolding for primary wave D. It may also subdivide as a single zigzag.
Primary wave D of a regular contracting triangle may not move beyond the end of primary wave B below 1,123.08.
Primary wave D of a regular barrier triangle should end about the same level as primary wave B at 1,123.08, so that the B-D trend line is essentially flat. What this means in practice is that primary wave D may end slightly below 1,123.08 and the triangle would remain valid. This is the only Elliott wave rule which is not black and white.
Thereafter, primary wave E should unfold upwards and would most likely fall a little short of the A-C trend line. If not ending there, it may overshoot the A-C trend line.
At this stage, the structure on the hourly chart is still the same for both this weekly wave count and the first weekly wave count: a zigzag downwards is unfolding. However, they now diverge in how far down the next wave is expected to go. This second weekly wave count expects a more shallow movement to not end reasonably below 1,123.08.
DAILY CHART
Click chart to enlarge.
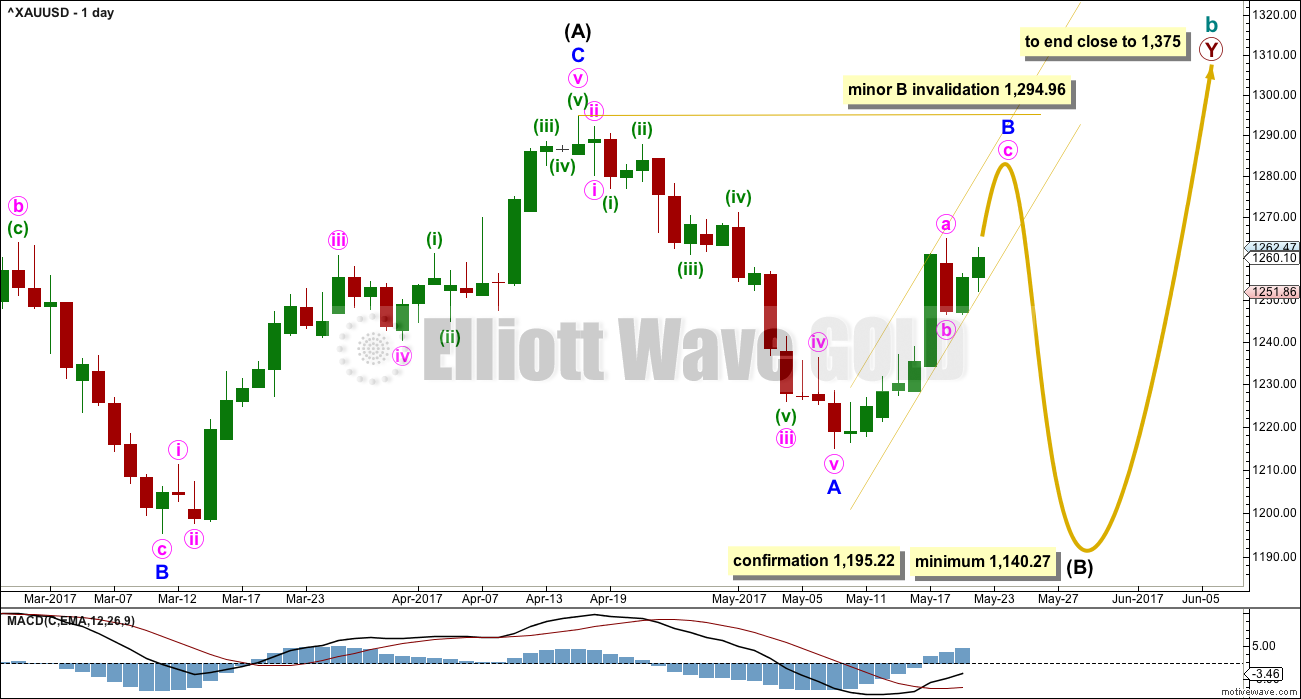
This daily chart will suffice for both weekly charts above, although the labelling follows weekly chart I.
Both weekly charts expect a zigzag downwards. (It may also turn out to be a double zigzag. For now a single only will be charted but a double will be kept in mind). Weekly chart I expects a deep zigzag for intermediate wave (B) to a minimum at 1,140.27. Weekly chart II expects a zigzag down for primary wave D to not move below 1,123.08 and most likely fall well short of that point.
The daily chart follows the expectations for weekly chart I, but the structure for weekly chart II would be exactly the same at this stage.
Within the flat correction of primary wave Y, intermediate wave (B) must retrace a minimum 0.9 length of intermediate wave (A) at 1,140.27. The most likely corrective structures to achieve the deep correction required for B waves within flats are single or multiple zigzags. These begin with a five, then a three in the opposite direction.
Minor wave A is complete. Minor wave B may be an incomplete zigzag. The first two hourly charts below look at how minor wave B may be completing. The third hourly chart below looks at the less likely possibility that minor wave B is over.
Minor wave B may not move beyond the start of minor wave A above 1,294.96.
HOURLY CHART
Click chart to enlarge.
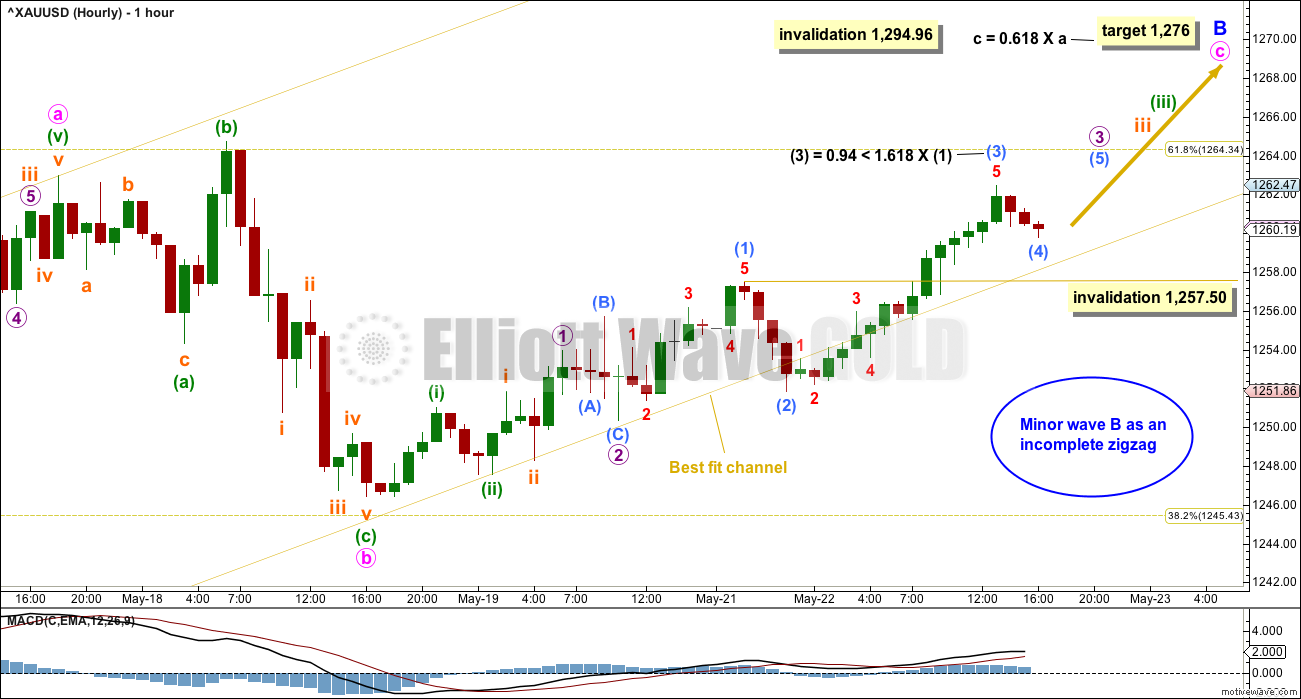
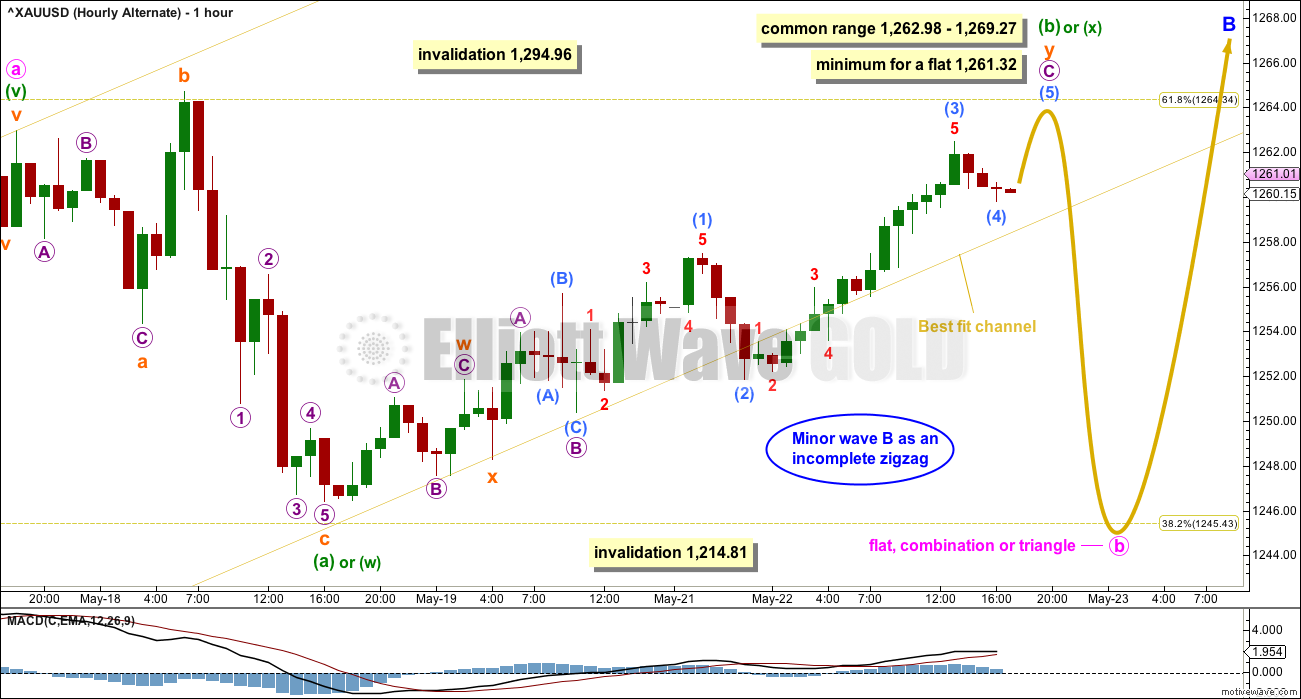
Minor wave B may be a simple and relatively quick zigzag. Within minor wave B, minute wave b may now be a complete expanded flat correction.
The lower edge of the best fit channel is pulled down very slightly to show where price found support along the way up during Friday’s session. While price has broken below the lower edge of the channel, it was not with convincing downwards movement and price quickly returned to within the channel. At this stage, while this is still labelled the main wave count, it is now judged to have an even probability with the next wave count below.
Minute wave c may be unfolding as an impulse. The middle of its third wave may have passed this Monday. There is a good Fibonacci ratio here.
It is possible that minuette wave (iii) may end with another blow off top. Gold often exhibits strong fifth waves to end its third wave impulses.
Sub micro wave (4) may not move into sub micro wave (1) below 1,257.50. If this hourly wave count is invalidated by movement below 1,257.50, at this stage it will be discarded in favour of the next hourly wave count below.
ALTERNATE HOURLY CHART
Click chart to enlarge.
It is also entirely possible that minute wave b is not over as a single, relatively quick, expanded flat correction. That may have been only minuette wave (a) within a continuing flat or triangle, or minuette wave (w) within a continuing double combination or double flat correction.
All these structures (flats, triangles, double combinations and double flats) are sideways movements (with the sole exception of expanded flats). If minute wave b is to continue sideways then it may be in choppy overlapping movement with a range of resistance about 1,265 and support about 1,245.
If minute wave b does continue sideways then it may be only at the end that the structure is clear. Labelling within it will change as the structure unfolds.
Because minute wave a looks very much like a five wave structure, minute wave b may not move beyond its start below 1,214.81.
Labelling of upwards movement from Friday’s low is exactly the same for both wave counts in terms of subdivisions. This wave count only requires one more slight high for sub micro wave (5) to complete minuette wave (b) or (x) as a double zigzag.
Minuette wave (b) has met the minimum requirement for a flat correction. It may now continue a little higher to reach up into its common range.
Thereafter, price may turn for a downwards swing within a consolidation. When the end of minuette wave (b) or (x) is known, then a target for minuette wave (c) or (y) may be calculated. That cannot be done yet.
ALTERNATE HOURLY CHART II
Click chart to enlarge.
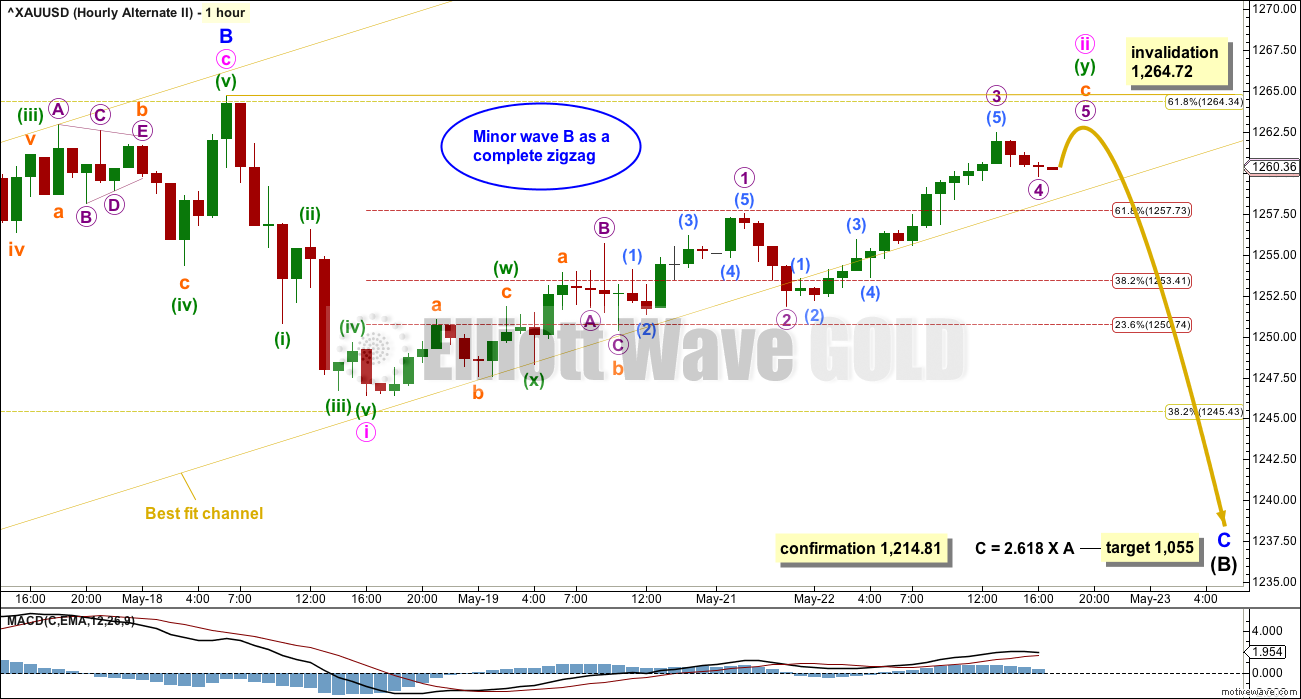
It is also still possible, but less likely, that minor wave B is over as a very quick and sharp zigzag.
B waves exhibit a huge variety in structure and price behaviour. It is important to consider all possibilities when B waves unfold.
Minor wave C downwards must subdivide as a five wave structure, either an impulse (more common) or an ending diagonal (less common). So far, with what looks like a fairly clear five down for minute wave i, it looks like minor wave C may be an impulse.
The second wave may not move beyond the start of the first wave within both an impulse and diagonal. This wave count would be invalidated with a new high above 1,264.72.
A new low below 1,214.81 would invalidate the first two hourly charts and provide price confirmation of this second alternate wave count.
WEEKLY CHART IV
Click chart to enlarge.
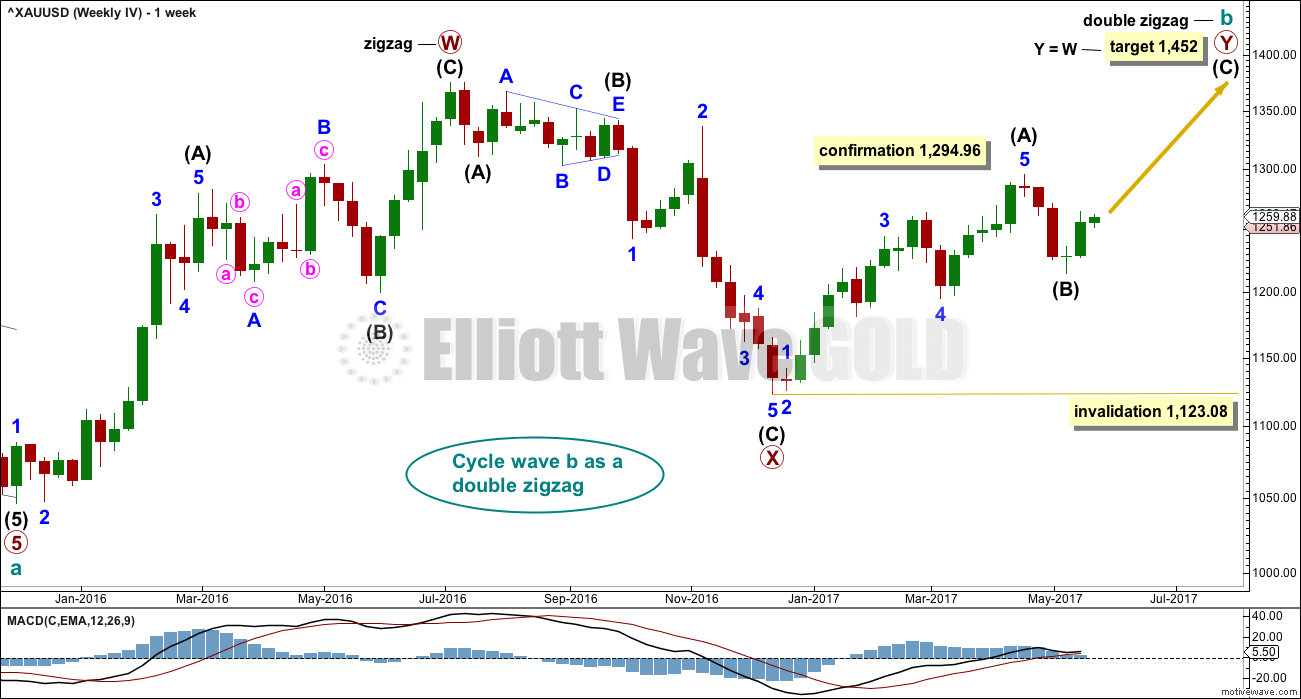
What if the bull market beginning in December 2015 remains intact? Price has essentially been moving sideways since that date, so all possibilities should be considered.
The Morning Doji Star at the low labelled intermediate wave (B) will not be considered as a reversal pattern here because it comes in what is essentially a sideways movement. It does not come after a downwards wave, so there is nothing to reverse.
This wave count requires confirmation above 1,294.96. That would invalidate the first three weekly charts (the third is seen in historic analysis only).
It is possible that cycle wave b is continuing higher as a double zigzag. However, double zigzags normally have brief and shallow X waves. The purpose of the second zigzag in a double (and the third when there is one) is to deepen the correction when price does not move deep enough in the first (or second) zigzag. Thus double (and triple) zigzags normally have a strong and clear slope against the prior trend. To achieve this look their X waves normally are brief and shallow.
In this case, primary wave X is neither brief nor shallow. It is a 0.77 depth of primary wave W and lasted 0.74 the duration of primary wave W. Overall, this does not have a typical look of a double zigzag so far.
This wave count also must see the rise up to the high labelled intermediate wave (A) as a five wave impulse, not a three wave zigzag. This looks a little forced, so it reduces the probability of this wave count.
This wave count should only be used if confirmed with a new high above 1,294.96. Low probability does not mean no probability, but should always be given less weight until proven.
TECHNICAL ANALYSIS
WEEKLY CHART
Click chart to enlarge. Chart courtesy of StockCharts.com.
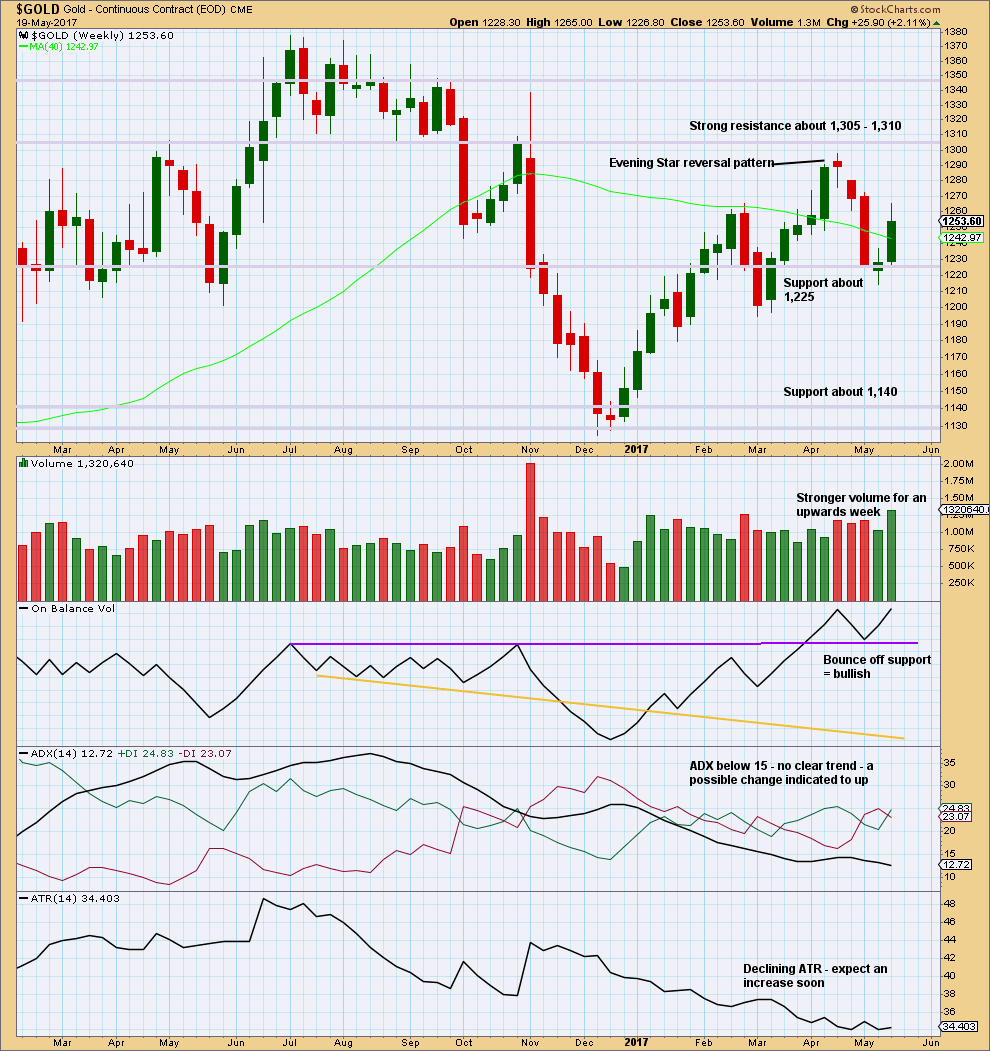
Volume this week strongly supports upwards movement. This is bullish.
Since the low in December 2017, price has still made higher highs and higher lows. This upwards trend would be indicated as possibly over only if price makes a new low below 1,194.50.
On Balance Volume is bullish.
ADX and ATR both indicate an unclear and weak trend.
DAILY CHART
Click chart to enlarge. Chart courtesy of StockCharts.com.
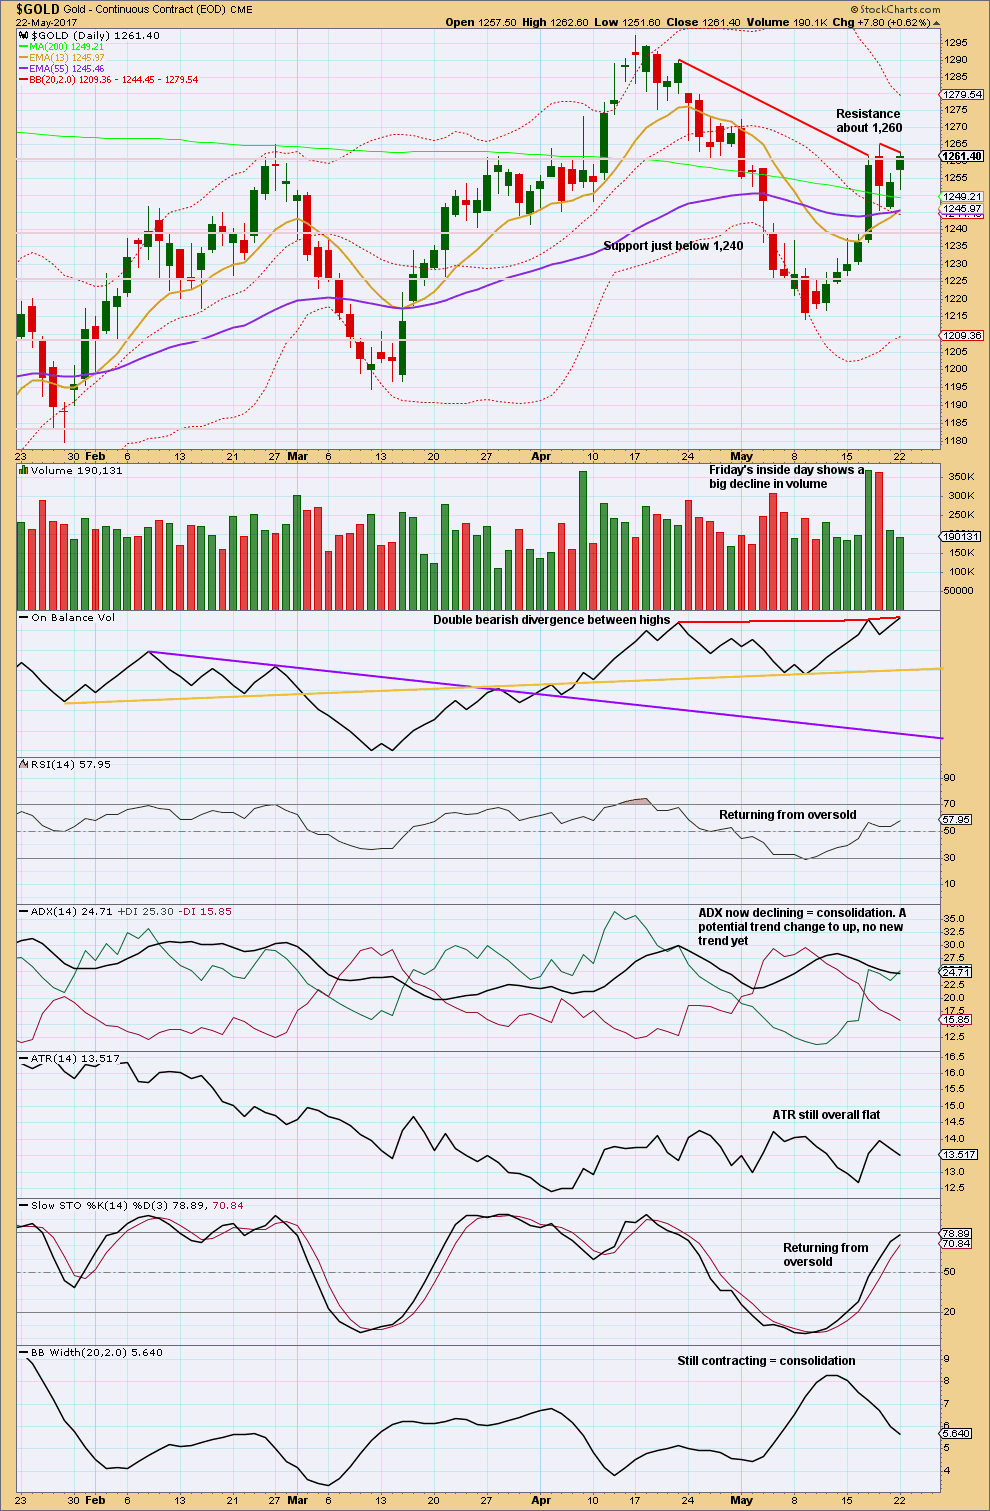
Monday is an upwards day with a long lower wick, which is bullish. However, upwards movement does not have support from volume. This may be a part of a small consolidation.
There is now double bearish divergence between price and On Balance Volume. This would support the alternate hourly wave counts, with the second alternate having more support.
There is room for price to move a little higher first before turning. Stochastics is not yet overbought. Next resistance would be about 1,295.
The short term Fibonacci 13 day moving average is now sitting on the mid term Fibonacci 55 day moving average. Both have positive slopes indicating price is in a short and mid term bull trend.
GDX
DAILY CHART
Click chart to enlarge. Chart courtesy of StockCharts.com.
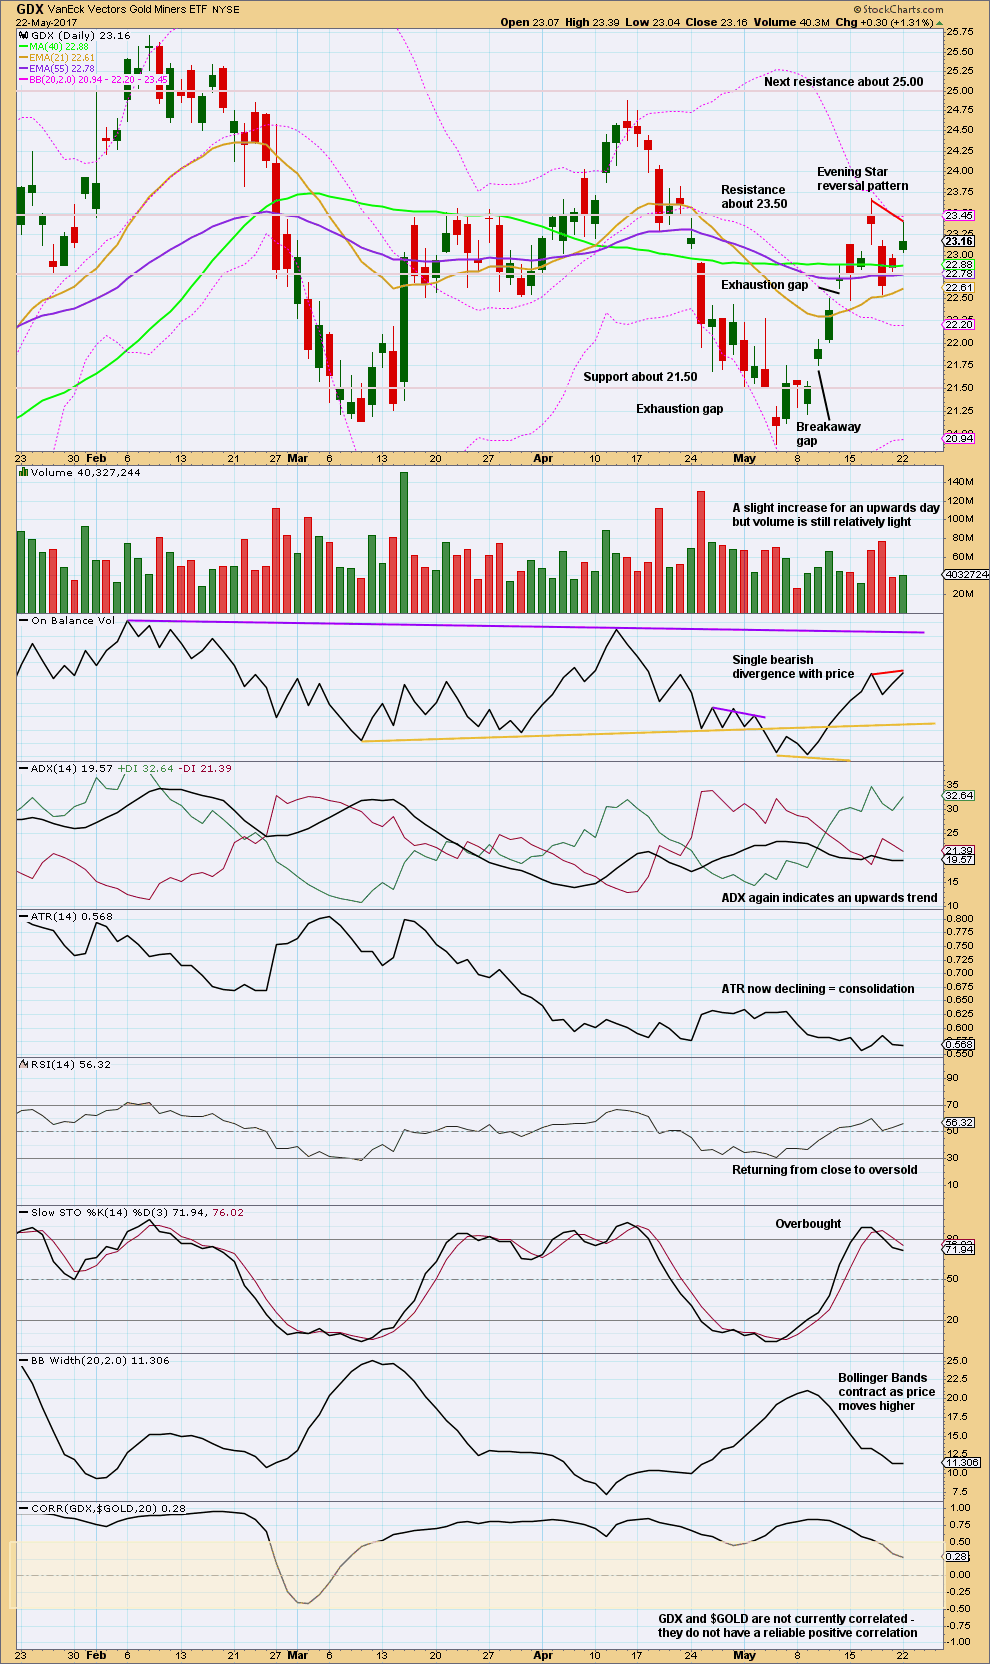
The Evening Star candlestick pattern is supported by heavier volume on the last candlestick. This supports the idea of a high in place now for GDX.
Bollinger Bands expand when markets trend and contract when they consolidate. With the bands contracting as price has moved higher, it looks like this is a counter trend movement. It may now be over.
Monday moved price higher with a very slight increase in volume, but not much. Volume is slightly bullish. The long upper wick is bearish.
Divergence with price and On Balance Volume today is bearish.
Stochastics also suggests a high is in place for GDX.
GDX is a bit more clearly bearish than Gold.
Please note: GDX and $GOLD do not currently have a correlation. We cannot assume that because GDX is bearish that Gold must move downwards from here. The math proves that assumption to be wrong.
This analysis is published @ 06:28 p.m. EST.
It looks like the first alternate count is the one today. Minute b may be continuing sideways within minor wave B.
If this count is correct then price is within a B wave of a B wave. This is the absolute worst opportunity for trading, most traders should step aside and wait patiently for the breakout or set up a hedge.
For very experienced traders only they may choose to trade the small waves of a consolidation using a swing system; support and resistance along with Stochastics (or your preferred oscillator) to show where one swing ends and the other begins. Sounds simple but the risk is high. Price doesn’t always turn neatly at support or resistance, it can overshoot sometimes by a fairly large margin. Losses are inevitable, the trick is to get profits larger than them.
At this stage minute b may still be either a regular flat, combination or triangle. All three options have a close to even probability and so it is still impossible for me to tell you with any reasonable confidence exactly how price will move in this consolidation.
I will still need multiple hourly counts. The focus will be on finding when minute b is over, not on trying to tell you exactly what move next price will take. Because I just can’t do that well enough for anyone to profit from it.
Consider setting a hedge; open the short when price is high and the long when price is low. That way losses are minimised. I’ll be looking to open a long side of a hedge later today. Then a short possibly tomorrow if I still can’t see minute b complete. If I can see it complete, then I may just hold the long to ride minute c up.
Here is good article on the judicious application of moving averages, and why it is always a good idea to reference multiple indicators before being confident of likely price direction.
I found this article quite useful as I am a big fan of moving averages and it was good to be reminded that nothing is ever 100% certain.
https://www.investing.com/analysis/gold:-another-useless-golden-cross-signal-200190933
Many thanks for posting the above link. A mini ‘Golden Cross’ just occurred as far as I am concerned – we got a break below Monday low hurray! lol… To look out for, a break below 1248 for 1243… lets go bears! Lets see how this closes, have a fine day. Bye.
Eur/USD is now correlated to Gold/USD. The market is still good for stocks. That is only possible for a short term. Something will happen. I guess now the alternate hourly 1 is in play!?
The golden cross, which Dreamer pointed out and which I was watching with great interest, may be turned back by today’s developing bearish engulfing candle- possible completion of a right shoulder?
For Gold contract month Jun ’17 (GCM17) there is no Golden Cross (yet) with 50dma at 1252.4 and 200dma at 1254.4…. Glass half full or glass half empty; six of one, half a dozen of the other….
Ichimoku Daily Analysis
Data as at close May 22
====================
Gold price rose steadily to a high of 1263.71 before a slight pullback into market close. The picture is a wee bit rosier, with half the daily candle lying outside of the top of the cloud boundary. The bull is raring to go, but not quite yet. Restraining it is the tenkan-sen still stubbornly lying below the kijun-sen.
I expect prices to grind slowly higher today, hugging the cloud contour, unless the candle dipped back into the cloud. The upside resistance remains at the 1265 area. If that area is not taken out, a pullback may occur. Supports there are plenty: the top cloud boundary at 1261.40; the kijun-sen at 1255.85; the bottom cloud boundary at 1245.95; the tenkan-sen at 1240.95. The last line of defence is given by the brown support line.
Not much transpired at the intraday level. An update will be provided should something interesting happens.
Thanks for the update.
Need see the kijun-sen higher than tenkan-sen for bull trend.