
Sideways or slowly higher movement was expected. Tuesday has completed an outside day and Gold appears to be developing a small trading range with resistance about 1,265 and support about 1,245.
Summary: Price is consolidating. Another one to few days of sideways movement may be followed by a short sharp upwards wave, a false upwards breakout. That may complete minor wave B next week.
New updates to this analysis are in bold.
Last historic analysis with monthly charts is here, video is here.
Grand SuperCycle analysis is here.
MAIN ELLIOTT WAVE COUNT
For clarity I have decided at this time it may be best to publish on a daily basis weekly charts I, II and IV. Both weekly charts I and II expect a zigzag down to complete and the difference is in the expected depth. Weekly chart IV has a very low probability and will only be given serious consideration if price makes a new high above 1,294.96.
WEEKLY CHART I
Click chart to enlarge.
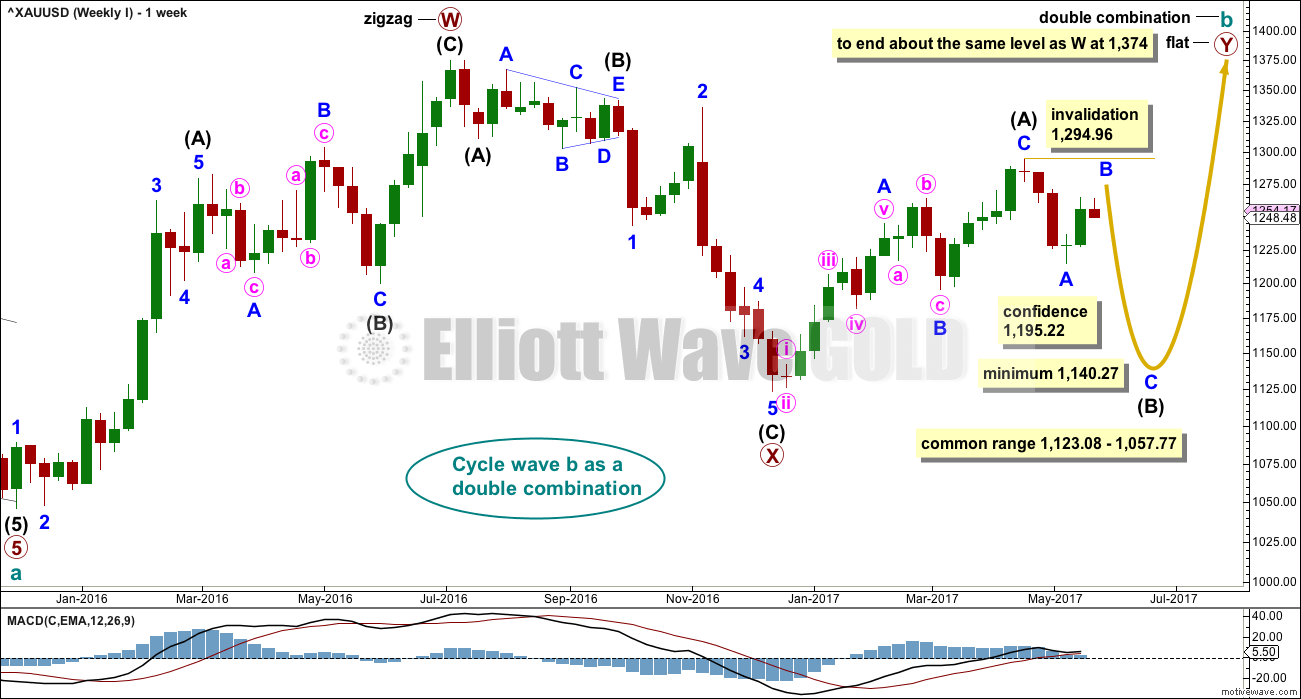
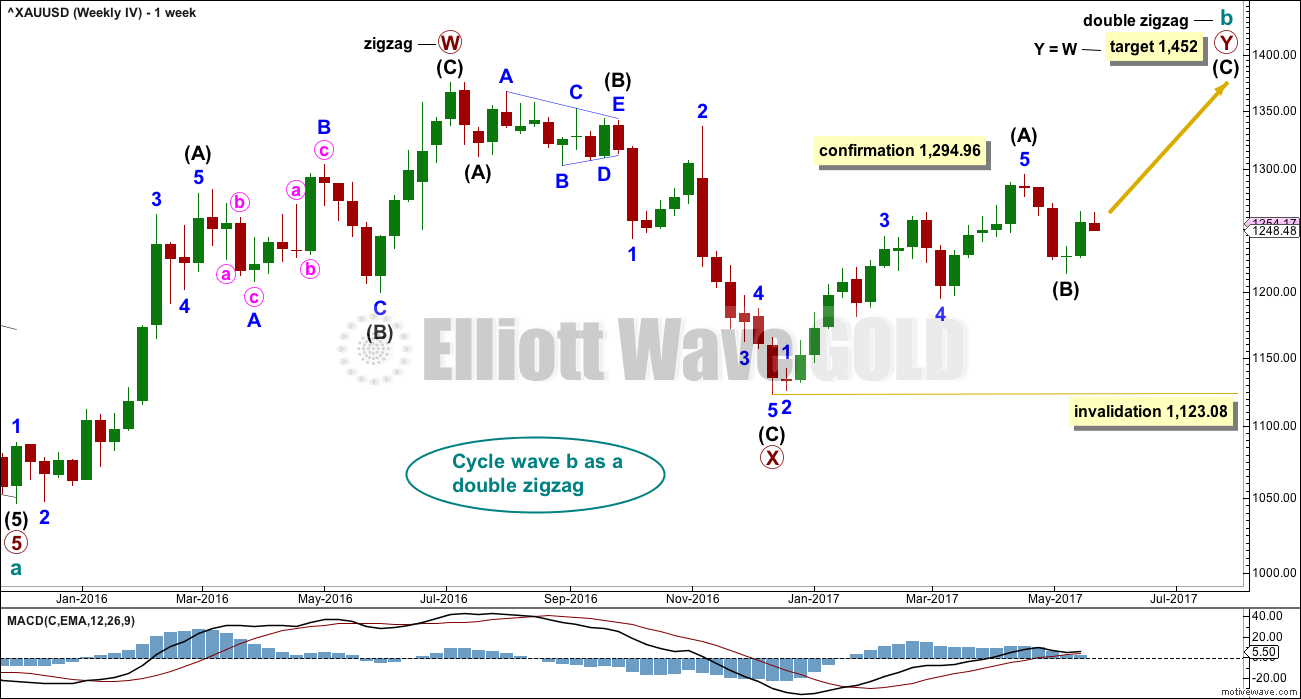
Combinations are very common structures. Cycle degree waves normally last one to several years, and B waves do tend to be more time consuming waves than all other waves. Given these tendencies the most likely scenario at this point may be that cycle wave b is an incomplete double combination.
The first structure in the double labelled primary wave W fits as a zigzag. This upwards movement will subdivide as either a three (zigzag) or a five (impulse). It does have a three wave look to it.
The double is joined by a deep three in the opposite direction labelled primary wave X, which is a 0.77 depth of primary wave W. X waves within double combinations are normally very deep; this one looks right.
The second structure in the combination may be either a triangle or a flat correction. Both of these structures have A waves which subdivide as threes.
At this stage, the upwards wave from the low in December 2016 does now look best and subdivide best as a completed zigzag. This may be intermediate wave (A) of a flat correction or a triangle. Because a triangle for primary wave Y would look essentially the same as the second weekly chart below, only a flat correction is considered here. The most common two structures in a double combination are a zigzag and a flat.
This wave count follows the most common scenario and has the best fit.
Within the flat correction of primary wave Y, intermediate wave (B) must retrace a minimum 0.9 length of intermediate wave (A) at 1,140.27. The most common length for intermediate wave (B) is from 1 to 1.38 times the length of intermediate wave (A), giving a common range from 1,123.08 to 1,057.77.
Intermediate wave (B) may subdivide as any corrective structure, but the most common structure for B waves within flats is a zigzag. At this stage, on the hourly chart it looks like a five down labelled minor wave A is complete, which would indicate intermediate wave (B) is a zigzag subdividing 5-3-5.
The daily and hourly charts will follow this weekly chart. That does not mean the other three weekly charts aren’t possible, they are, but the number of charts must be kept reasonable on a daily basis.
WEEKLY CHART II
Click chart to enlarge.
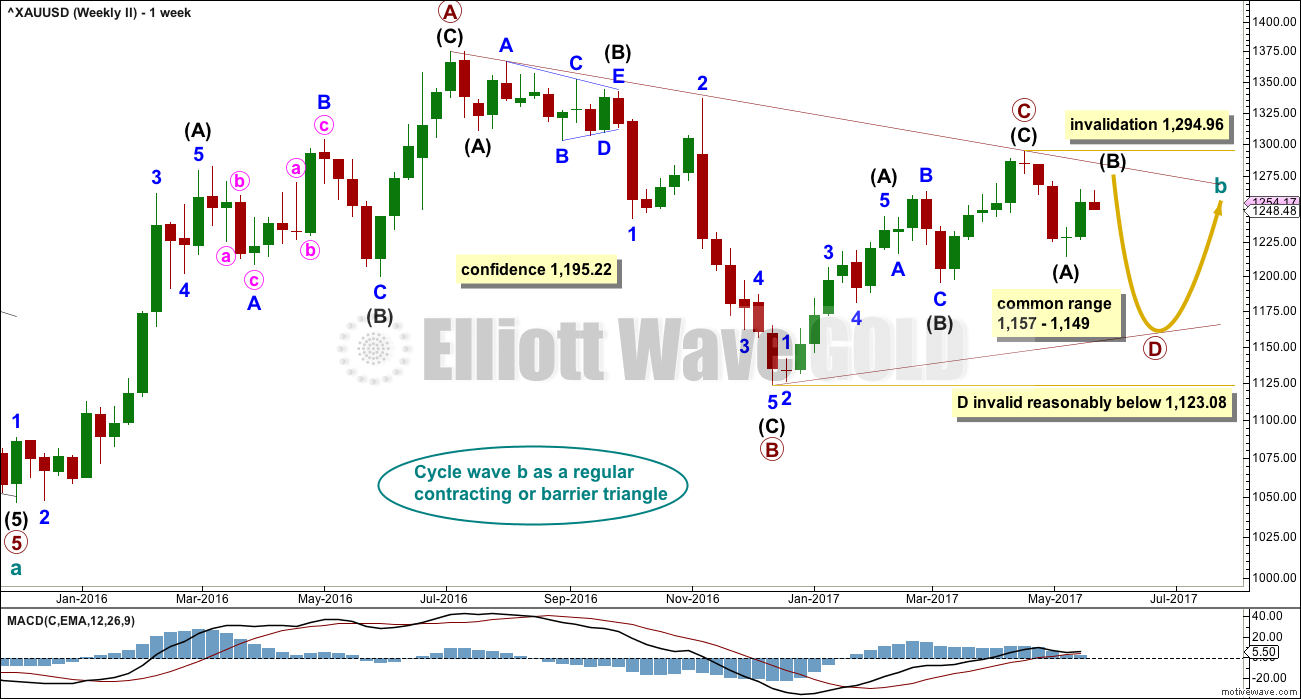
What if cycle wave b is a triangle? This is also entirely possible. Triangles are not as common as double combinations, but they are not uncommon.
Within the triangle, primary waves A, B and C are all single zigzags. One of the five subwaves of a triangle normally subdivides as a more complicated multiple, usually a double zigzag. This may be what is unfolding for primary wave D. It may also subdivide as a single zigzag.
Primary wave D of a regular contracting triangle may not move beyond the end of primary wave B below 1,123.08.
Primary wave D of a regular barrier triangle should end about the same level as primary wave B at 1,123.08, so that the B-D trend line is essentially flat. What this means in practice is that primary wave D may end slightly below 1,123.08 and the triangle would remain valid. This is the only Elliott wave rule which is not black and white.
Thereafter, primary wave E should unfold upwards and would most likely fall a little short of the A-C trend line. If not ending there, it may overshoot the A-C trend line. Primary wave E may not move beyond the end of primary wave C above 1,294.96.
At this stage, the structure on the hourly chart is still the same for both this weekly wave count and the first weekly wave count: a zigzag downwards is unfolding. However, they now diverge in how far down the next wave is expected to go. This second weekly wave count expects a more shallow movement to not end reasonably below 1,123.08.
DAILY CHART
Click chart to enlarge.
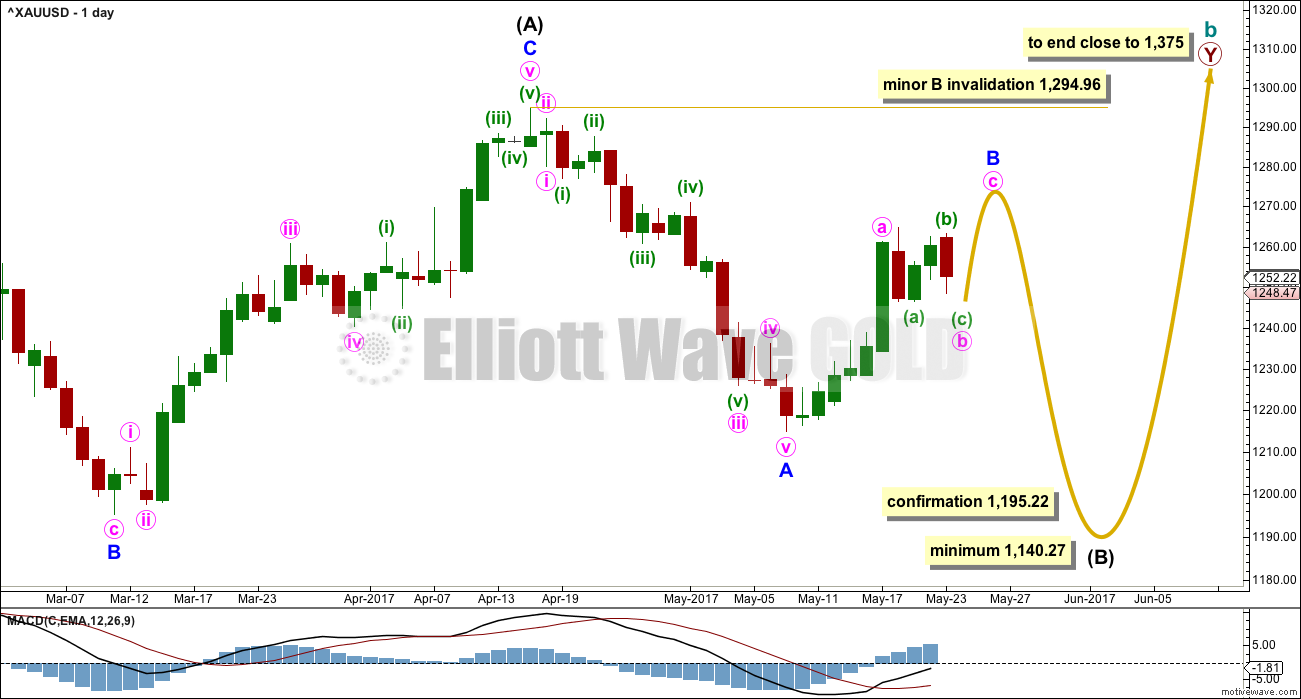
This daily chart will suffice for both weekly charts above, although the labelling follows weekly chart I.
Both weekly charts expect a zigzag downwards. (It may also turn out to be a double zigzag. For now a single only will be charted but a double will be kept in mind). Weekly chart I expects a deep zigzag for intermediate wave (B) to a minimum at 1,140.27. Weekly chart II expects a zigzag down for primary wave D to not move below 1,123.08 and most likely fall well short of that point.
The daily chart follows the expectations for weekly chart I, but the structure for weekly chart II would be exactly the same at this stage.
Within the flat correction of primary wave Y, intermediate wave (B) must retrace a minimum 0.9 length of intermediate wave (A) at 1,140.27. The most likely corrective structures to achieve the deep correction required for B waves within flats are single or multiple zigzags. These begin with a five, then a three in the opposite direction.
Minor wave A is complete. Minor wave B may be an incomplete zigzag. At this stage, the most likely wave count would see minute wave b continuing sideways. Three different hourly charts are provided for three different structural possibilities for minute wave b. The last, alternate hourly chart, looks at the least likely possibility that minor wave B is already over.
Minor wave B may not move beyond the start of minor wave A above 1,294.96.
HOURLY CHART
Click chart to enlarge.
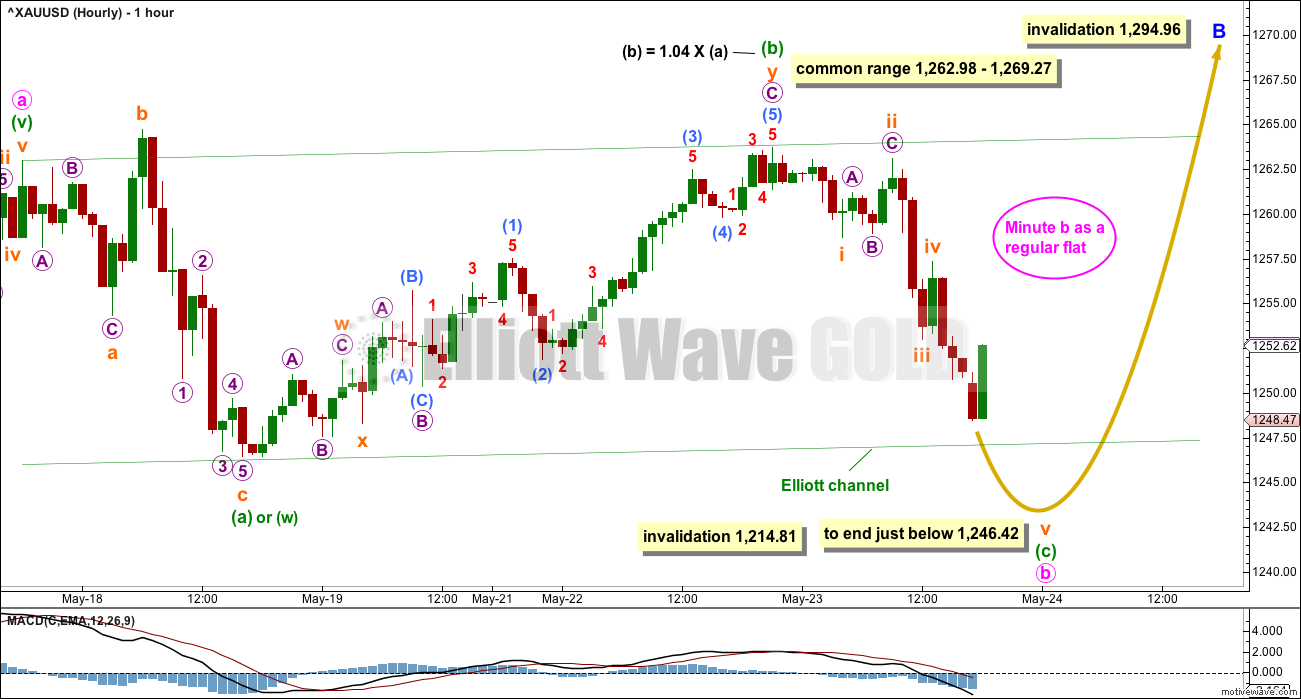
Minute wave b may be continuing sideways as a flat correction.
For this idea minuette wave (b) would be a 1.04 length of minuette wave (a) indicating a regular flat correction. Regular flats normally have C waves which end only a little beyond the end of their A waves. Minuette wave (c) would be expected to end at least slightly beyond the end of minuette wave (a) below 1,246.42 to avoid a truncation and a very rare running flat.
Minuette wave (c) may end with an overshoot of the Elliott channel.
Thereafter, an upwards wave for minute wave c would be required to complete the zigzag of minor wave B.
HOURLY CHART I
Click chart to enlarge.
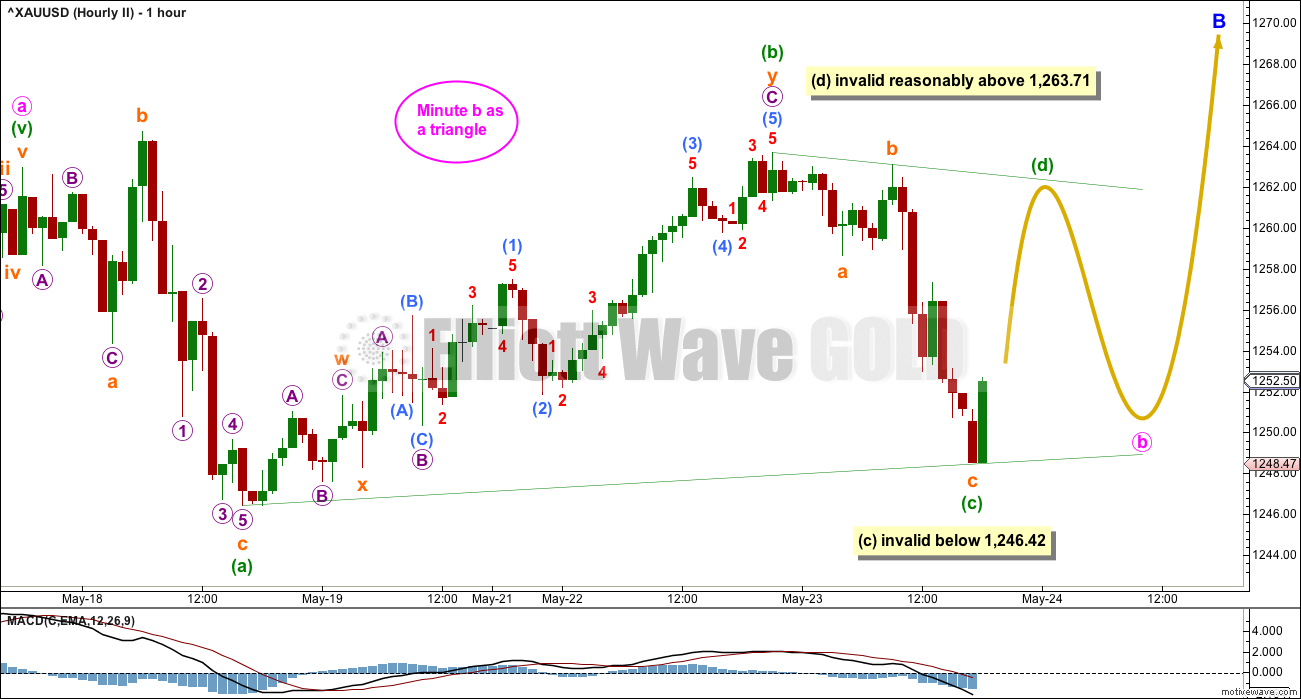
Minute wave b may be continuing sideways as a running contracting or barrier triangle.
Within a triangle, all sub-waves must subdivide as threes and four of the five sub-waves must be zigzags or zigzag multiples. Only one of the five sub-waves may be a more complicated multiple. So far minuette wave (b) may be the double zigzag. All remaining triangle sub-waves must be simple A-B-C structures.
Minuette wave (c), if it continues lower, may not move beyond the end of minuette wave (a) below 1,246.42.
Minuette wave (d) of a contracting triangle may not move beyond the end of minuette wave (b) above 1,263.71.
Minuette wave (d) of a barrier triangle should end about the same level as minuette wave (b) at 1,263.71. As long as the (b)-(d) trend line remains essentially flat the triangle idea will remain valid. Unfortunately, this Elliott wave rule is not black and white.
The final wave of the triangle for minuette wave (e) may not move beyond the end of minuette wave (d).
Thereafter, another upwards wave for minute wave c would still be required to complete the zigzag for minor wave B.
HOURLY CHART II
Click chart to enlarge.
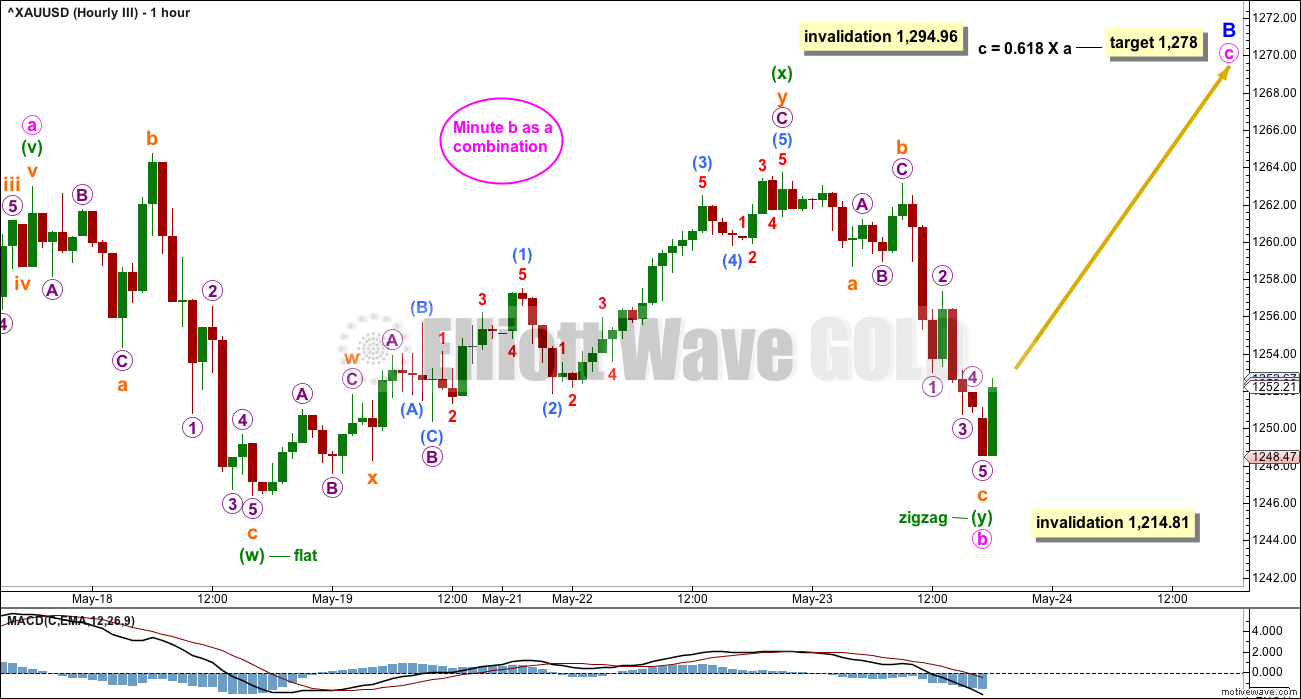
Minute wave b may be continuing sideways as a double combination. These are very common structures. The most common combination of corrective structures in a double is a zigzag and a flat.
Minuette wave (w) fits as an expanded flat. Minuette wave (y) fits now as a completed zigzag.
The maximum number of corrective structures is three within doubles and triples. Thus the sub-waves of W, Y and Z may only be labelled as A-B-C structures (or A-B-C-D-E in the case of triangles). To label multiples within multiples increases the number of corrective structures beyond three violating the Elliott wave rule.
The maximum does not apply to the joining structures labeled X, otherwise the maximum would be five. X waves may be any corrective structure, including multiples. While this is possible, it is not very common. Here, the possible double zigzag for minuette wave (x) does slightly reduce the probability of this wave count. X waves are more commonly simple corrections.
Combinations are sideways movements and to achieve the sideways look their X waves are normally deep. X waves within combinations may make new price extremes beyond the start of wave W (or Y within triples). They may behave like B waves within expanded flats.
While double combinations are very common structures, triples are very rare, almost rarer than running flats. For this reason, once a possible double combination may be complete, it is more likely that the whole correction may be complete than it is to continue further as a triple.
ALTERNATE HOURLY CHART
Click chart to enlarge.
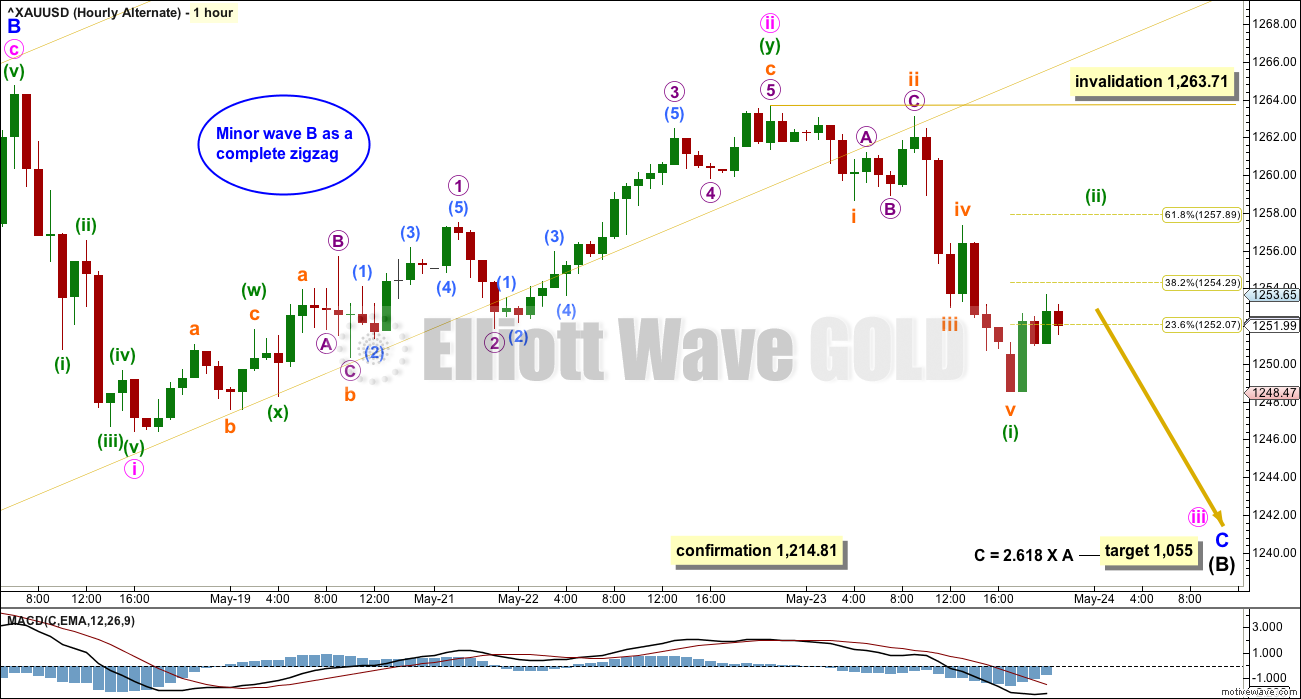
It is also still possible that minor wave B is over. This wave count has the lowest probability of all the four hourly charts published today. If minor wave B is over, then within it minute wave b was a remarkably brief and shallow zigzag. This reduces the probability of this wave count.
This wave count would be confirmed with a new low below 1,214.11. However, before that, a strong downwards day with support from volume would be considered a downwards breakout from a small consolidation and would see this wave count substantially increase in probability.
WEEKLY CHART IV
Click chart to enlarge.
What if the bull market beginning in December 2015 remains intact? Price has essentially been moving sideways since that date, so all possibilities should be considered.
The Morning Doji Star at the low labelled intermediate wave (B) will not be considered as a reversal pattern here because it comes in what is essentially a sideways movement. It does not come after a downwards wave, so there is nothing to reverse.
This wave count requires confirmation above 1,294.96. That would invalidate the first three weekly charts (the third is seen in historic analysis only).
It is possible that cycle wave b is continuing higher as a double zigzag. However, double zigzags normally have brief and shallow X waves. The purpose of the second zigzag in a double (and the third when there is one) is to deepen the correction when price does not move deep enough in the first (or second) zigzag. Thus double (and triple) zigzags normally have a strong and clear slope against the prior trend. To achieve this look their X waves normally are brief and shallow.
In this case, primary wave X is neither brief nor shallow. It is a 0.77 depth of primary wave W and lasted 0.74 the duration of primary wave W. Overall, this does not have a typical look of a double zigzag so far.
This wave count also must see the rise up to the high labelled intermediate wave (A) as a five wave impulse, not a three wave zigzag. This looks a little forced, so it reduces the probability of this wave count.
This wave count should only be used if confirmed with a new high above 1,294.96. Low probability does not mean no probability, but should always be given less weight until proven.
TECHNICAL ANALYSIS
WEEKLY CHART
Click chart to enlarge. Chart courtesy of StockCharts.com.
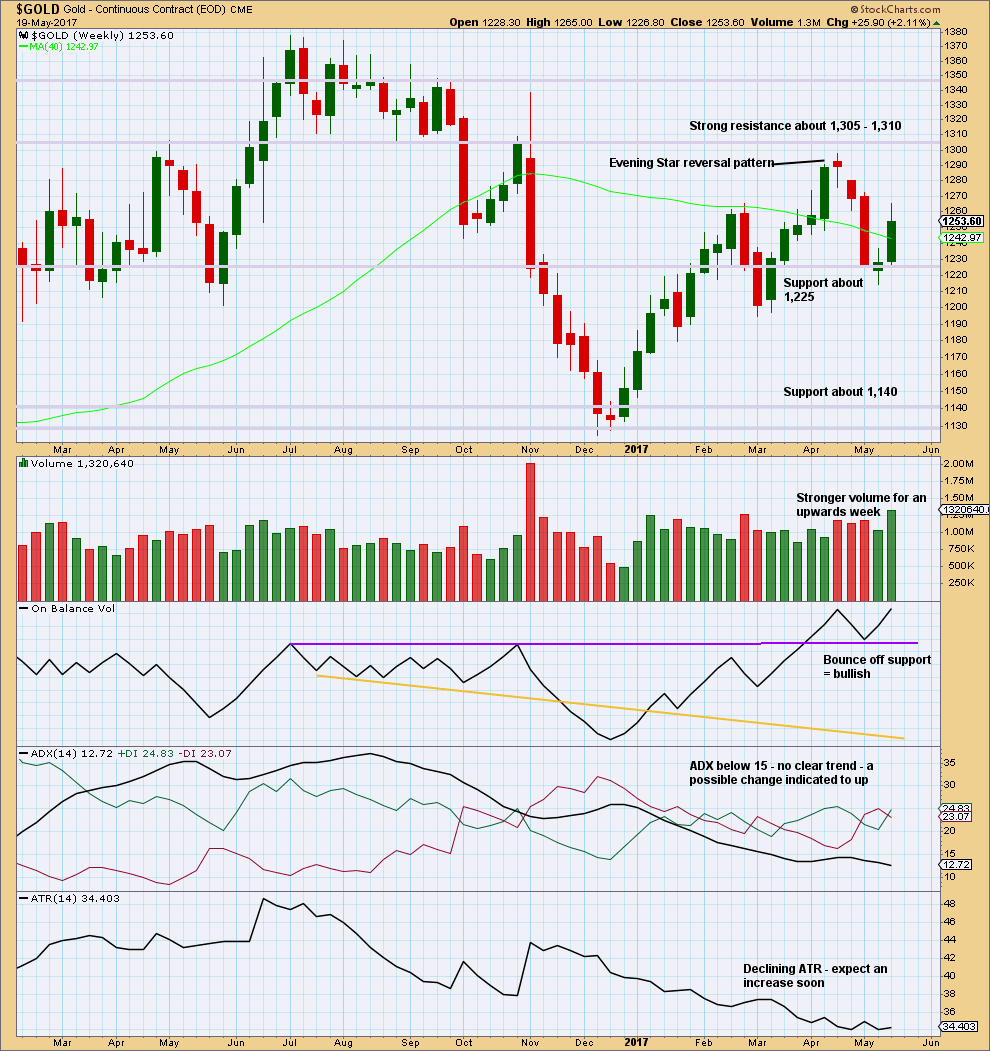
Volume last week strongly supports upwards movement. This is bullish.
Since the low in December 2017, price has still made higher highs and higher lows. This upwards trend would be indicated as possibly over only if price makes a new low below 1,194.50.
On Balance Volume is bullish.
ADX and ATR both indicate an unclear and weak trend.
DAILY CHART
Click chart to enlarge. Chart courtesy of StockCharts.com.
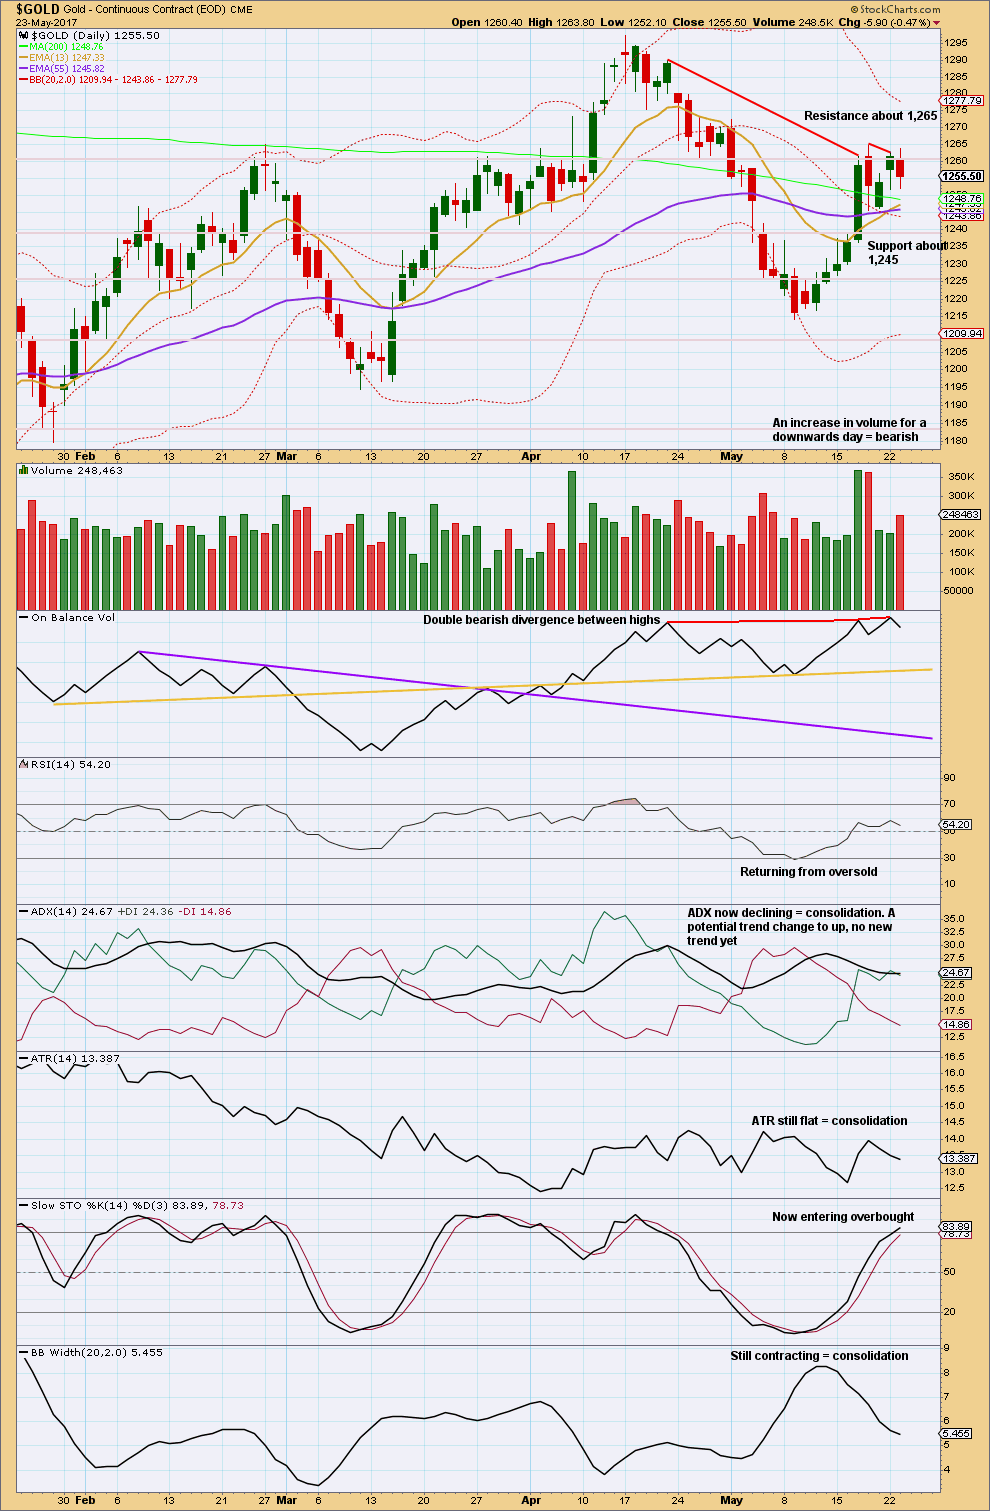
Price is range bound with resistance about 1,265 and support about 1,245. During this range bound movement, it is so far two downwards days that have strongest volume. This suggests a downwards breakout is more likely than upwards.
This view is supported by double bearish divergence between price and On Balance Volume which still exists. This would tend to support the alternate hourly wave count.
ADX, ATR and contracting Bollinger Bands all agree that the market is most likely consolidating.
GDX
DAILY CHART
Click chart to enlarge. Chart courtesy of StockCharts.com.
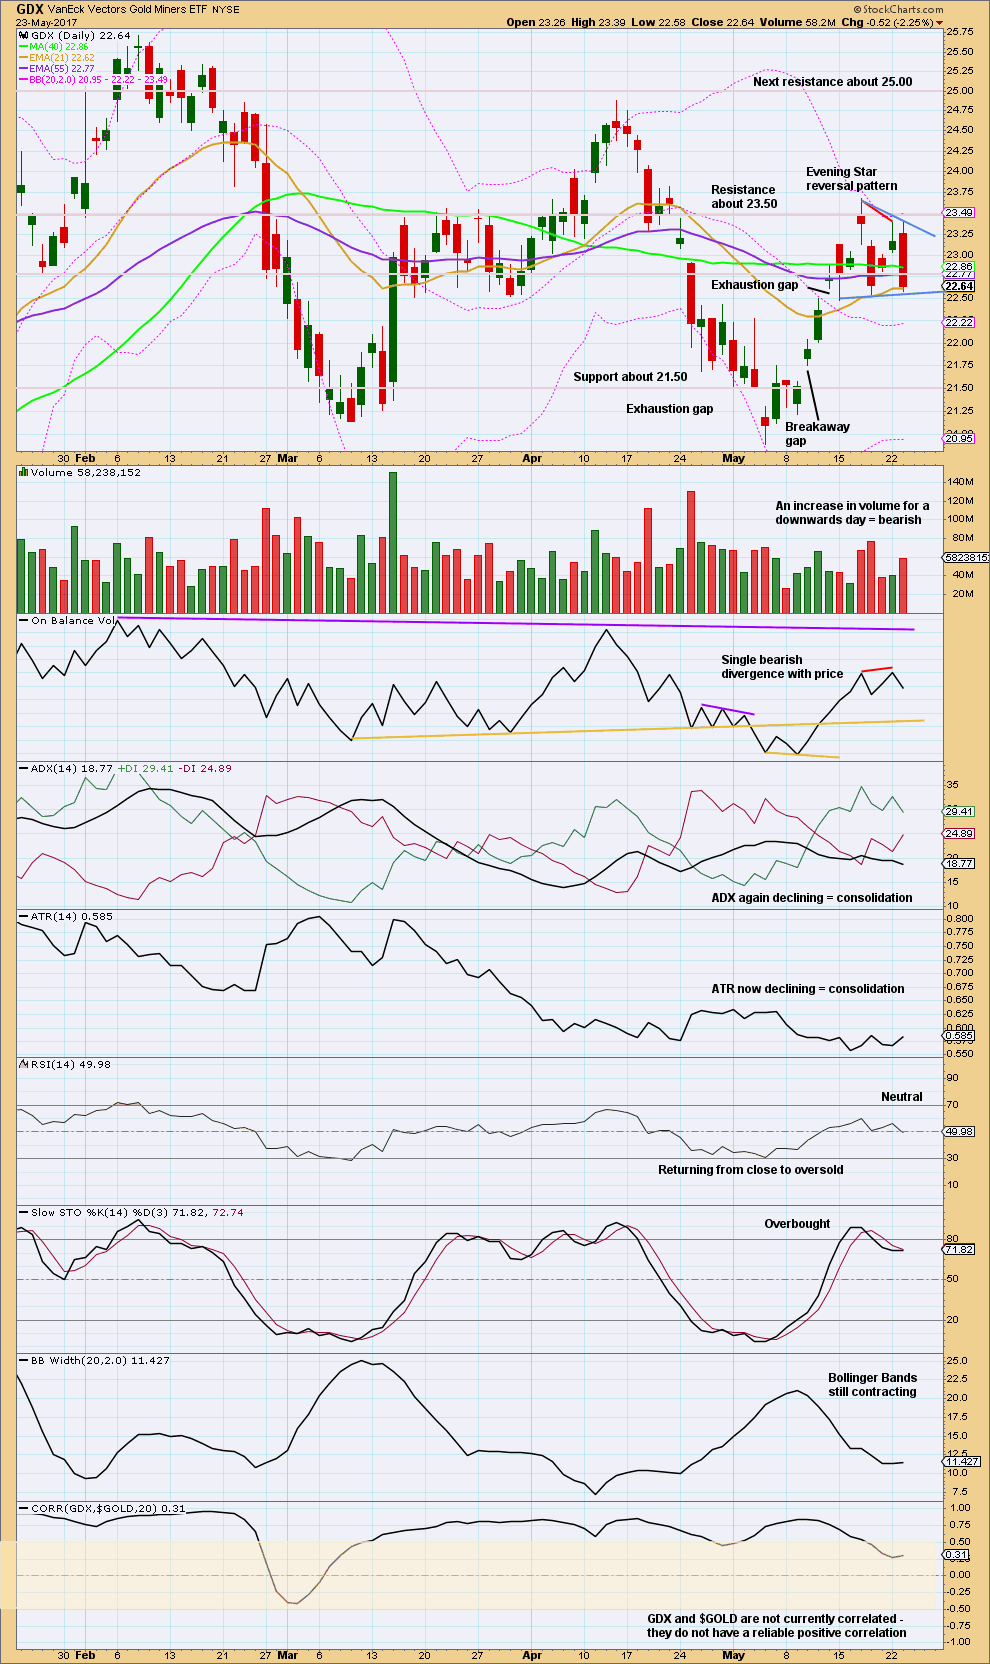
Price may now be consolidating in a triangle pattern after the reversal pattern of the Evening Star.
Reversals indicate a trend reversal from up or down to either the opposite direction or sideways. They make no comment on how far price may travel in the new direction.
Triangles are continuation patterns. This expects that when it is done the breakout would most likely be upwards.
However, so far during the pattern volume is strongest on downwards days suggesting a downwards breakout may be more likely.
Resistance is about 23.65 Support is about 22.55. A breakout above or below the triangle trend lines would indicate the end of the consolidation and the start of a new trend. The breakout would have more confidence if accompanied by strong volume.
This analysis is published @ 10:10 p.m. EST.
Third hourly chart updated.
It’s still also possible that minute b is over and minute c is underway.
A new high above 1,263.71 would see this the only wave count at this stage.
The triangle is looking good so far.
I may discard the first hourly chart, the regular flat, because C hasn’t moved beyond A. That would make it a rare running flat and with much more likely scenarios I’m not going to consider that right now.
Price action looks pretty good today after the Fed notes release. GDX hit my first down target before the release, then reversed up. Bottom may be in for the miners. Let’s see if volume and price closes strong.
Lara,
I found a thinly traded vehicle for bitcoin — GBTC.
What a monster! Up as much as 40% today… looks parabolic
Awesome! Cheers Sundeep
Ichimoku Gold Update
Data as at 8:50 am ET May 24
========================
Gold is trading above the Ichimoku cloud in the 4-hour chart. Price is expected to reach the top of the cloud, currently at 1246.64, and bounce off it. I do not see a deeper pullback at the moment, so I will be waiting for an upward reversal that could come sometime this week.
There is a slew of resistance at the 1255 level: Chikou-span at 1252.10; kijun-sen at 1255.20; and tenkan-sen at 1255.48. The tenkan-sen lies only just above the kijun-sen, giving a weak to neutral push to prices moving higher. I expect trading to be a grind until, maybe, the release of the Fed minutes. Important resistance remains at 1265, and if taken out, prices could go to the 1278 region.
Just for information.
Bitcoin hit 2300/coin!!! WOW
Ichimoku Daily Analysis
Data as at close May 23
====================
Gold prices fell significantly yesterday, dropping below the 1254 support area. That had brought negative pressure to bear on the golden metal. The next support level to watch is the bottom of the cloud boundary at 1245.95.
A rebound will pave the way for the three hourly counts with a rise toward 1278. It will also provide some hope for the Weekly IV count where it’s up, up and away. I am of the opinion that this rebound will be muted, as the tenkan-sen is still lying below the kijun-sen. The first order of the day will be to reclaim 1254.35 (kijun-sen resistance) followed by the upper cloud boundary at 1255.50.
A drop below the lower cloud boundary, as well as the tenkan-sen support at 1240.95, and prices will continue their descent to test the final frontier of the brown support line. If this breaks, Lara’s most unlikely Alternate Hourly will be in play.
On a fundamental note, the drop in gold prices was attributed to a return to confidence in the Trump trade. Investors were enticed by the proposed budget seeking to cut federal spending by $3.6 trillion over the next 10 years. The budget also assumes the administration will be able to lower taxes for businesses and households. The potential for lower taxes is what got stock investors excited and back to thinking about the possibility of Trump eventually implementing his economic agenda, which contains tax reform. This surprise news helped encourage investors to sell gold.
The Fed minutes, due to released later today, also hung like the proverbial sword over the stock market. Investors had already priced in a rate hike in the June meeting. If the Fed minutes are hawkish, then the chances of the rate hike should go up. This would encourage further selling in the gold market. Traders would want to know the pace of the rate hikes too. If the Fed remains steady and stable regardless of the short-term fluctuations in the US economic data then this will also be bearish for gold.
On an optimistic note, there are still a lot of things out there that could have gold traders running right back to that trade, not the least of which would be North Korea. Although all seems placid on the surface, there are still strong undercurrents, what with the cat-and-mouse game perpetrated by Kim Jong Un in repeatedly firing projectiles.
Verne/ all,
After reading your linked article in yesterdays comments titled “Gold: Another Useless Golden Cross Signal”, I decided to do my own research on Gold and it’s “Golden” and “Death” crosses.
After doing so, I have to say that I disagree with that author. He may be a CFA, and I’m not, but I think my more detailed analysis clearly shows that there is tremendous value in watching the 50 and 200 MA crosses. Sure, you can occasionally get whipsawed during a sideways market, but overall these look like pretty darn good indicators to keep you with the trend for the intermediate term.
So Verne, keep watching those MA’s!
https://www.tradingview.com/x/JXsBz2N6/
Agreed. As they say “one swallow does not make a whole summer”. One day of reversal of a golden cross does not mean that it is voided. We would need to monitor the situation for a couple of days to determine whether it is so. MAs are built up over time, in the case of crosses, 50 and 200 days.
The moral of the story is that we should exercise due diligence, and not let one or more “experts” sway us to his/her viewpoints. Who knows he/she may have a hidden agenda?
I will!
While the author cited some glaring exceptions, my experience is indeed that they have been quite reliable indicators. Thanks for the due diligence. Your research leaves no doubt! 🙂
Yes, often it will work. But it won’t always work.
So my conclusion would be to certainly pay attention to them, but look out for them in a sideways market.
I still think GDX has a decent chance of an upwards breakout. Expecting a little more down tomorrow.
Fed minutes @ 2pm EST
https://www.tradingview.com/x/RqfDgrh6/
Thank you Dreamer, that looks like a nice wave count.
It’s also possible that minor B could continue sideways yet.
My sentiments exactly.
nice call on the ‘low’ Dreamer!
Thanks Patrick. Now we just need to see it hold and make a new higher high.