A consolidation was expected to continue. So far this week that is exactly what is happening as price remains range bound.
Summary: The consolidation continues.
A new high reasonably above 1,263.71 now would indicate an upwards breakout and the target would be either 1,278 (Elliott wave) or 1,310 (measured rule).
A new now below 1,248.01 would indicate a downwards breakout and the target would be about 1,055 (Elliott wave).
New updates to this analysis are in bold.
Last historic analysis with monthly charts is here, video is here.
Grand SuperCycle analysis is here.
MAIN ELLIOTT WAVE COUNT
For clarity I have decided at this time it may be best to publish on a daily basis weekly charts I, II and IV. Both weekly charts I and II expect a zigzag down to complete and the difference is in the expected depth. Weekly chart IV has a very low probability and will only be given serious consideration if price makes a new high above 1,294.96.
WEEKLY CHART I
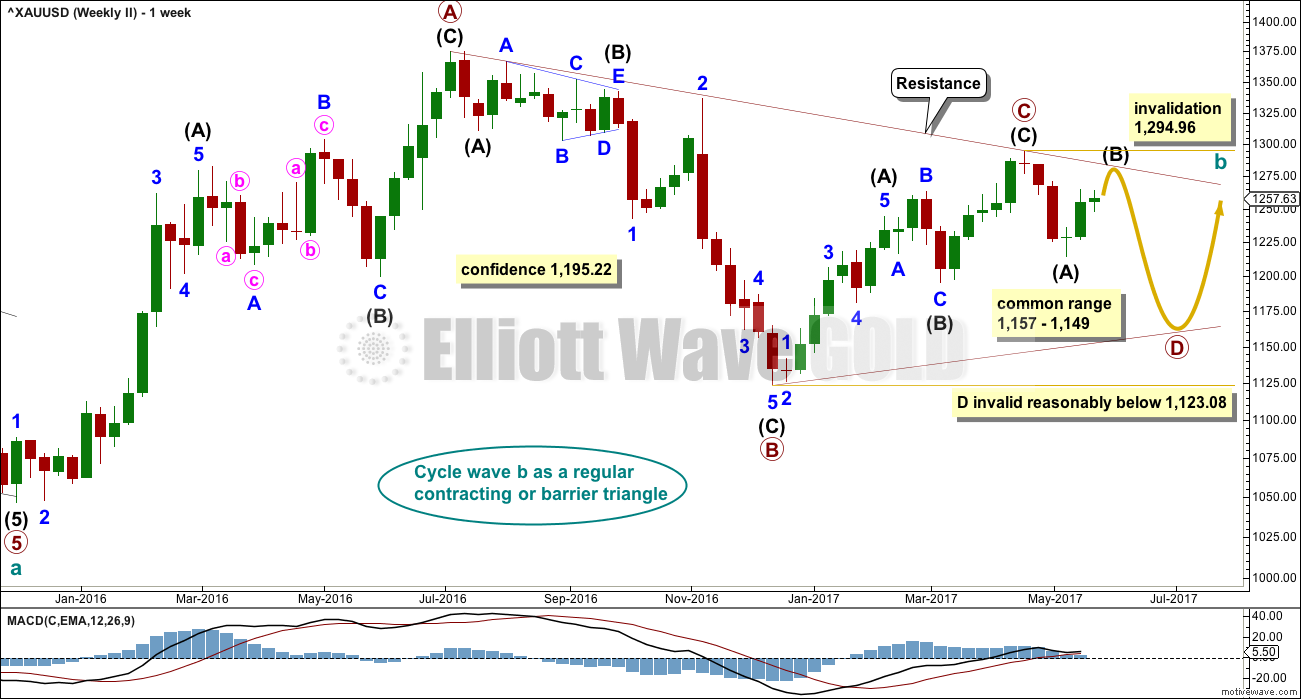
Combinations are very common structures. Cycle degree waves normally last one to several years, and B waves do tend to be more time consuming waves than all other waves. Given these tendencies the most likely scenario at this point may be that cycle wave b is an incomplete double combination.
The first structure in the double labelled primary wave W fits as a zigzag. This upwards movement will subdivide as either a three (zigzag) or a five (impulse). It does have a three wave look to it.
The double is joined by a deep three in the opposite direction labelled primary wave X, which is a 0.77 depth of primary wave W. X waves within double combinations are normally very deep; this one looks right.
The second structure in the combination may be either a triangle or a flat correction. Both of these structures have A waves which subdivide as threes.
At this stage, the upwards wave from the low in December 2016 does now look best and subdivide best as a completed zigzag. This may be intermediate wave (A) of a flat correction or a triangle. Because a triangle for primary wave Y would look essentially the same as the second weekly chart below, only a flat correction is considered here. The most common two structures in a double combination are a zigzag and a flat.
This wave count follows the most common scenario and has the best fit.
Within the flat correction of primary wave Y, intermediate wave (B) must retrace a minimum 0.9 length of intermediate wave (A) at 1,140.27. The most common length for intermediate wave (B) is from 1 to 1.38 times the length of intermediate wave (A), giving a common range from 1,123.08 to 1,057.77.
Intermediate wave (B) may subdivide as any corrective structure, but the most common structure for B waves within flats is a zigzag. At this stage, on the hourly chart it looks like a five down labelled minor wave A is complete, which would indicate intermediate wave (B) is a zigzag subdividing 5-3-5.
The daily and hourly charts will follow this weekly chart. That does not mean the other three weekly charts aren’t possible, they are, but the number of charts must be kept reasonable on a daily basis.
WEEKLY CHART II
What if cycle wave b is a triangle? This is also entirely possible. Triangles are not as common as double combinations, but they are not uncommon.
Within the triangle, primary waves A, B and C are all single zigzags. One of the five subwaves of a triangle normally subdivides as a more complicated multiple, usually a double zigzag. This may be what is unfolding for primary wave D. It may also subdivide as a single zigzag.
Primary wave D of a regular contracting triangle may not move beyond the end of primary wave B below 1,123.08.
Primary wave D of a regular barrier triangle should end about the same level as primary wave B at 1,123.08, so that the B-D trend line is essentially flat. What this means in practice is that primary wave D may end slightly below 1,123.08 and the triangle would remain valid. This is the only Elliott wave rule which is not black and white.
Thereafter, primary wave E should unfold upwards and would most likely fall a little short of the A-C trend line. If not ending there, it may overshoot the A-C trend line. Primary wave E may not move beyond the end of primary wave C above 1,294.96.
Triangles normally adhere very well to their trend lines. Occasionally, price may overshoot the trend lines but when this happens is not by much and is quickly reversed. The upper A-C trend line should offer very strong resistance at this stage if cycle wave b is unfolding as a triangle. This trend line is added today to the daily chart below.
At this stage, the structure on the hourly chart is still the same for both this weekly wave count and the first weekly wave count: a zigzag downwards is unfolding. However, they now diverge in how far down the next wave is expected to go. This second weekly wave count expects a more shallow movement to not end reasonably below 1,123.08.
DAILY CHART
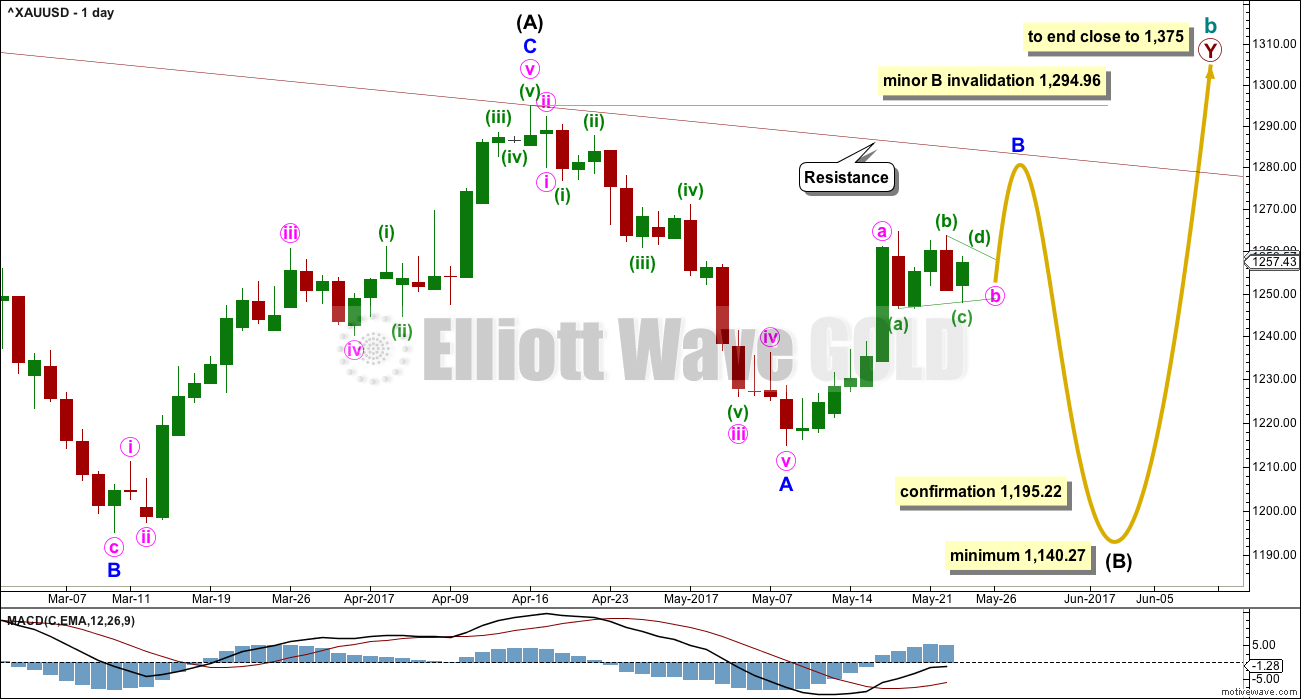
This daily chart will suffice for both weekly charts above, although the labelling follows weekly chart I.
Both weekly charts expect a zigzag downwards. (It may also turn out to be a double zigzag. For now a single only will be charted but a double will be kept in mind). Weekly chart I expects a deep zigzag for intermediate wave (B) to a minimum at 1,140.27. Weekly chart II expects a zigzag down for primary wave D to not move below 1,123.08 and most likely fall well short of that point.
The daily chart follows the expectations for weekly chart I, but the structure for weekly chart II would be exactly the same at this stage.
Within the flat correction of primary wave Y, intermediate wave (B) must retrace a minimum 0.9 length of intermediate wave (A) at 1,140.27. The most likely corrective structures to achieve the deep correction required for B waves within flats are single or multiple zigzags. These begin with a five, then a three in the opposite direction.
Minor wave A is complete. Minor wave B may be an incomplete zigzag.
Within the zigzag, there are now two hourly wave counts for minute wave b and an alternate that sees minor wave B complete. These are not the only possibilities, but it is my judgement today that three hourly charts are enough to cover three different directions: sideways or up or down.
Minor wave B may not move beyond the start of minor wave A above 1,294.96.
HOURLY CHART – TRIANGLE
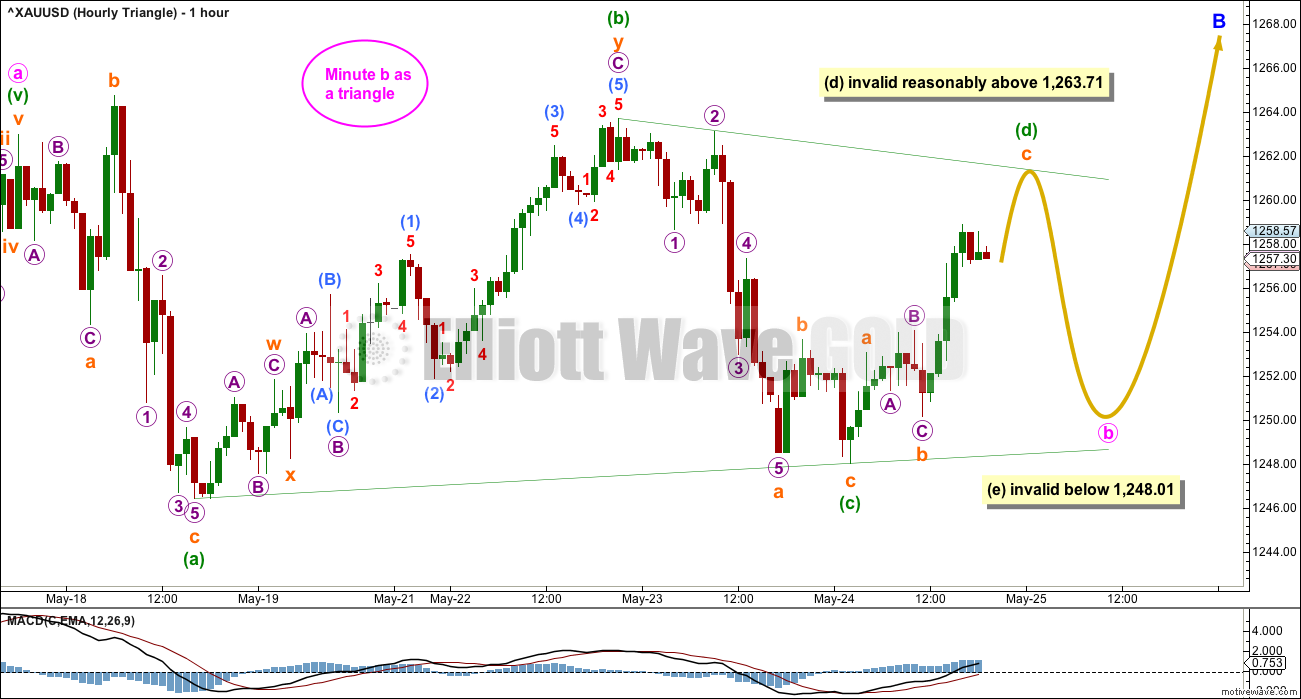
Minute wave b at this stage looks slightly more likely to be continuing sideways as a triangle.
Within a triangle, all sub-waves must subdivide as threes and four of the five sub-waves must be zigzags or zigzag multiples. Only one of the five sub-waves may be a more complicated multiple. So far minuette wave (b) may be the double zigzag. All remaining triangle sub-waves must be simple A-B-C structures.
Minuette wave (d) of a contracting triangle may not move beyond the end of minuette wave (b) above 1,263.71.
Minuette wave (d) of a barrier triangle should end about the same level as minuette wave (b) at 1,263.71. As long as the (b)-(d) trend line remains essentially flat the triangle idea will remain valid. Unfortunately, this Elliott wave rule is not black and white.
The final wave of the triangle for minuette wave (e) may not move beyond the end of minuette wave (d), below 1,248.01.
Thereafter, another upwards wave for minute wave c would still be required to complete the zigzag for minor wave B.
If price does continue as the triangle outlines, then when it is complete a target may be calculated for minute wave c upwards to end the zigzag for minor wave B. That cannot be done yet because it is now known where minute wave b ends and minute wave c begins.
HOURLY CHART – COMBINATION
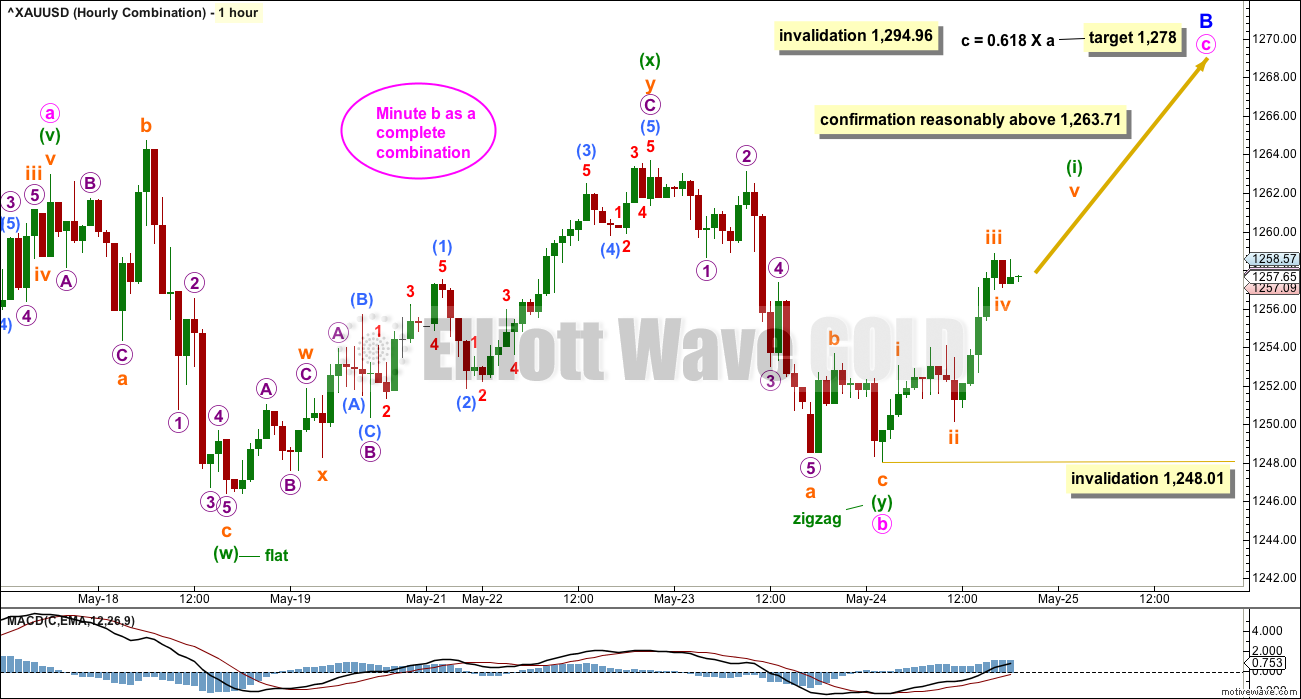
Minute wave b may be a complete double combination. These are very common structures. The most common combination of corrective structures in a double is a zigzag and a flat.
Minuette wave (w) fits as an expanded flat. Minuette wave (y) fits now as a completed zigzag.
The maximum number of corrective structures is three within doubles and triples. Thus the sub-waves of W, Y and Z may only be labelled as A-B-C structures (or A-B-C-D-E in the case of triangles). To label multiples within multiples increases the number of corrective structures beyond three violating the Elliott wave rule.
The maximum does not apply to the joining structures labeled X, otherwise the maximum would be five. X waves may be any corrective structure, including multiples. While this is possible, it is not very common. Here, the possible double zigzag for minuette wave (x) does slightly reduce the probability of this wave count. X waves are more commonly simple corrections.
Combinations are sideways movements and to achieve the sideways look their X waves are normally deep. X waves within combinations may make new price extremes beyond the start of wave W (or Y within triples). They may behave like B waves within expanded flats.
While double combinations are very common structures, triples are very rare, almost rarer than running flats. For this reason, once a possible double combination may be complete, it is more likely that the whole correction may be complete than it is to continue further as a triple.
At this stage, a good level of confidence may be had in this wave count if price makes a new high reasonably above 1,263.71.
ALTERNATE HOURLY CHART
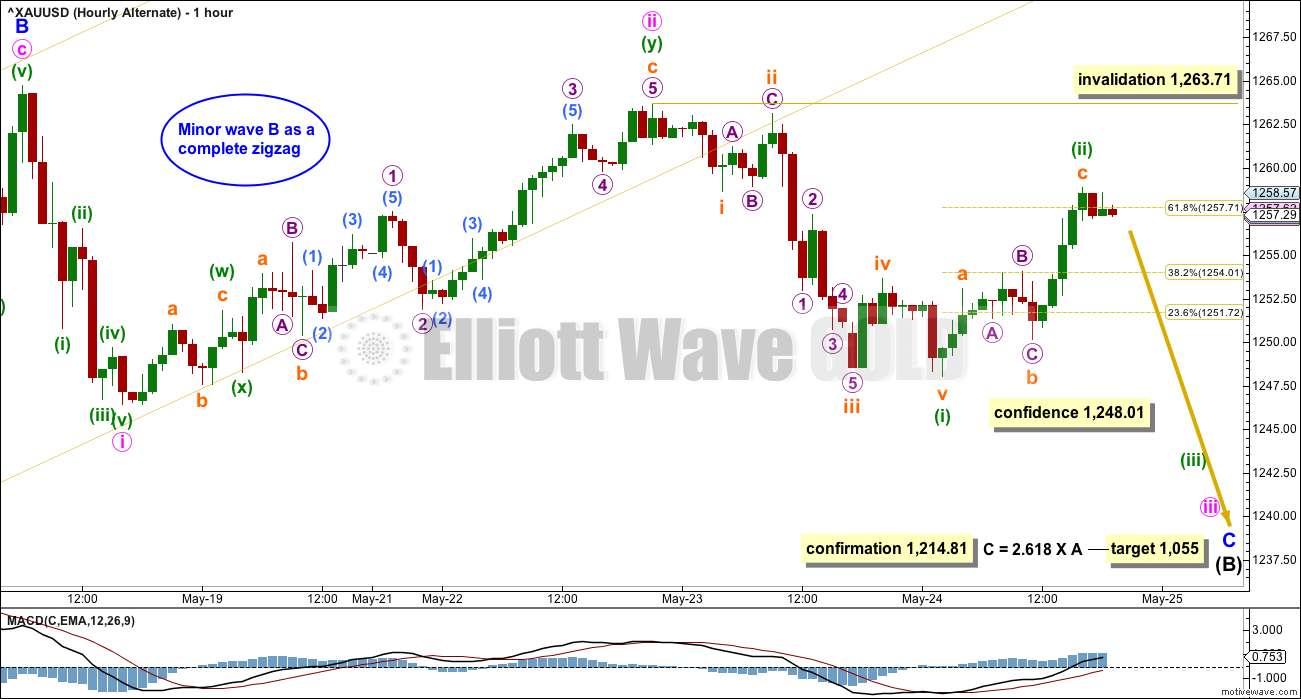
It is also still possible that minor wave B is over. This wave count has the lowest probability of all the three hourly charts published today. If minor wave B is over, then within it minute wave b was a remarkably brief and shallow zigzag. This reduces the probability of this wave count.
This wave count would be confirmed with a new low below 1,214.11. However, before that, a strong downwards day with support from volume would be considered a downwards breakout from a small consolidation and would see this wave count substantially increase in probability.
WEEKLY CHART IV
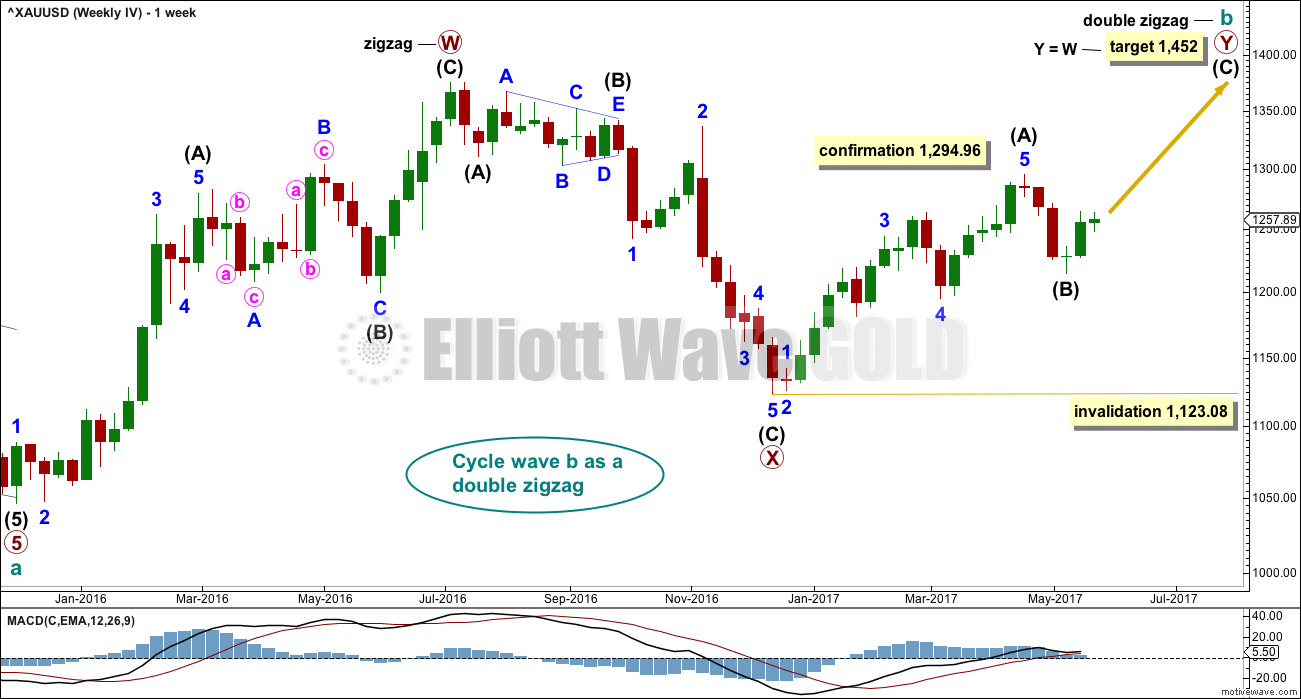
What if the bull market beginning in December 2015 remains intact? Price has essentially been moving sideways since that date, so all possibilities should be considered.
The Morning Doji Star at the low labelled intermediate wave (B) will not be considered as a reversal pattern here because it comes in what is essentially a sideways movement. It does not come after a downwards wave, so there is nothing to reverse.
This wave count requires confirmation above 1,294.96. That would invalidate the first three weekly charts (the third is seen in historic analysis only).
It is possible that cycle wave b is continuing higher as a double zigzag. However, double zigzags normally have brief and shallow X waves. The purpose of the second zigzag in a double (and the third when there is one) is to deepen the correction when price does not move deep enough in the first (or second) zigzag. Thus double (and triple) zigzags normally have a strong and clear slope against the prior trend. To achieve this look their X waves normally are brief and shallow.
In this case, primary wave X is neither brief nor shallow. It is a 0.77 depth of primary wave W and lasted 0.74 the duration of primary wave W. Overall, this does not have a typical look of a double zigzag so far.
This wave count also must see the rise up to the high labelled intermediate wave (A) as a five wave impulse, not a three wave zigzag. This looks a little forced, so it reduces the probability of this wave count.
This wave count should only be used if confirmed with a new high above 1,294.96. Low probability does not mean no probability, but should always be given less weight until proven.
TECHNICAL ANALYSIS
WEEKLY CHART
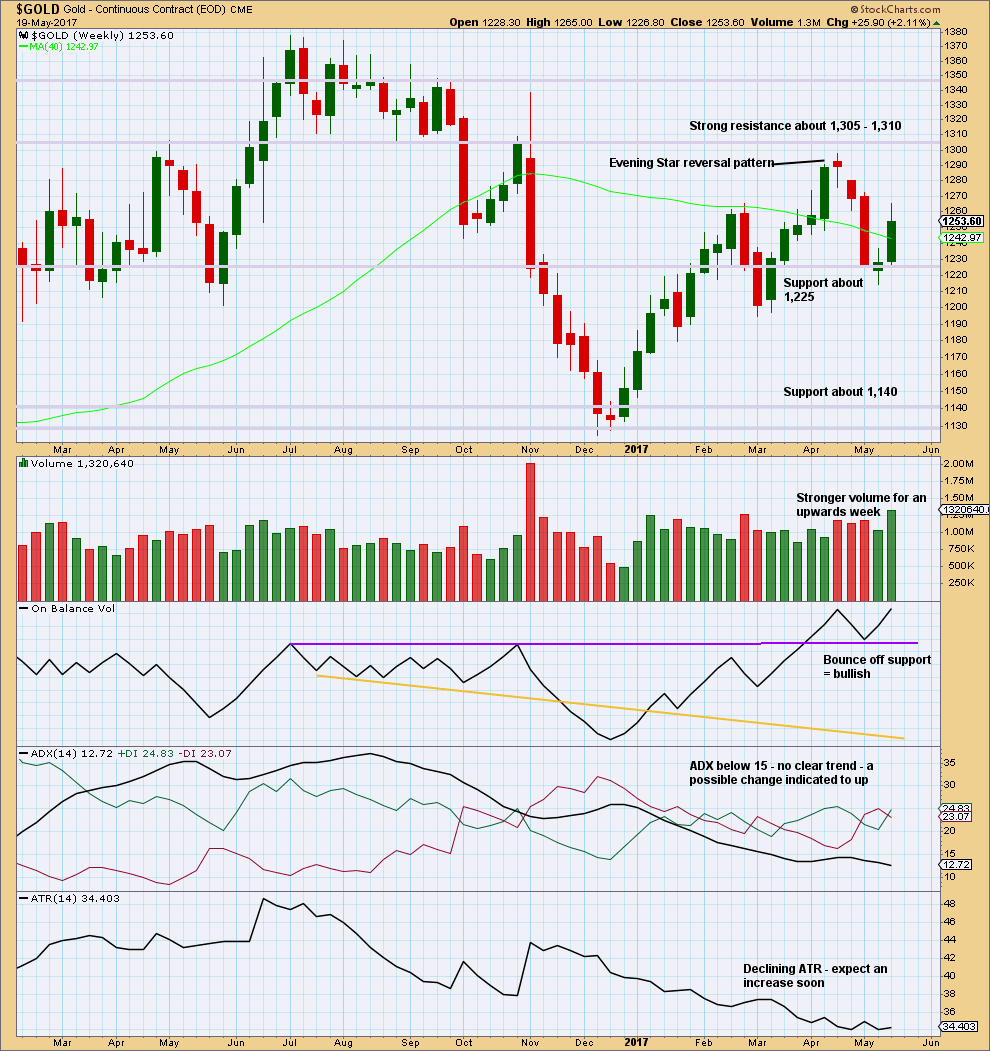
Click chart to enlarge. Chart courtesy of StockCharts.com.
Volume last week strongly supports upwards movement. This is bullish.
Since the low in December 2017, price has still made higher highs and higher lows. This upwards trend would be indicated as possibly over only if price makes a new low below 1,194.50.
On Balance Volume is bullish.
ADX and ATR both indicate an unclear and weak trend.
DAILY CHART
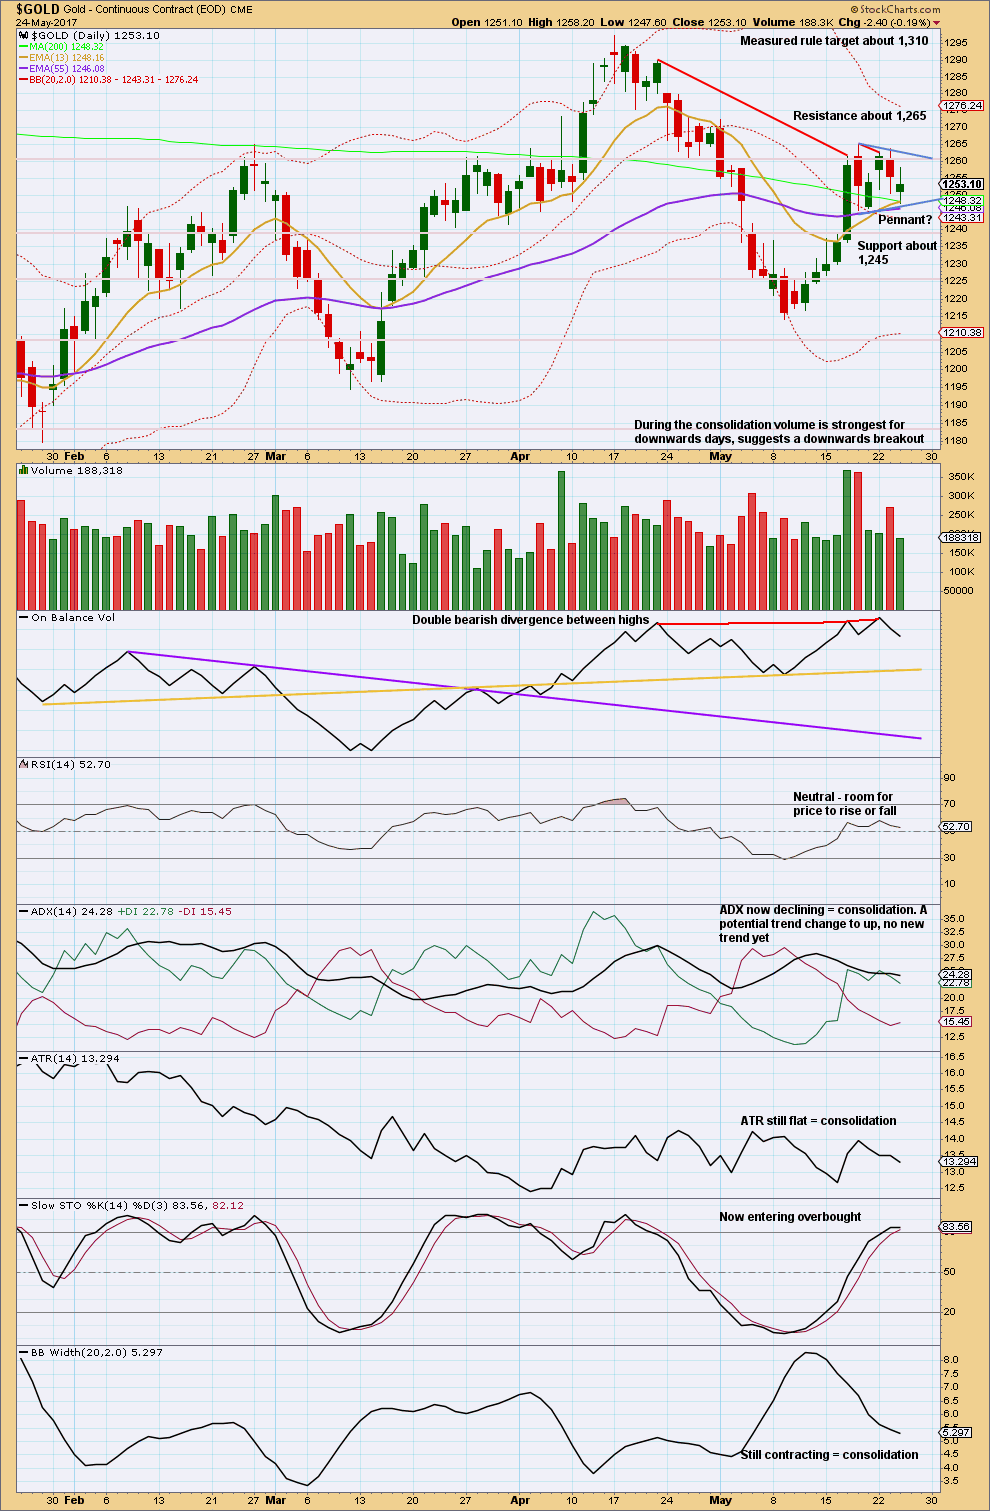
Click chart to enlarge. Chart courtesy of StockCharts.com.
Price is range bound with resistance about 1,265 and support about 1,245. During this range bound movement, it is so far two downwards days that have strongest volume. This suggests a downwards breakout is more likely than upwards.
This view is supported by double bearish divergence between price and On Balance Volume which still exists. This would tend to support the alternate hourly wave count.
ADX, ATR and contracting Bollinger Bands all agree that the market is most likely consolidating.
A small pennant pattern looks to be forming. Pennants and flags are the most reliable continuation patterns, and this pattern suggests an upwards breakout. The measured rule would be used for a target taking the flag pole as 50.7 in length and the breakout from the pennant expected to be about 1,260. This gives a target of 1,310, which is a very strong area of prior support, and it should offer good resistance.
The pennant pattern and volume contradict each other on expected breakout direction.
GDX
DAILY CHART
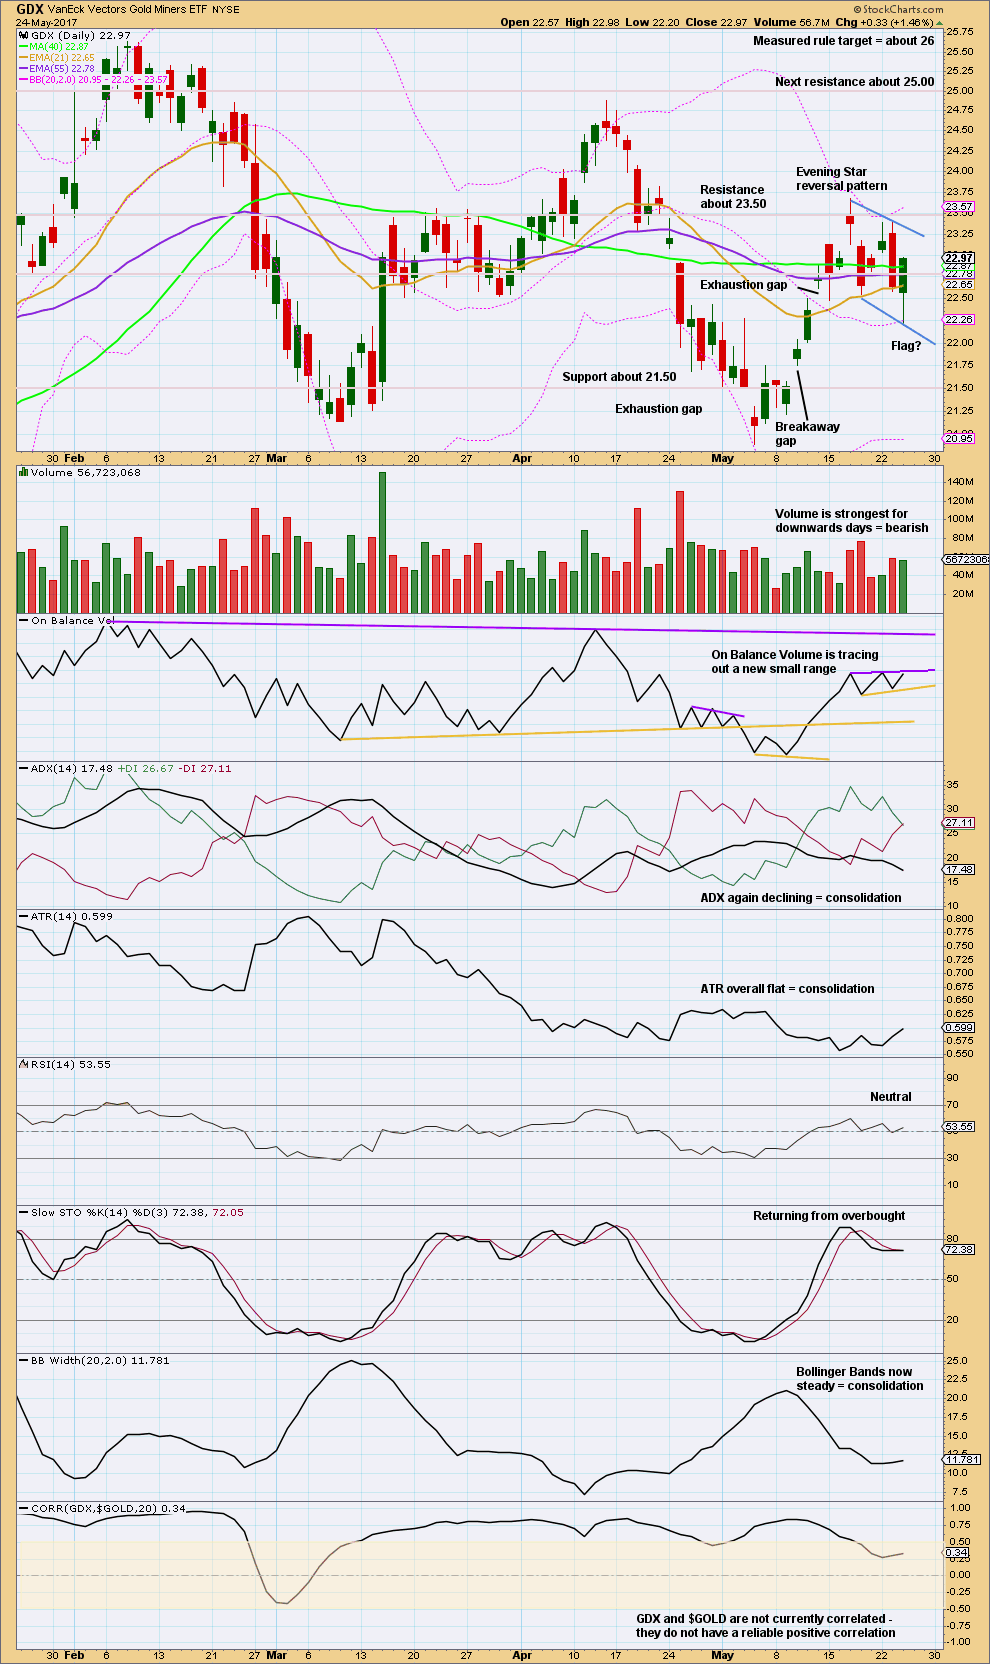
Click chart to enlarge. Chart courtesy of StockCharts.com.
As with Gold, GDX has a contradiction in this chart between bearish volume and a possible bullish flag pattern.
This analysis is published @ 08:19 p.m. EST.

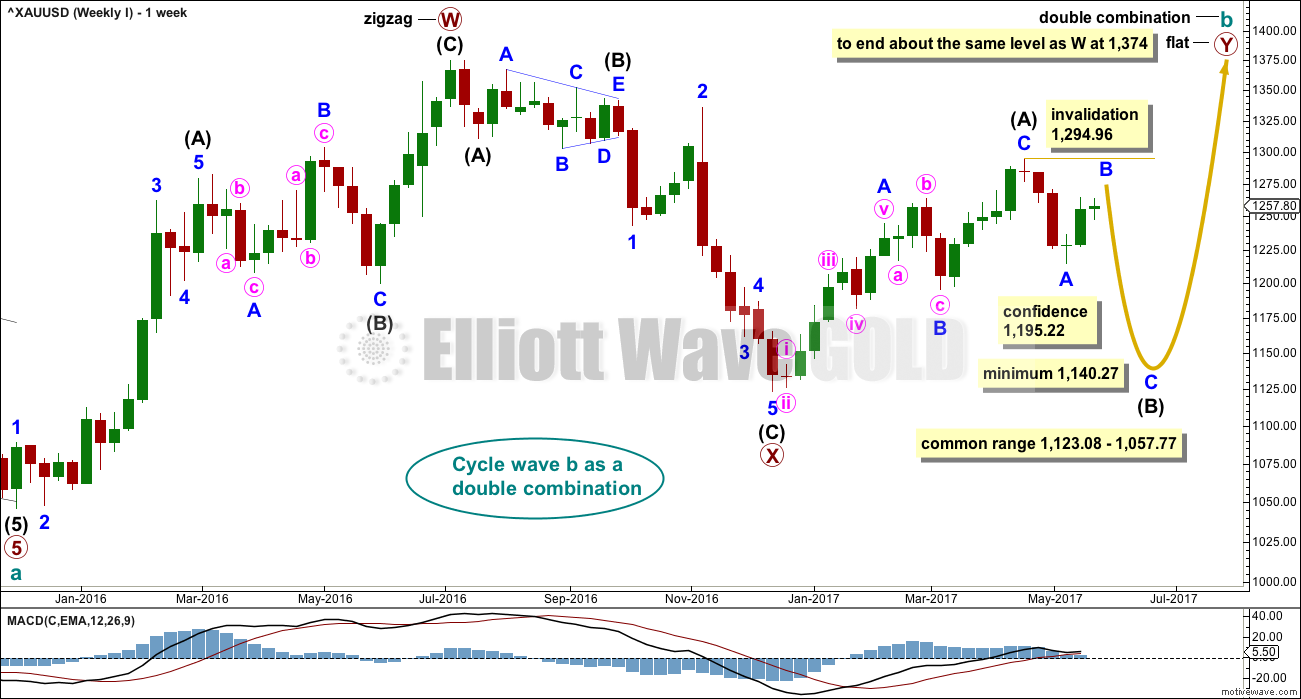
Triangle chart updated: this looks so far to be the one.
Look for (d) to end at the green trend line in the first instance. That may be the correct lay for the (b)-(d) trend line, it sits nicely so far.
Triangles are very tricky structures. Just when you think it’s definitely a triangle, price will move in the other direction from that expected and you’ll be stumped.
So I’ll be looking for alternate ideas on the hourly chart today.
What if it’s not a triangle for minute b? What if something else is happening that I haven’t considered yet?
Re-living Tulip bubble????
Yesterday Bit was 2300 and today on BTC it is 2596??
Lara’s 5th wave wave count target well exceeded.
Just like Lara wrote get ready to buy at bottom of correction around 195.
Parabolic rise will crash hard…
When it first started, BitCoin also went parabolic, and those early investors were made instant millionaires. (Unfortunately, yours truly was not among them). This is a repeat. But, there is more substance now than when it first started. Cryptocurrencies are now finding greater acceptance, what with the increasing fad toward cashless mobile payments like ApplePay. The only resistance comes from banks for whom the use of fiat currencies give them lucrative yields of 3 to 5% minimum in transactions. But, perhaps this is peanuts to them when they can crookedly deal with derivatives to boost their income.
hit 2700 on Bitcoin and now down to 2350 ish
Soon Lara will update the wave count. I think cycle wave V is complete as of today.
I’ve asked Cesar to update my data, then I’ll update the count.
Gold correlation to Yen.
Chart tells the story.
This is just a note on the integration between EW analysis and Ichimoku, as far as I can tell.
Ichimoku agrees with the Weekly I and IV, but at the moment, not II and III which do not suggest a rise above 1263.71, but instead point to a fall deeply toward 1123 at least. Weekly I and IV both point to a rise to 1278.
After hitting 1278, Weekly I suggests a drop toward 1140 at least, before a strong rise. Weekly IV, on the other hand, will have a slight drop (to about 1256-1260 support) before take-off. Ichimoku analysis goes 52 days into the future, and so it cannot be called upon, reliably, to decide between the two.
For Weekly I scenario, Ichimoku does not agree with the Alternate Hourly.
My longer term strategy, then, is to follow the Hourly triangle or combo until 1278 and the drop. That drop will separate Weekly I and IV.
And those are the wave counts that I have the most confidence in. So we’re in agreement there, Ichimoku and I 🙂
Ichimoku Gold 4-Hourly
Data as at 4:25 am ET May 25
========================
Gold is trading above the Ichimoku cloud in the 4-hour chart. As expected yesterday, price back-tested the top of the cloud support and bounced off it. This indicates an upward reversal, a bullish trend. Price will next be expected to test the major resistance at 1263.71 followed by the 1280-1300. The daily lower cloud boundary support at 1245.30 remains the key. If broken, we will test 1235 which seems to be supportive on long-term charts (currently 1239.57, the lower cloud boundary on the 4-hour chart).
For the short-term trend, the resistance between 1257 and 1265 is critical. Price needs to rise above this to open the way for a rally to 1280 at least. In the very short-term, the 1-hour chart (not posted) shows that a small drop toward the top cloud boundary 1254.27 is underway. I would expect a rebound, it being a back-test.
Thank you very much Alan for continuing to share your charts and analysis. It is greatly appreciated.
And here’s the more bullish daily count that I have been sharing. Strong upward movement is expected.
https://www.tradingview.com/x/VYVNQbkD/
Dreamer. I share your vision.
My analysis of NUGT (both EW and Ichimoku) agrees with your view.
The only thing is that I cannot integrate this view with Lara’s Weekly I, II and III. It points to the Weekly IV as the most correlated.
What this means is that either the very low probability Weekly IV is correct, or there is poor correlation between gold and the miners.
But then again we are looking far into the future.
Yeah, that’s why I worked on the triangle count as it better aligns with Lara’s more bearish gold count. The good thing is that both my GDX counts expect more up in the near term.
That’s right. It’s the same as my NUGT count. I do have a variation of that count that allows for one more down before take-off. And boy, when it does rise, it rises to at least double the value now, and that is provided it is just a normal rise, not parabolic.
Alan, now that you’re using Trading view for your cloud charts, have you tried using the Elliott wave tools? Would love to see your Counts charted if you ever care to share. TIA
Dreamer. I’ll try to. It might take a fair bit of time. I’ll see if I can work that into my schedule. Thanks for the suggestion. It is awesome.
So GDX continues to coil in what looks like a symmetrical triangle. I had dismissed it being an EW triangle because the retracements were too low.
I think this weekly chart may solve that issue. If this leg moves up near the target of 28, then the retracement will be acceptable. This count aligns pretty good with Lara’s gold triangle count. It expects mostly sideways movement into approximately July before a big move down starts.
Even though this is a more bearish count than what I have been sharing, near term it expects a strong move up of over 20% which aligns with the direction of my more bullish count.
So for now, a strong move up is expected.
https://www.tradingview.com/x/HdxmdL4q/
Thank you Dreamer for continuing to share your charts and analysis for GDX. It is greatly appreciated, my me and all other members here.
Just wanted you and Alan today to know that 🙂
Ichimoku Gold Daily Analysis
Data as at 4:00 am ET May 25
========================
Gold prices rose quite a fair bit yesterday just after the release of the Fed minutes, almost wiping out earlier losses. But, on the daily chart, we still have no breakout. The price is trying to reach out above the cloud and, if it succeeds, it will be a bullish sign. Holding the lower cloud boundary intact is a sign of strength. So, the situation appears to be one which is sideways rather than a deep correction. More light will be shed at the intraday level in the next post, as this forum allows me to post only one chart at a time.
On a fundamental note, the rebound in gold prices was attributed to the less-than-hawkish Fed stance. The policymakers agreed they should hold off on raising interest rates until it was clear a recent US economic slowdown was temporary, although most members said a hike was coming soon. Having said that, many investors believe that the rate hike has been priced into gold. This is probably why gold’s reaction to the news has been limited on the upside. Moreover, as long as stocks continue to hover around or post new all-time highs, I wouldn’t expect much of a rally.
On the other hand, helping to underpin gold are concerns over the Trump administration’s ability to implement his economic agenda. Also, trading conditions may change to the bullish side of the equation next week when former FBI Director James Comey gives his testimony before the Senate Intelligence Committee. At the same time, although the concerns over North Korea has been relegated to the back burner, the matter has not been snuffed out — it could be ignited instantaneously should the first signs of a skirmish erupts. The rally, early in the week, to 1263.71 was stopped but it had not brought in the sellers. This indicates that investors are adopting a wait-and-see attitude.
Lara, Triangle question please. I know your “common” retrace that you go by is 80 – 85% of the prior wave. I don’t think there is any hard rule on the minimum, is there?
Have you ever seen retraces below say 50%? or would that mean that the wave will likely continue so that the triangle expands and the retrace % increases? Do you have any minimum guidelines?
A good question.
There is no minimum, nor (apart from expanding triangles) is there a maximum.
The only unhelpful answer I can give you is the re-tracement should be enough for the triangle trend lines to have the right look. Too shallow and they converge too quickly.
A minimum should be absolutely at least 0.5 I would guess.
I do have an idea actually to do some research on triangles. To look at 20 years of data, down to the daily chart level, find triangles, and measure their wave lengths along with recording what type they were. Then figure out what those lengths commonly are, with a maximum and minimum range.
That’s what I was afraid of. I guess the Market needs plenty of ways to fake us out. Thanks.