
Further sideways movement was expected. The consolidation continues.
Summary: The breakout may be upwards, but it may be relatively short and brief. Thereafter, a new downwards trend may develop. The consolidation is most likely incomplete.
In the short term, a new high reasonably above 1,265 on a day with strong volume may be taken as an upwards breakout.
A new low reasonably below 1,245 on a day with strong volume may be taken as a downwards breakout.
New updates to this analysis are in bold.
Last historic analysis with monthly charts is here, video is here.
Grand SuperCycle analysis is here.
MAIN ELLIOTT WAVE COUNT
For clarity I have decided at this time it may be best to publish on a daily basis weekly charts I, II and IV. Both weekly charts I and II expect a zigzag down to complete and the difference is in the expected depth. Weekly chart IV has a very low probability and will only be given serious consideration if price makes a new high above 1,294.96.
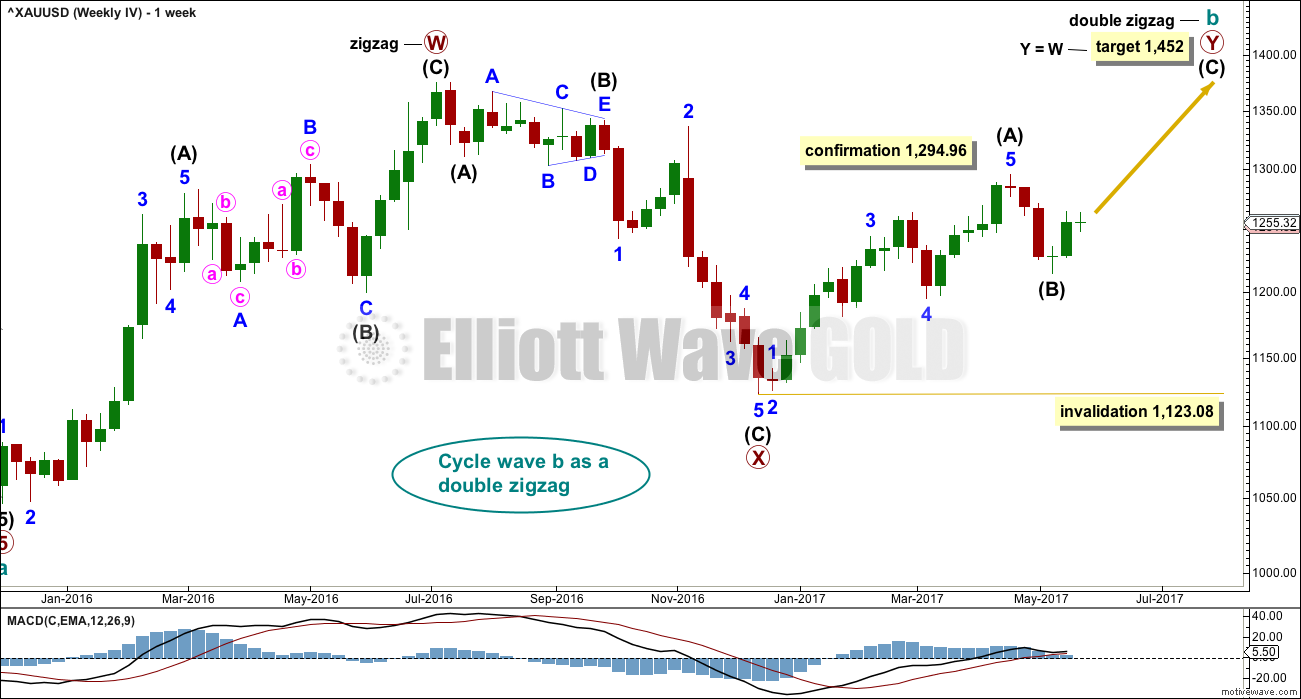
WEEKLY CHART I
Click chart to enlarge.
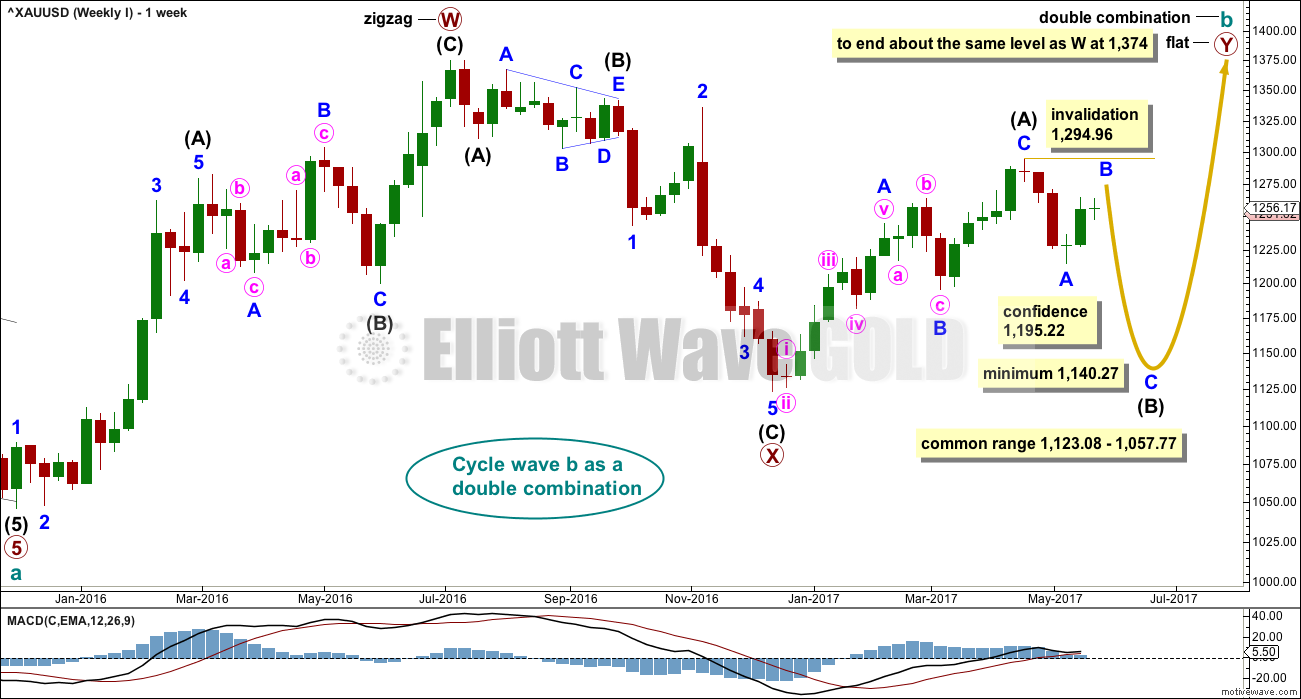
Combinations are very common structures. Cycle degree waves normally last one to several years, and B waves do tend to be more time consuming waves than all other waves. Given these tendencies the most likely scenario at this point may be that cycle wave b is an incomplete double combination.
The first structure in the double labelled primary wave W fits as a zigzag. This upwards movement will subdivide as either a three (zigzag) or a five (impulse). It does have a three wave look to it.
The double is joined by a deep three in the opposite direction labelled primary wave X, which is a 0.77 depth of primary wave W. X waves within double combinations are normally very deep; this one looks right.
The second structure in the combination may be either a triangle or a flat correction. Both of these structures have A waves which subdivide as threes.
At this stage, the upwards wave from the low in December 2016 does now look best and subdivide best as a completed zigzag. This may be intermediate wave (A) of a flat correction or a triangle. Because a triangle for primary wave Y would look essentially the same as the second weekly chart below, only a flat correction is considered here. The most common two structures in a double combination are a zigzag and a flat.
This wave count follows the most common scenario and has the best fit.
Within the flat correction of primary wave Y, intermediate wave (B) must retrace a minimum 0.9 length of intermediate wave (A) at 1,140.27. The most common length for intermediate wave (B) is from 1 to 1.38 times the length of intermediate wave (A), giving a common range from 1,123.08 to 1,057.77.
Intermediate wave (B) may subdivide as any corrective structure, but the most common structure for B waves within flats is a zigzag. At this stage, on the hourly chart it looks like a five down labelled minor wave A is complete, which would indicate intermediate wave (B) is a zigzag subdividing 5-3-5.
The daily and hourly charts will follow this weekly chart. That does not mean the other three weekly charts aren’t possible, they are, but the number of charts must be kept reasonable on a daily basis.
WEEKLY CHART II
Click chart to enlarge.
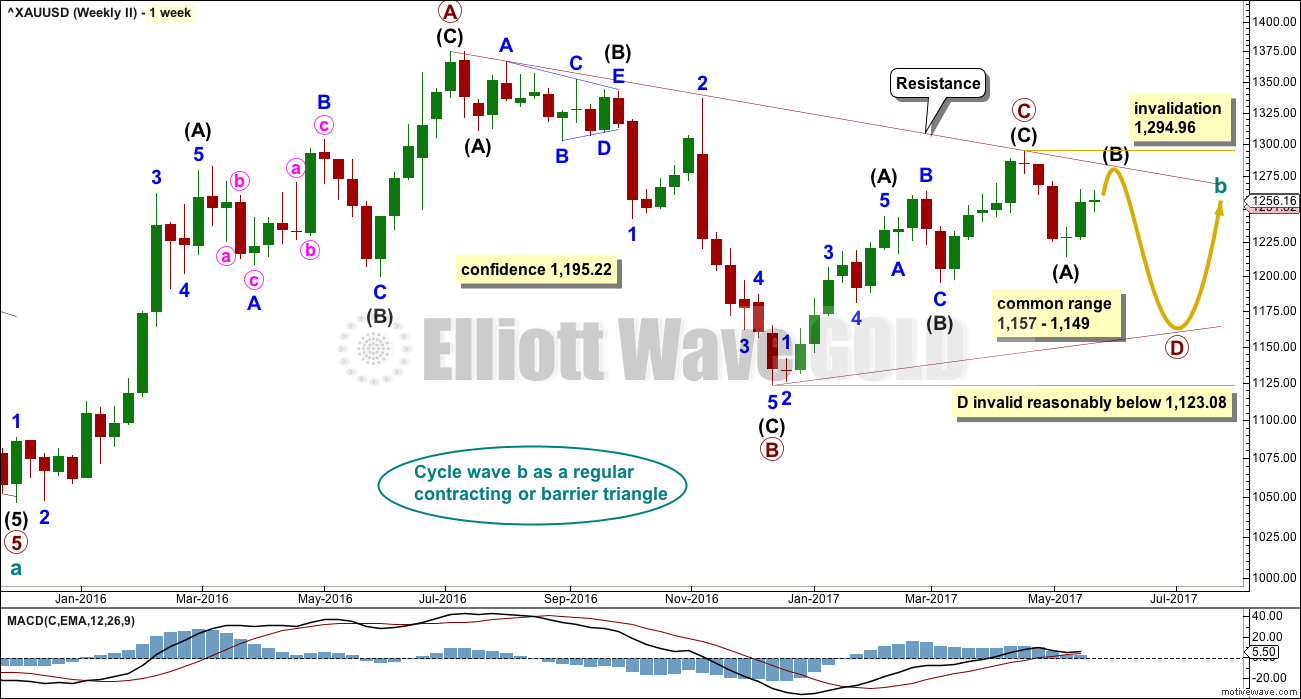
What if cycle wave b is a triangle? This is also entirely possible. Triangles are not as common as double combinations, but they are not uncommon.
Within the triangle, primary waves A, B and C are all single zigzags. One of the five subwaves of a triangle normally subdivides as a more complicated multiple, usually a double zigzag. This may be what is unfolding for primary wave D. It may also subdivide as a single zigzag.
Primary wave D of a regular contracting triangle may not move beyond the end of primary wave B below 1,123.08.
Primary wave D of a regular barrier triangle should end about the same level as primary wave B at 1,123.08, so that the B-D trend line is essentially flat. What this means in practice is that primary wave D may end slightly below 1,123.08 and the triangle would remain valid. This is the only Elliott wave rule which is not black and white.
Thereafter, primary wave E should unfold upwards and would most likely fall a little short of the A-C trend line. If not ending there, it may overshoot the A-C trend line. Primary wave E may not move beyond the end of primary wave C above 1,294.96.
Triangles normally adhere very well to their trend lines. Occasionally, price may overshoot the trend lines but when this happens is not by much and is quickly reversed. The upper A-C trend line should offer very strong resistance at this stage if cycle wave b is unfolding as a triangle. This trend line is added to the daily chart below.
At this stage, the structure on the hourly chart is still the same for both this weekly wave count and the first weekly wave count: a zigzag downwards is unfolding. However, they now diverge in how far down the next wave is expected to go. This second weekly wave count expects a more shallow movement to not end reasonably below 1,123.08.
DAILY CHART
Click chart to enlarge.
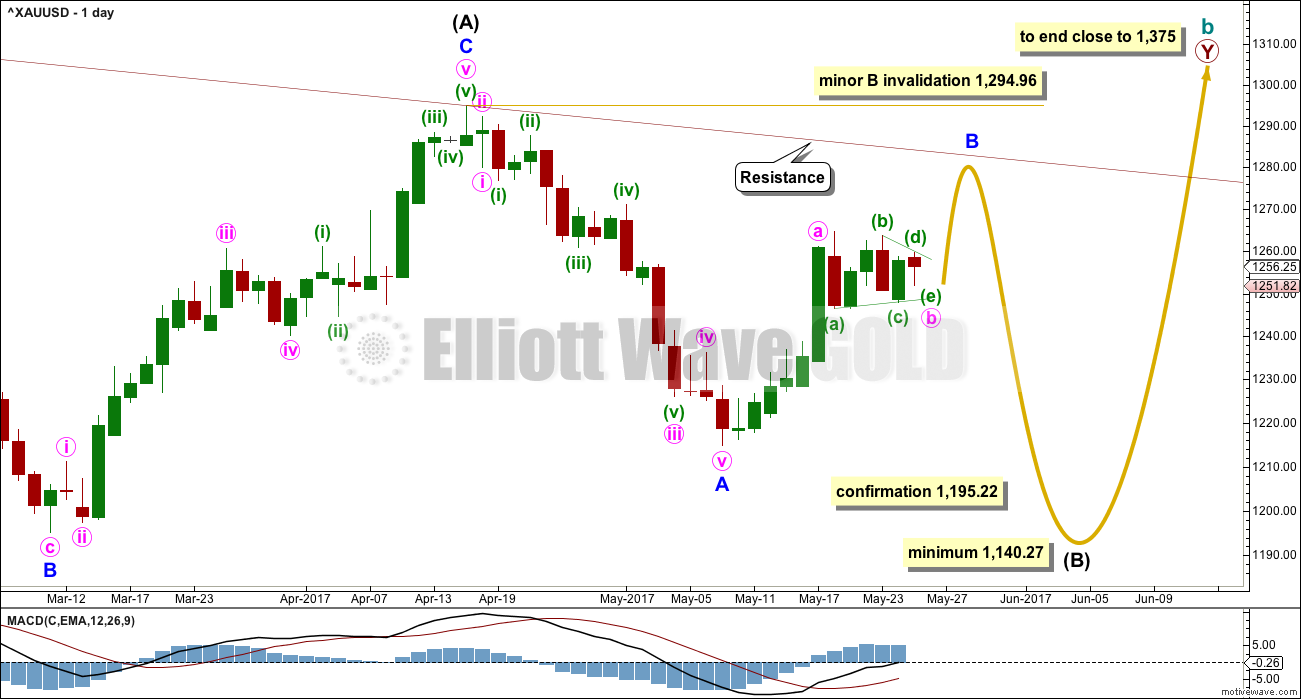
This daily chart will suffice for both weekly charts above, although the labelling follows weekly chart I.
Both weekly charts expect a zigzag downwards. (It may also turn out to be a double zigzag. For now a single only will be charted but a double will be kept in mind). Weekly chart I expects a deep zigzag for intermediate wave (B) to a minimum at 1,140.27. Weekly chart II expects a zigzag down for primary wave D to not move below 1,123.08 and most likely fall well short of that point.
The daily chart follows the expectations for weekly chart I, but the structure for weekly chart II would be exactly the same at this stage.
Within the flat correction of primary wave Y, intermediate wave (B) must retrace a minimum 0.9 length of intermediate wave (A) at 1,140.27. The most likely corrective structures to achieve the deep correction required for B waves within flats are single or multiple zigzags. These begin with a five, then a three in the opposite direction.
Minor wave A is complete. Minor wave B may be an incomplete zigzag.
Within the zigzag, there are now three hourly wave counts for minute wave b and an alternate that sees minor wave B complete.
Minor wave B may not move beyond the start of minor wave A above 1,294.96.
HOURLY CHART – TRIANGLE
Click chart to enlarge.
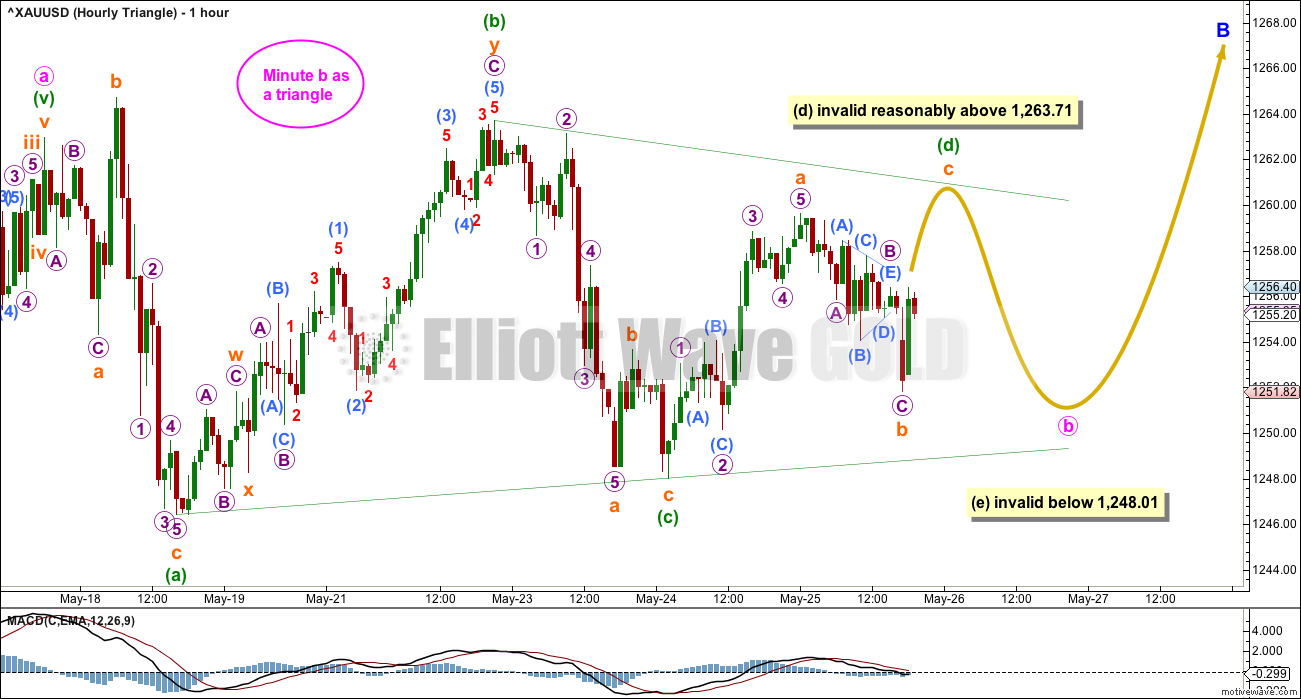
Minute wave b at this stage looks slightly more likely to be continuing sideways as a triangle.
Within a triangle, all sub-waves must subdivide as threes and four of the five sub-waves must be zigzags or zigzag multiples. Only one of the five sub-waves may be a more complicated multiple. So far minuette wave (b) may be the double zigzag. Minuette wave (a) may have been an expanded flat. All remaining triangle sub-waves must be simple zigzags.
Minuette wave (d) of a contracting triangle may not move beyond the end of minuette wave (b) above 1,263.71.
Minuette wave (d) of a barrier triangle should end about the same level as minuette wave (b) at 1,263.71. As long as the (b)-(d) trend line remains essentially flat the triangle idea will remain valid. Unfortunately, this Elliott wave rule is not black and white.
At this stage, the upper (b)-(d) trend line is drawn from the end of minuette wave (b) across the high of micro wave 2 within minuette wave (c). Triangles normally adhere strictly to their trend lines, and sub-waves within triangles commonly touch those trend lines. Minuette wave (d) may end when price comes up to touch this trend line as it is drawn.
The final wave of the triangle for minuette wave (e) may not move beyond the end of minuette wave (d), below 1,248.01.
Thereafter, another upwards wave for minute wave c would still be required to complete the zigzag for minor wave B.
If price does continue as the triangle outlines, then when it is complete a target may be calculated for minute wave c upwards to end the zigzag for minor wave B. That cannot be done yet because it is now known where minute wave b ends and minute wave c begins.
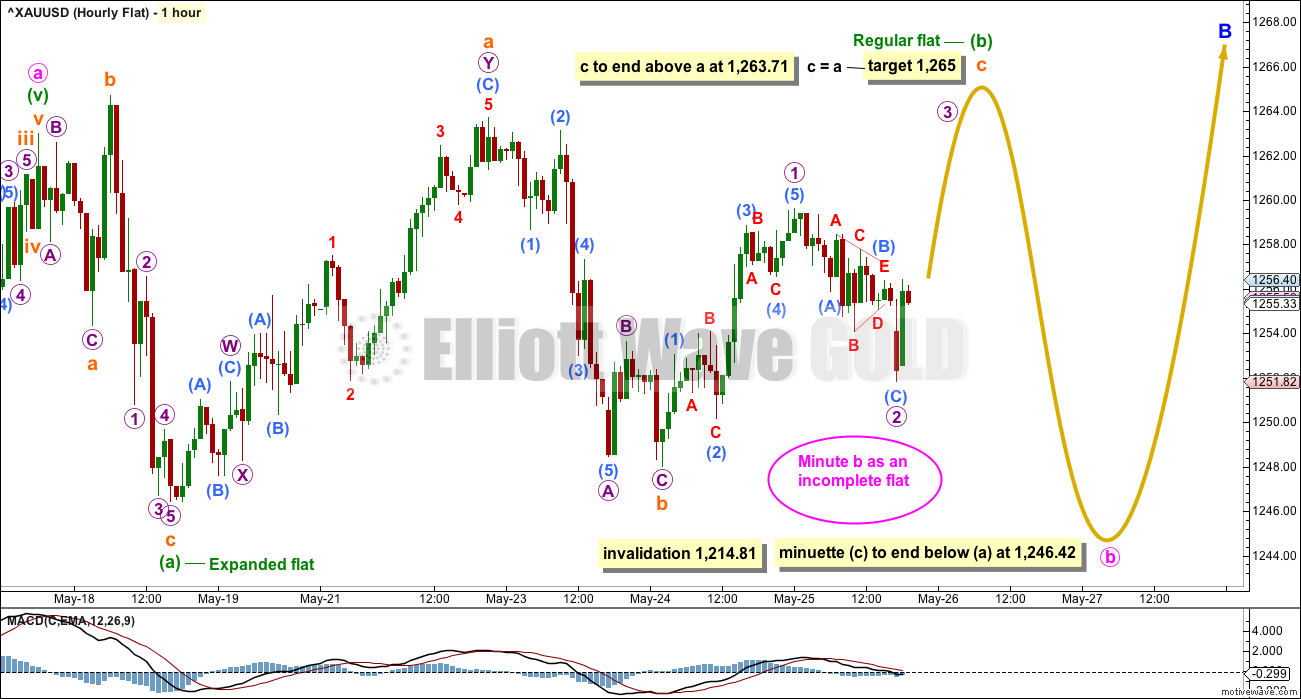
HOURLY CHART – FLAT
Click chart to enlarge.
When a triangle is considered, it is vital that other options are considered also. Too often I have seen what looks like a triangle to be unfolding, or even completed, only to then see price make an unexpected movement and invalidate the triangle.
What if a flat correction is still unfolding for minute wave b and minuette wave (b) within it is still incomplete?
Within a flat correction, both of waves A and B must subdivide as threes. Here, minuette wave (a) is an expanded flat and this is classified as a three. Minuette wave (b) may be an incomplete regular flat, also classified as a three.
Within the regular flat of minuette wave (b), it would be extremely likely that subminuette wave c would move at least slightly above the end of subminuette wave a at 1,263.71 to avoid a truncation. The target would see this achieved.
Thereafter, minuette wave (c) would be extremely likely to move at least slightly below the end of minuette wave (a) at 1,246.42 to avoid a truncation.
This wave count allows for further sideways movement in an ever increasing range. It is possible that the triangle above may be invalidated, yet the larger picture of minute wave b completing followed by minute wave c to break out upwards may still be correct.
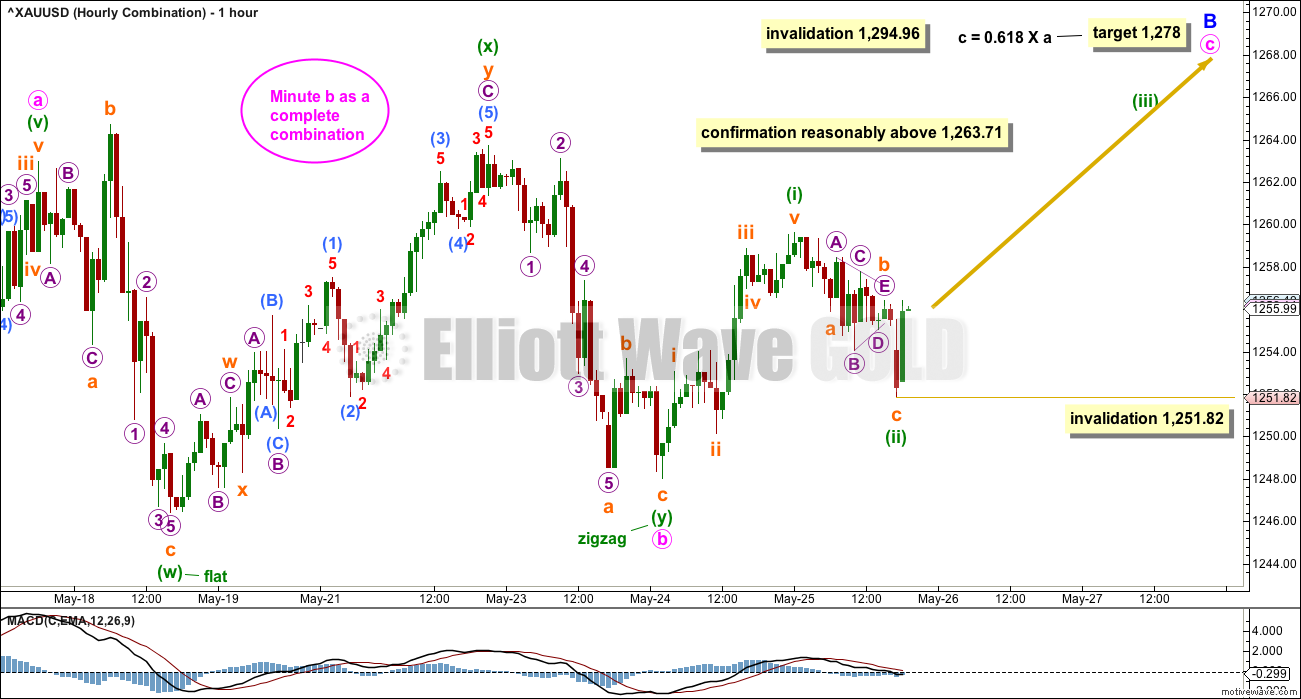
HOURLY CHART – COMBINATION
Click chart to enlarge.
Minute wave b may be a complete double combination. These are very common structures. The most common combination of corrective structures in a double is a zigzag and a flat.
Minuette wave (w) fits as an expanded flat. Minuette wave (y) fits now as a completed zigzag.
The maximum number of corrective structures is three within doubles and triples. Thus the sub-waves of W, Y and Z may only be labelled as A-B-C structures (or A-B-C-D-E in the case of triangles). To label multiples within multiples increases the number of corrective structures beyond three violating the Elliott wave rule.
The maximum does not apply to the joining structures labeled X, otherwise the maximum would be five. X waves may be any corrective structure, including multiples. While this is possible, it is not very common. Here, the possible double zigzag for minuette wave (x) does slightly reduce the probability of this wave count. X waves are more commonly simple corrections.
Combinations are sideways movements and to achieve the sideways look their X waves are normally deep. X waves within combinations may make new price extremes beyond the start of wave W (or Y within triples). They may behave like B waves within expanded flats.
While double combinations are very common structures, triples are very rare, almost rarer than running flats. For this reason, once a possible double combination may be complete, it is more likely that the whole correction may be complete than it is to continue further as a triple.
At this stage, some confidence may be had in this wave count if price makes a new high reasonably above 1,263.71.
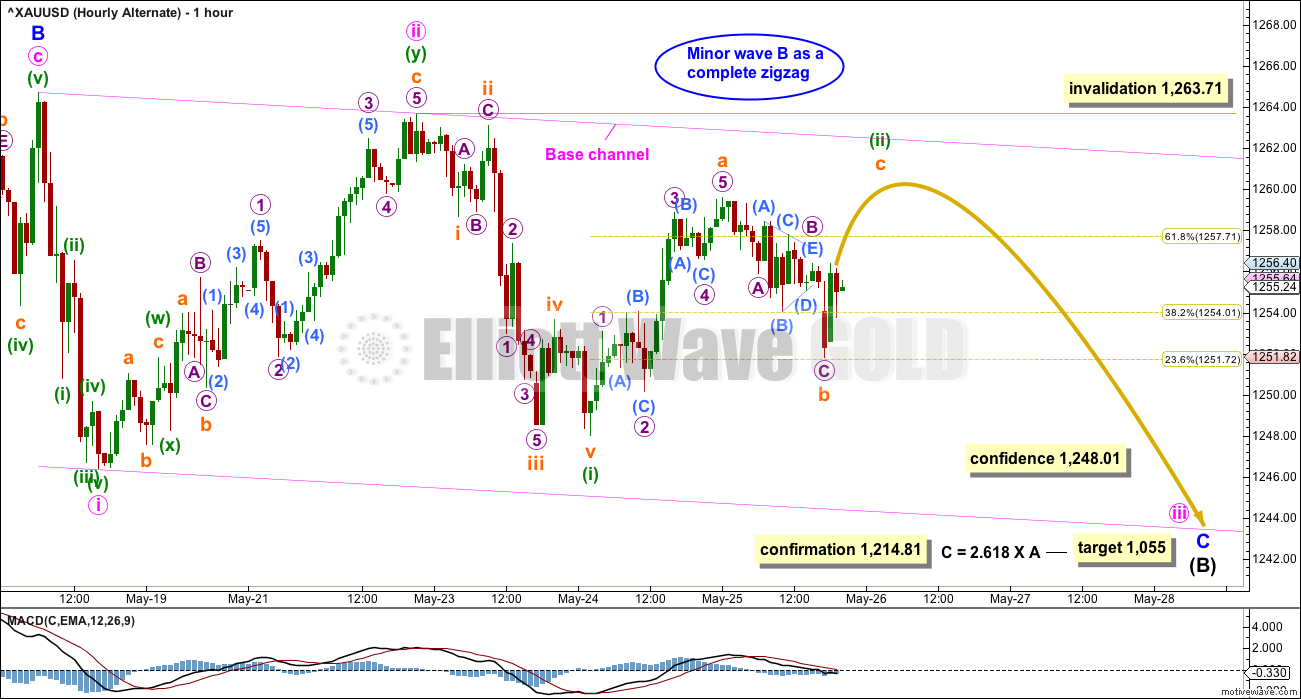
ALTERNATE HOURLY CHART
Click chart to enlarge.
It is also still possible that minor wave B is over. This wave count has the lowest probability of all the four hourly charts published today. If minor wave B is over, then within it minute wave b was a remarkably brief and shallow zigzag. This reduces the probability of this wave count.
This wave count would be confirmed with a new low below 1,214.11. However, before that, a strong downwards day with support from volume would be considered a downwards breakout from a small consolidation and would see this wave count substantially increase in probability.
WEEKLY CHART IV
Click chart to enlarge.
What if the bull market beginning in December 2015 remains intact? Price has essentially been moving sideways since that date, so all possibilities should be considered.
The Morning Doji Star at the low labelled intermediate wave (B) will not be considered as a reversal pattern here because it comes in what is essentially a sideways movement. It does not come after a downwards wave, so there is nothing to reverse.
This wave count requires confirmation above 1,294.96. That would invalidate the first three weekly charts (the third is seen in historic analysis only).
It is possible that cycle wave b is continuing higher as a double zigzag. However, double zigzags normally have brief and shallow X waves. The purpose of the second zigzag in a double (and the third when there is one) is to deepen the correction when price does not move deep enough in the first (or second) zigzag. Thus double (and triple) zigzags normally have a strong and clear slope against the prior trend. To achieve this look their X waves normally are brief and shallow.
In this case, primary wave X is neither brief nor shallow. It is a 0.77 depth of primary wave W and lasted 0.74 the duration of primary wave W. Overall, this does not have a typical look of a double zigzag so far.
This wave count also must see the rise up to the high labelled intermediate wave (A) as a five wave impulse, not a three wave zigzag. This looks a little forced, so it reduces the probability of this wave count.
This wave count should only be used if confirmed with a new high above 1,294.96. Low probability does not mean no probability, but should always be given less weight until proven.
TECHNICAL ANALYSIS
WEEKLY CHART
Click chart to enlarge. Chart courtesy of StockCharts.com.
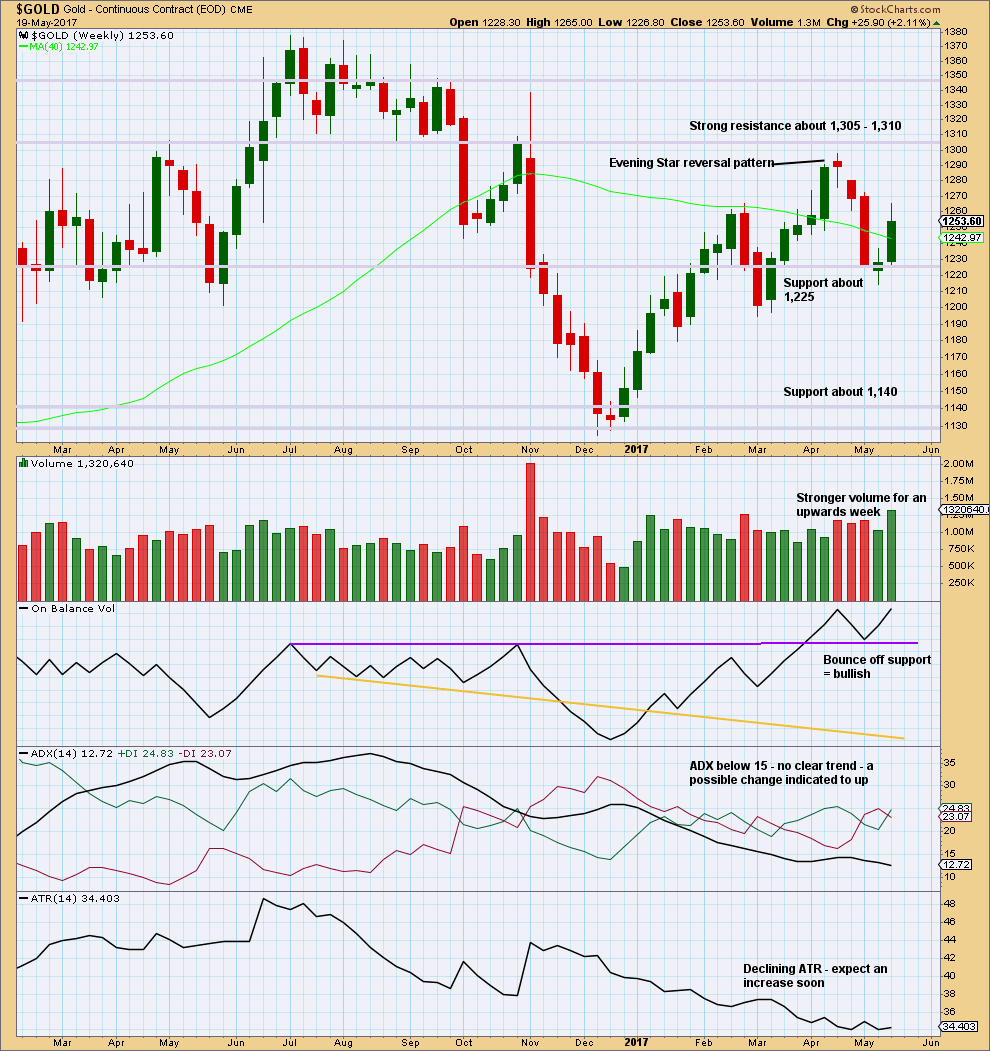
Volume last week strongly supports upwards movement. This is bullish.
Since the low in December 2017, price has still made higher highs and higher lows. This upwards trend would be indicated as possibly over only if price makes a new low below 1,194.50.
On Balance Volume is bullish.
ADX and ATR both indicate an unclear and weak trend.
DAILY CHART
Click chart to enlarge. Chart courtesy of StockCharts.com.
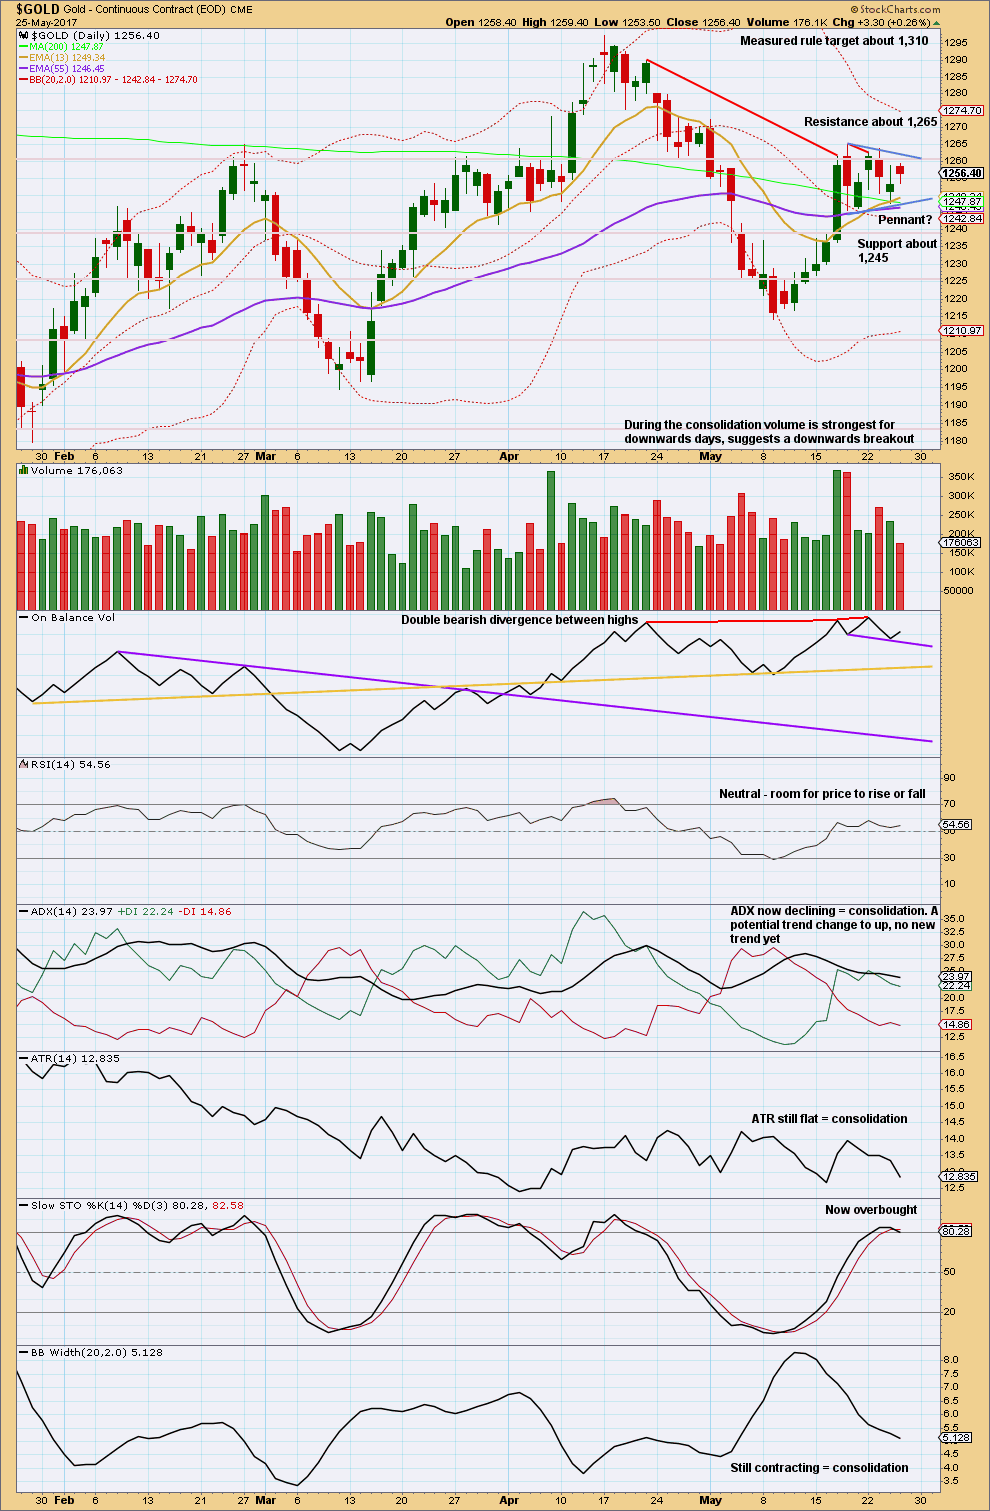
Price is range bound with resistance about 1,265 and support about 1,245. During this range bound movement, it is so far two downwards days that have strongest volume. This suggests a downwards breakout is more likely than upwards.
This view is supported by double bearish divergence between price and On Balance Volume which still exists. This would tend to support the alternate hourly wave count.
ADX, ATR and contracting Bollinger Bands all agree that the market is most likely consolidating.
A small pennant pattern looks to be forming. Pennants and flags are the most reliable continuation patterns, and this pattern suggests an upwards breakout. The measured rule would be used for a target taking the flag pole as 50.7 in length and the breakout from the pennant expected to be about 1,260. This gives a target of 1,310, which is a very strong area of prior support, and it should offer good resistance.
The pennant pattern and volume contradict each other on expected breakout direction.
A new support line is added today to On Balance Volume. It offers only weak technical significance at this stage.
GDX
DAILY CHART
Click chart to enlarge. Chart courtesy of StockCharts.com.
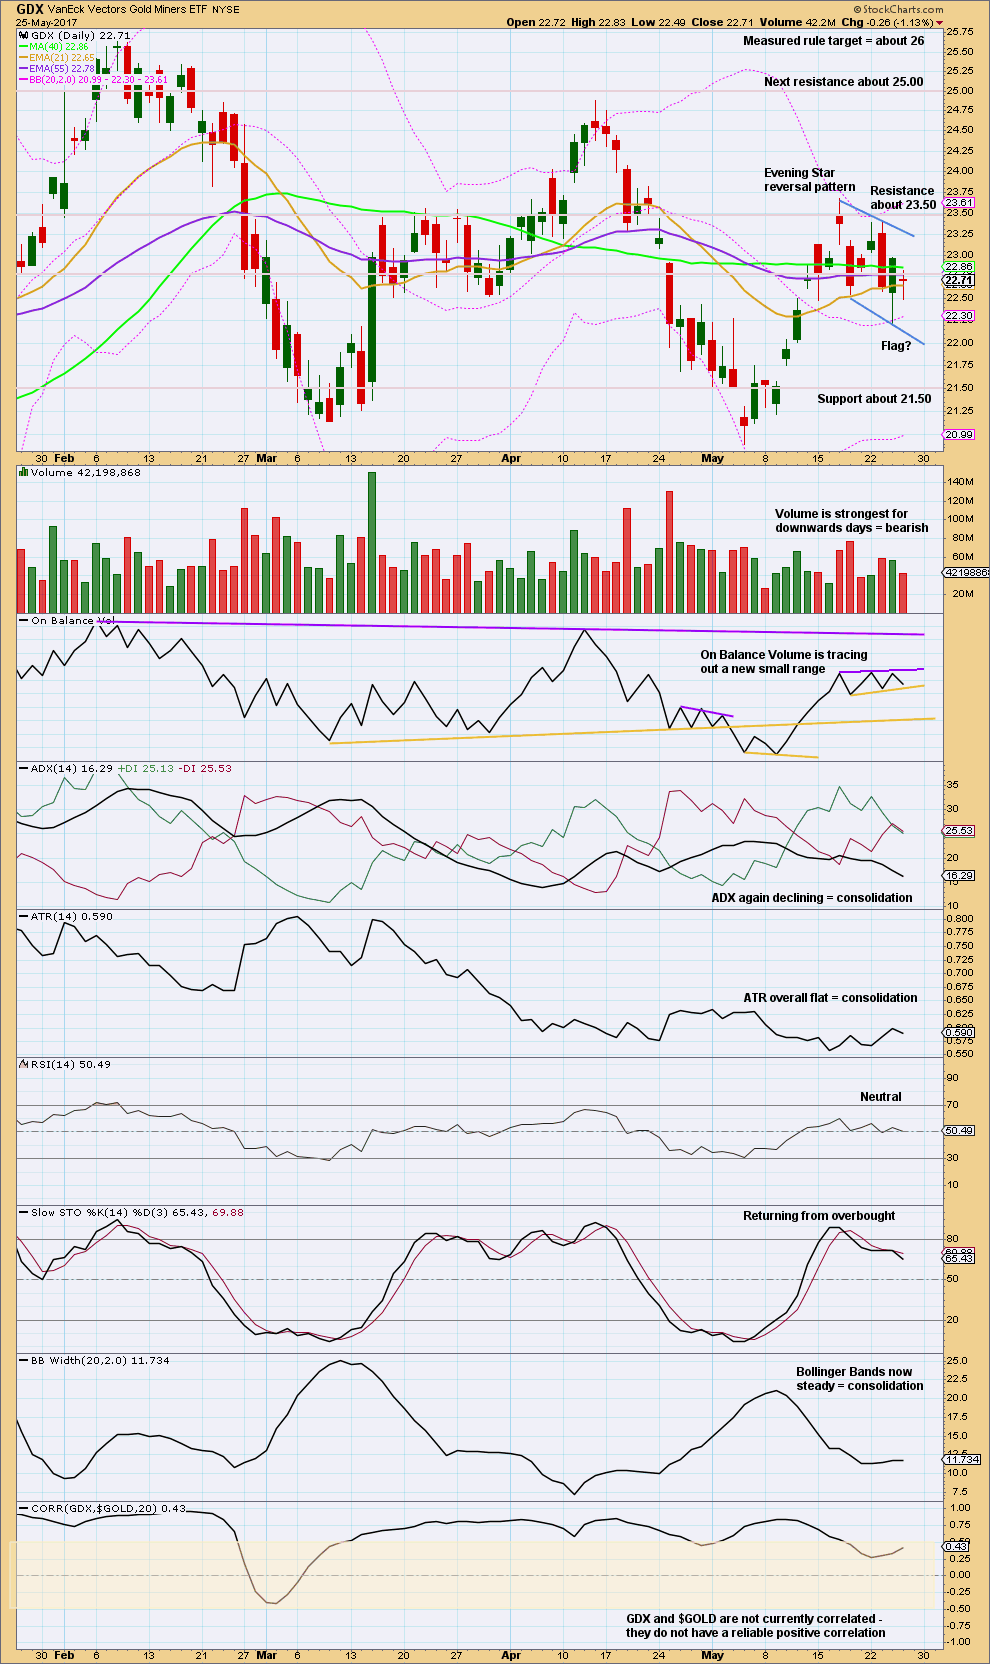
As with Gold, GDX has a contradiction in this chart between bearish volume and a possible bullish flag pattern.
This analysis is published @ 08:31 p.m. EST.
Some mixed signals on the strength of the breakout.
Volume only increased slightly and OBV has not broken out upwards yet.
In summary, probably still going higher to test the downtrend line. What happen there will be key.
OBV may find resistance there.
I think I’ve finally figured out what NZDUSD may be up to.
A leading expanding diagonal may have just recently finished. These are normally followed by very deep corrections, so I’d expect minor 2 to be deeper than the 0.618 Fibonacci ratio.
So now I’ll expect it to move higher in choppy overlapping movement for a few weeks.
This is also possible. The triangle may be complete. Minuette (d) doesn’t look perfect though, within it subminuette c doesn’t look like a very good five. It looks like a three.
The rest of it actually looks good.
If minor B is over here then minute c is just 0.77 short of 0.382 X minute a.
Gold does exhibit remarkably short and brief fifth waves out if it’s fourth wave triangles. It can sometimes also do that for it’s C waves out of B wave triangles.
B aware, this could be a false upwards breakout. If volume isn’t heavy then we may need to very seriously consider this idea.
Anyone selling their GDX / GDXJ positions?
Based on the charts, we knew they had limited upside potential but with Gold’s move up today, both of these stocks can’t gain traction or volume.
As always, thoughts are appreciated and I thank everyone for their valuable contributions.
Even though volume and price performance in miners is lacking today, and Monday is a holiday, I think miners have more up to go. That said, its a risky hold. 😣
The commercials just shorted 49k contracts. That was reported for Tuesday’s positions. Gold has gone up since then so they probably shorted more…..rather be short than long here…..but safer to be on sidelines. They are often right. That is a pretty big difference week to week and suggests they think the gold market is going down……I’m out. Lara’s chart above looks ominous
If this strong upwards day comes with an increase in volume then it will look like a classic upwards breakout from a small pennant pattern.
These are the most reliable continuation patterns. The measured rule gives a target at 1,310, higher than the Elliott wave target.
Today it looks like the combination may be the correct chart, but TBH the new flat idea will also technically fit.
How low the next correction goes will differentiate the two ideas.
If this (which will now be the main hourly wave count) sees a sideways small consolidation here, ending at a target of the 0.236 Fibonacci ratio at 1,265.29, then price continues up, this wave count would be confirmed. We’d then have a five up.
The target for now is 1,278 but when minuette (iv) is complete I’ll recalculate the target using the ratios at minuette degree. At that stage it’s probably going to change and probably be lower.
Last night’s move upward in gold was parabolic, on no news. It doesn’t seem sustainable, imo. We shall soon see.
John, Better when the move is with no news IMHO. Then the move is more likely underlying fundamentals / sentiment.
See chart attached by Graddhy. Based on the pattern breakout, not a surprise to see a swift move. We do need to see some volume today to back it up.
Like you said, we’ll see.
Dreamer Halfway patterns are very bullish (Rambus). Look on the left side just across there is a similar halfway pattern and how price behaved after BO.
John. I beg to differ. The fundamentals do indeed dictate such a move. As I have pointed out:
(a) prices broke above the top cloud boundary; and
(b) there is a bullish crossover of the tenkan-sen and kijun-sen.
Also,
(c) price has broken through a long-held resistance barrier 1260-1265. If it can hold above this, then the bullish trend, at least in the short-term, will continue.
These positive factors suffice. We do not need any news, translated to investor sentiment to stimulate prices. Savvy investors are not stupid; they know a good thing when they see one.
Ergo, the head and shoulders pattern that some of us were talking about last week, alluding to a steep fall in prices, appears to have been deactivated. That was the cornerstone in the belief of a southward movement. The new fad seems to be the flag pennant that Dreamer showed. Once this turns into a reality, more investors could join the bandwagon, fuelling the rise a la the “new” trend that Papudi and I had thought to be an increasingly distinct possibility. And, news will be tweaked to match the new trend. They always do. That’s how news media folks earn a living. All said, we only need to beware of a blatant manipulation by the banksters.
Hi John. Interesting the way this is going with 1264 holding and 1268 resisting. Although hourly & 4-hourly RSI are tagging 70+, a break above 1268-69 appears more likely and should look to seek 1277+. Imo a break below 1264 may not get past 1260 for 1257-55.
Alan/Dreamer
Thanks
Credit goes to Lara and my old guru Alf Field.
I have kept up Lara’s May 2 wave count and have been watching since than.
This is her count from past.
http://elliottwavegold.com/2017/05/gold-elliott-wave-technical-analysis-2nd-may-2017/
Thanks for the info, Papudi.
I forgot that Lara had thought about the idea early on. Great foresight on her part.
Woohoo! Finally getting some price movement and some invalidations to narrow down the options. The Hourly combination or maybe even a more bullish count may be in play… 😃 1,266.81 high so far…
Ichimoku Gold Quick Update
Data as at 5:55 am ET May 26
========================
Gold price has broken out above the cloud at the 1-hour level. The tenkan-sen had crossed the kijun-sen from below, a bullish crossover which lends impetus to the move up.
Prices look set to move toward 1278. At the moment, the Hourly Triangle is invalidated as prices had risen quite significantly above the B-D line. The Hourly Combination may be in play if this is a third wave. The Hourly Flat will experience an expanded flat in Minute B. Both are still valid. Let’s see how price progresses later on in the day.
If Lara’s bull alt wave count is valid than PM wave 3 target is near 1450.
If PM wave 3 is equal to PM wave 1 than target will be around 1483.
Invalidation below 1214. Confirmation above 1294. OR break above the resistance line.
http://stockcharts.com/h-sc/ui?s=%24GOLD&p=D&st=2015-11-02&en=today&id=p10663437317&a=377559287
Papudi. I’m glad you concur.
This count is exactly the same as the one I surmised and posted below, except for the Primary waves — mine is WXY, the one you post is a 5-wave one. Lol, you should have posted this earlier, saving me the 1 hour I took to figure it out from scratch.
Papudi, I like your optimism!
If Lara’s bull alt wave count is valid than PM wave 3 target is near 1450.
If PM wave 3 is equal to PM wave 1 than target will be around 1483.
Invalidation below 1214. Confirmation above 1294. OR break above the resistance line.
http://stockcharts.com/h-sc/ui?s=%24GOLD&p=D&st=2015-11-02&en=today&id=p10663437317&a=377559287
Ichimoku Gold Daily Analysis
Data as at 5:20 am ET May 26
========================
Gold price dropped yesterday, entering the cloud. It is in consolidation at the moment, trading above both the tenkan-sen and the kijun-sen. Price is near the upper cloud boundary and a daily close above it will be a bullish sign that will push price towards 1280 – 1300. On the other hand, a close below the lower cloud boundary at 1245.30 will be a bearish sign. On balance, it appears that a breakout above the cloud seems more probable. The tenkan-sen is on the verge of crossing the kijun-sen from below. This will provide investors with something to cheer and so it should be a matter of time before buyers come back into the marketplace and start supporting gold again.
On a fundamental note, the drop in gold prices was attributed to a weaker than expected UK GDP report, allowing the dollar to gain traction and paving the way for lower gold prices. Prices then generated an inside day which is a consolidating scenario that reflects indecision.
Lara. The Weekly IV count as posted seem to run into difficulties with EW count.
May I propose the following instead:
Primary Y:
Start 1123.08 (2016 Dec 15)
Int A (or 1) 1244.49 (Feb 8)
Int B (or 2) 1195.22 (Mar 13) – expanded flat
Cycle B targets 1451.72, in which Primary Y = Primary W.
Intermediate C (or 3):
Start 1195.22
Minor 1 1294.96 (Apr 17)
Minor 2 1214.81 (May 9)
Minor 3, Minute 1:
Start 1214.81
Minuette 1 1236.88 (May 15, 0800 ET on 4-hourly chart)
Minuette 2 1228.09 (May 15, 1600)
Minuette 3 1264.72 (May 18, 0400)
Minuette 4 follows your hourly triangle count.
My apologies. I can’t draw all the points on a graph using Word. This is the best description I can come up with. So far I checked, all points meet Elliott Wave requirements.
I would appreciate it if you could go over this and give me some comments. So sorry for the trouble caused.
I can follow this idea. Chart attached. Is this correct?
If so, my biggest problem would be the lack of adherence to the channel. Minor 2 looks to be far too deep, and a bit too long in duration.
Technically it fits and meets all EW rules.
Lara. Thank you for spending valuable time in charting out the possible path for a more bullish count. The chart is simply perfect, with all points plotted correctly.
I agree with you that Minor 2 is far too deep, and too long in duration. A drop to about 1233 (instead of 1214.81) would have been just fine, but then not everything can be picture book perfect. I’ll be following this count to see if it can come to fruition.