
An upwards breakout looks to have occurred earlier than expected.
Summary: In the short term, a new low below 1,259.61 prior to a new high would add confidence in a trend change back to down. At that stage, the target would be 1,140 although this may be too low.
A new high on Monday would indicate minor wave B is most likely incomplete.
New updates to this analysis are in bold.
Last historic analysis with monthly charts is here, video is here.
Grand SuperCycle analysis is here.
MAIN ELLIOTT WAVE COUNT
For clarity I have decided at this time it may be best to publish on a daily basis weekly charts I, II and IV. Both weekly charts I and II expect a zigzag down to complete and the difference is in the expected depth. Weekly chart IV has a very low probability and will only be given serious consideration if price makes a new high above 1,294.96.
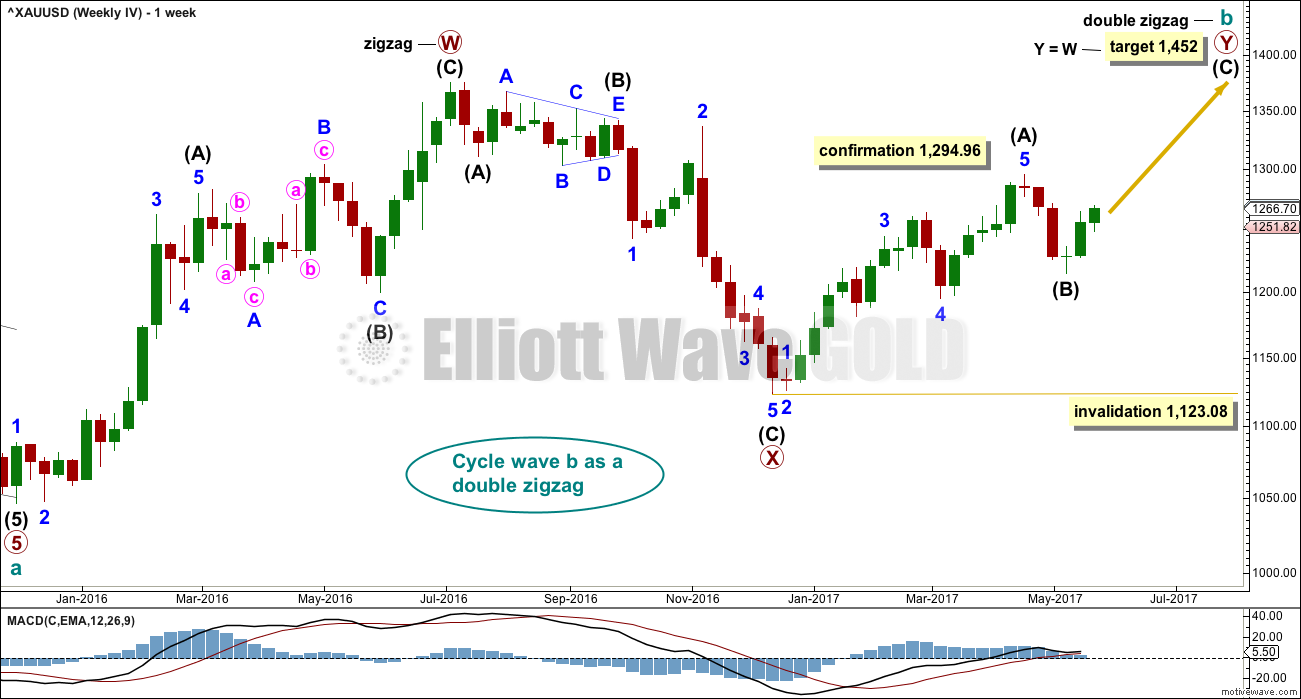
WEEKLY CHART I
Click chart to enlarge.
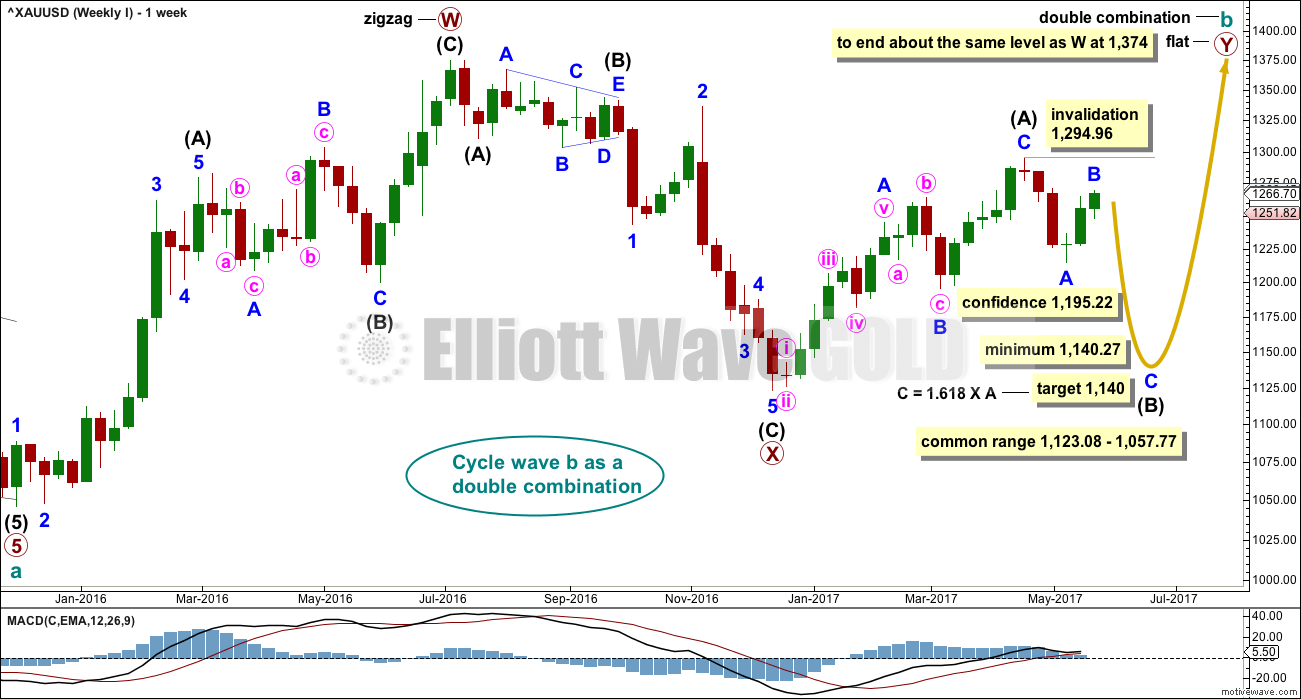
Combinations are very common structures. Cycle degree waves normally last one to several years, and B waves do tend to be more time consuming waves than all other waves. Given these tendencies the most likely scenario at this point may be that cycle wave b is an incomplete double combination.
The first structure in the double labelled primary wave W fits as a zigzag. This upwards movement will subdivide as either a three (zigzag) or a five (impulse). It does have a three wave look to it.
The double is joined by a deep three in the opposite direction labelled primary wave X, which is a 0.77 depth of primary wave W. X waves within double combinations are normally very deep; this one looks right.
The second structure in the combination may be either a triangle or a flat correction. Both of these structures have A waves which subdivide as threes.
At this stage, the upwards wave from the low in December 2016 does now look best and subdivide best as a completed zigzag. This may be intermediate wave (A) of a flat correction or a triangle. Because a triangle for primary wave Y would look essentially the same as the second weekly chart below, only a flat correction is considered here. The most common two structures in a double combination are a zigzag and a flat.
This wave count follows the most common scenario and has the best fit.
Within the flat correction of primary wave Y, intermediate wave (B) must retrace a minimum 0.9 length of intermediate wave (A) at 1,140.27. The most common length for intermediate wave (B) is from 1 to 1.38 times the length of intermediate wave (A), giving a common range from 1,123.08 to 1,057.77.
A target is now calculated for minor wave C to complete intermediate wave (B). This target would meet the minimum requirement for intermediate wave (B). If minor wave B moves any higher next week, then this target must be recalculated.
Intermediate wave (B) may subdivide as any corrective structure, but the most common structure for B waves within flats is a zigzag. At this stage, on the hourly chart it looks like a five down labelled minor wave A is complete, which would indicate intermediate wave (B) is a zigzag subdividing 5-3-5.
The daily and hourly charts will follow this weekly chart. That does not mean the other three weekly charts aren’t possible, they are, but the number of charts must be kept reasonable on a daily basis.
WEEKLY CHART II
Click chart to enlarge.
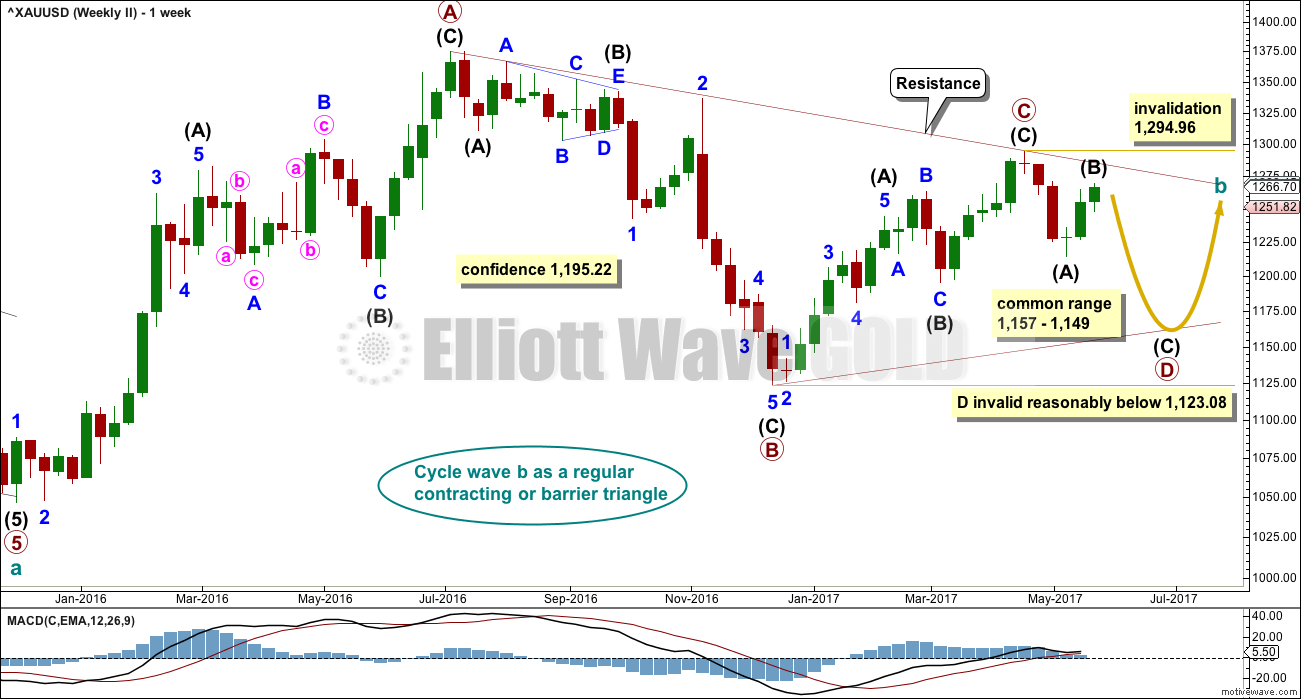
What if cycle wave b is a triangle? This is also entirely possible. Triangles are not as common as double combinations, but they are not uncommon.
Within the triangle, primary waves A, B and C are all single zigzags. One of the five subwaves of a triangle normally subdivides as a more complicated multiple, usually a double zigzag. This may be what is unfolding for primary wave D. It may also subdivide as a single zigzag.
Primary wave D of a regular contracting triangle may not move beyond the end of primary wave B below 1,123.08.
Primary wave D of a regular barrier triangle should end about the same level as primary wave B at 1,123.08, so that the B-D trend line is essentially flat. What this means in practice is that primary wave D may end slightly below 1,123.08 and the triangle would remain valid. This is the only Elliott wave rule which is not black and white.
Thereafter, primary wave E should unfold upwards and would most likely fall a little short of the A-C trend line. If not ending there, it may overshoot the A-C trend line. Primary wave E may not move beyond the end of primary wave C above 1,294.96.
Triangles normally adhere very well to their trend lines. Occasionally, price may overshoot the trend lines but when this happens it is not by much and is quickly reversed. The upper A-C trend line should offer very strong resistance at this stage if cycle wave b is unfolding as a triangle. This trend line is added to the daily chart below.
At this stage, the structure on the hourly chart is still the same for both this weekly wave count and the first weekly wave count: a zigzag downwards is unfolding. However, they now diverge in how far down the next wave is expected to go. This second weekly wave count expects a more shallow movement to not end reasonably below 1,123.08.
DAILY CHART
Click chart to enlarge.
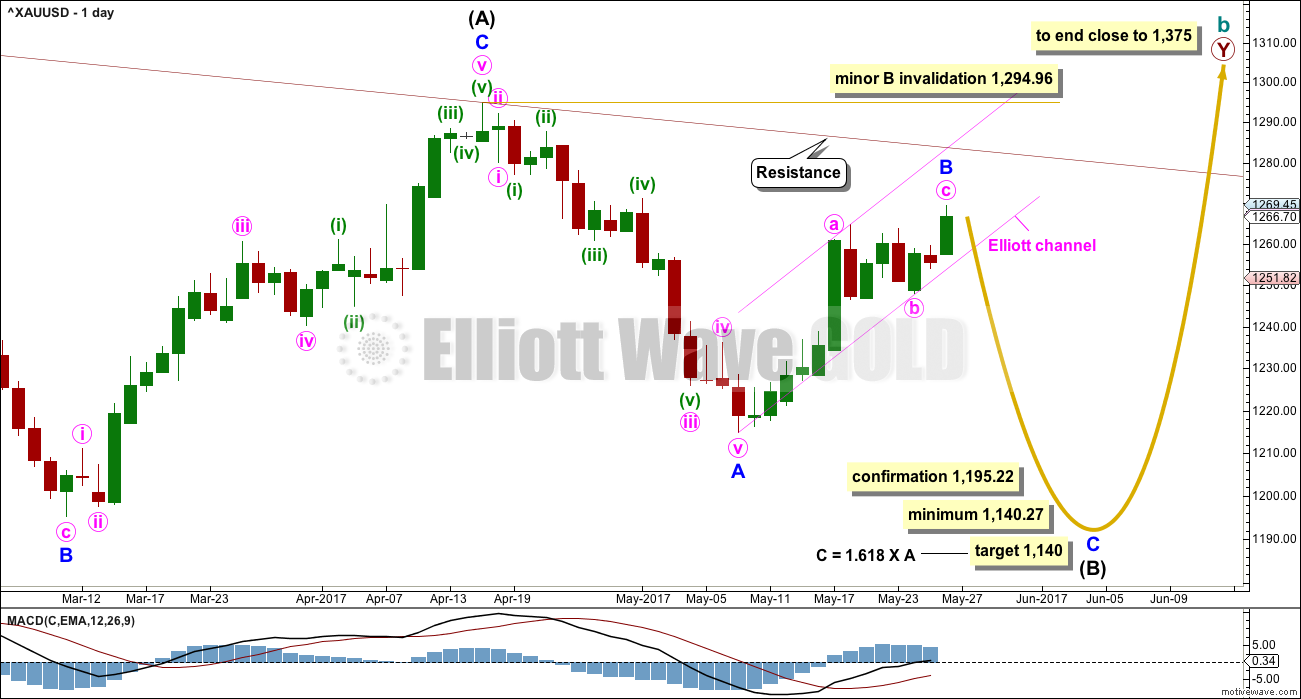
This daily chart will suffice for both weekly charts above, although the labelling follows weekly chart I.
Both weekly charts expect a zigzag downwards. (It may also turn out to be a double zigzag. For now a single only will be charted but a double will be kept in mind). Weekly chart I expects a deep zigzag for intermediate wave (B) to a minimum at 1,140.27. Weekly chart II expects a zigzag down for primary wave D to not move below 1,123.08 and most likely fall well short of that point.
The daily chart follows the expectations for weekly chart I, but the structure for weekly chart II would be exactly the same at this stage.
Within the flat correction of primary wave Y, intermediate wave (B) must retrace a minimum 0.9 length of intermediate wave (A) at 1,140.27. The most likely corrective structures to achieve the deep correction required for B waves within flats are single or multiple zigzags. These begin with a five, then a three in the opposite direction.
Minor wave A is complete. Minor wave B may now be a complete zigzag.
There are still three hourly wave counts for minor wave B below. They are presented in order of probability.
Minor wave B may not move beyond the start of minor wave A above 1,294.96.
HOURLY CHART – TRIANGLE
Click chart to enlarge.
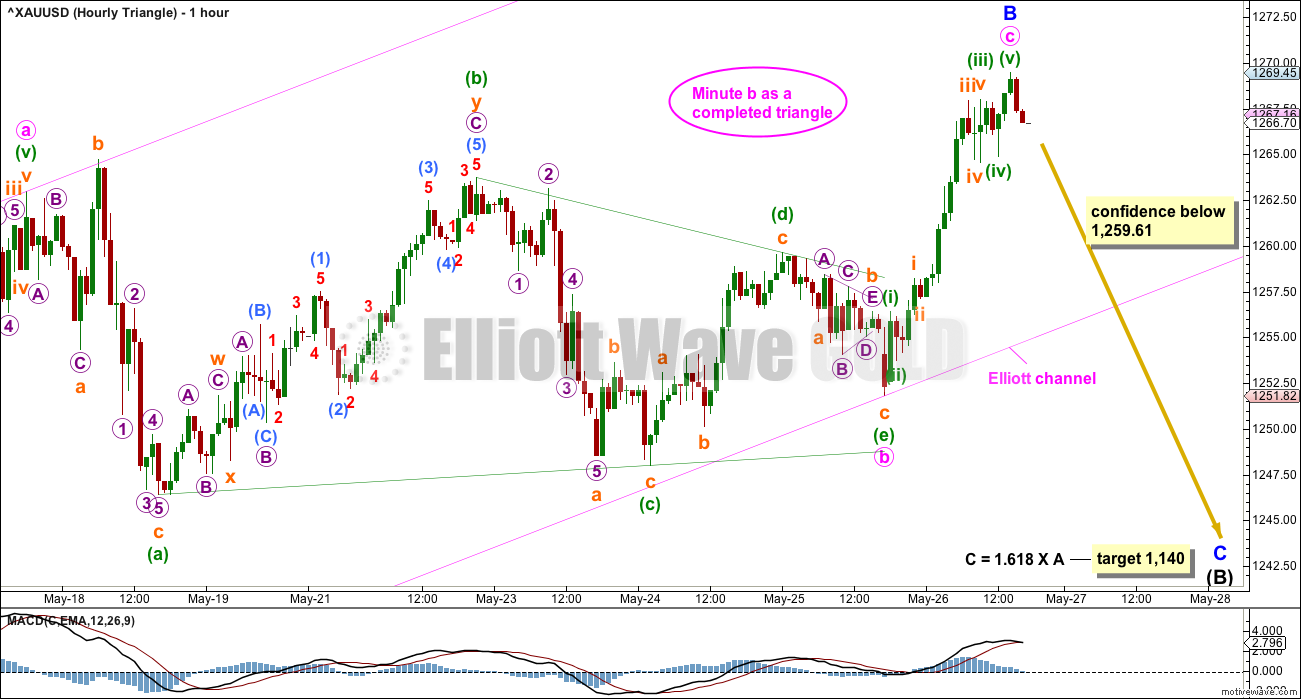
At the end of this week, this hourly chart has the best overall look of all three hourly charts. It does look like a triangle may have completed more quickly than originally expected, and that Friday’s sharp upwards thrust may have been minute wave c up and out of the triangle.
In the short term, a new low below 1,259.61 (prior to a new high) would invalidate the hourly charts below and provide some confidence in this triangle wave count.
Thereafter, a breach of the lower edge of the pink Elliott channel by downwards (not sideways) movement would provide further confidence in this triangle wave count.
If minor wave B is a complete zigzag, then within it minute wave c is just 0.77 short of 0.382 the length of minute wave a.
Gold does often exhibit remarkably short and brief fifth waves out of its fourth wave triangles. It can sometimes also exhibit this tendency for its C waves out of B wave triangles.
HOURLY CHART – FLAT
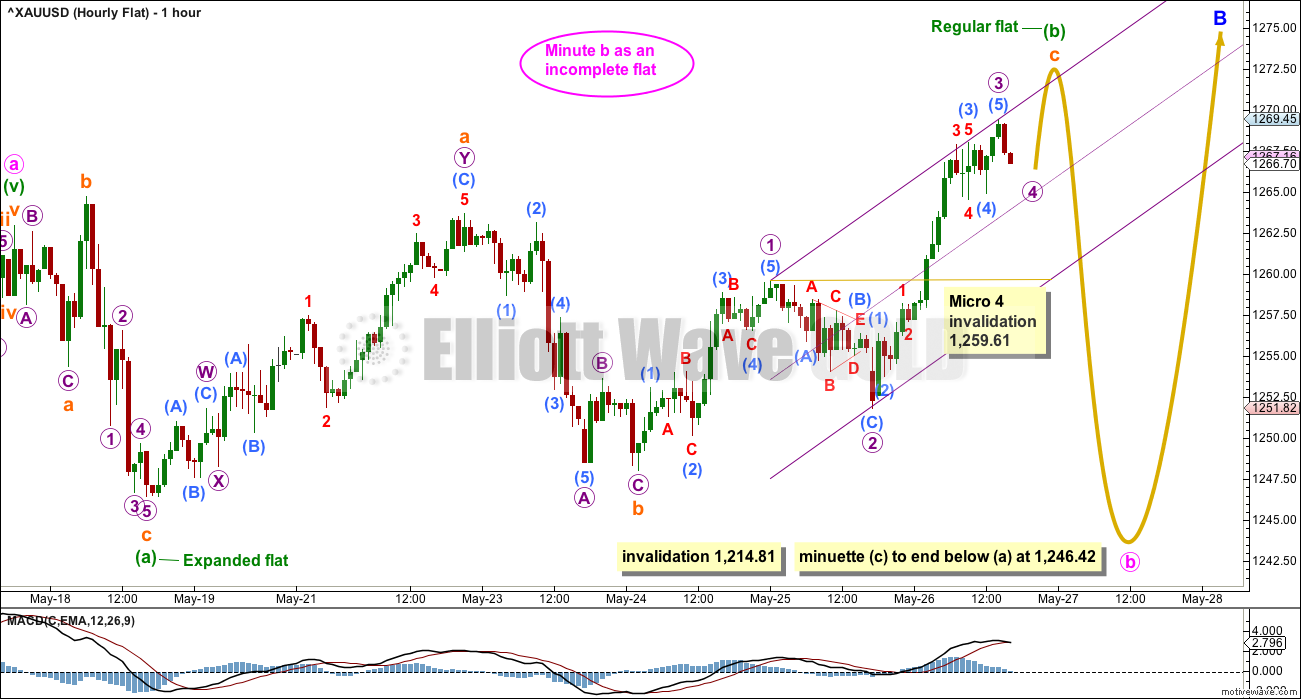
Click chart to enlarge.
When a triangle is considered, it is vital that other options are considered also. Too often I have seen what looks like a triangle to be unfolding, or even completed, only to then see price make an unexpected movement and invalidate the triangle.
What if a flat correction is still unfolding for minute wave b and minuette wave (b) within it is still incomplete?
Within a flat correction, both of waves A and B must subdivide as threes. Here, minuette wave (a) is an expanded flat and this is classified as a three. Minuette wave (b) may be an incomplete regular flat, also classified as a three.
Within the regular flat of minuette wave (b), subminuette wave c has now moved above the end of subminuette wave a at 1,263.71 avoiding a truncation. The structure of subminuette wave c is incomplete. It must complete as a five wave motive structure, so it needs to complete micro waves 4 and 5.
Micro wave 4 may not move into micro wave 1 price territory below 1,259.61.
Thereafter, minuette wave (c) would be extremely likely to move at least slightly below the end of minuette wave (a) at 1,246.42 to avoid a truncation.
This wave count allows for further sideways movement in an ever increasing range.
This wave count does not have as good a look as the first triangle wave count. Here, minuette wave (b) is technically a regular flat, but they more commonly have C waves that are about even in length with their A waves and end only a little beyond the end of the A wave. Here, subminuette wave c is already reasonably beyond the end of subminuette wave a, but the structure is incomplete and needs to continue higher.
HOURLY CHART – COMBINATION
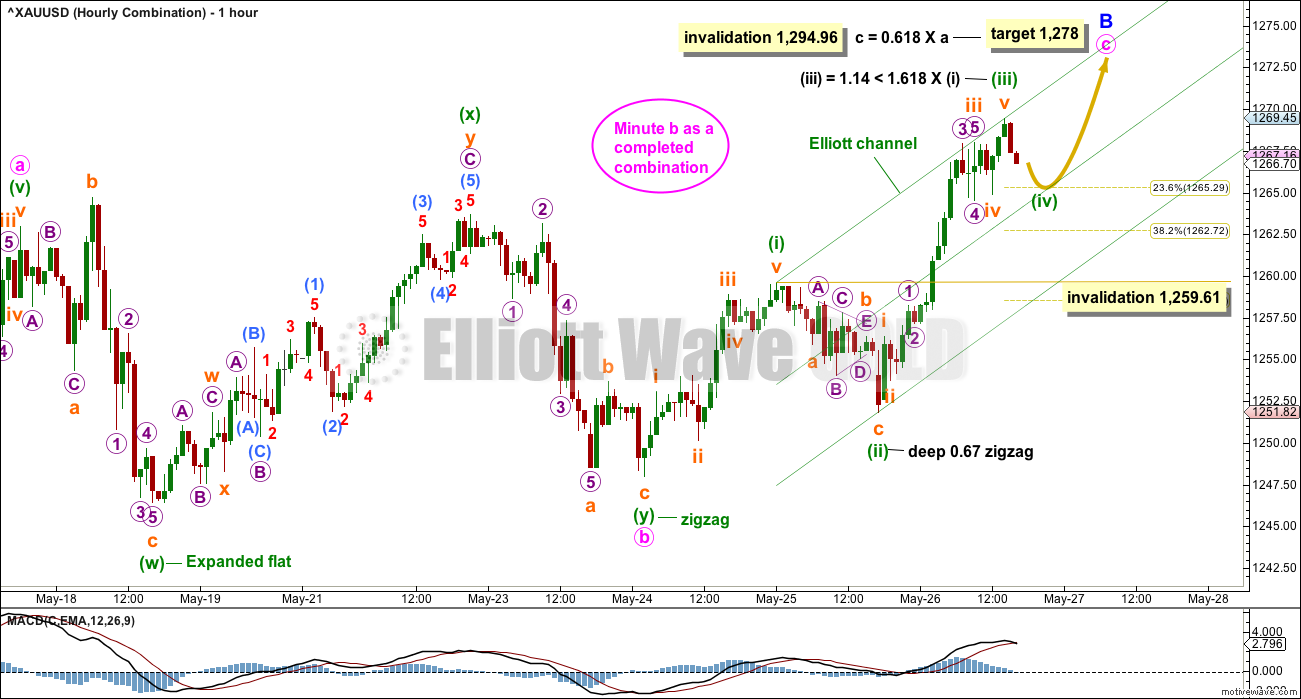
Click chart to enlarge.
Minute wave b may be a complete double combination. These are very common structures. The most common combination of corrective structures in a double is a zigzag and a flat.
Minuette wave (w) fits as an expanded flat. Minuette wave (y) fits now as a completed zigzag.
The structure for minute wave b is a big sideways movement. This looks typical for a double combination.
Within combinations, X waves may be any corrective structure including multiples. However, they are most commonly single zigzags. For this wave count, the multiple zigzag for minuette wave (x) reduces its probability.
Minute wave c must subdivide as a five wave motive structure, either an impulse or an ending diagonal. So far it looks very much like it would be an impulse. The structure is incomplete. It still needs the fourth and fifth waves to complete it.
Minuette wave (iv) may not move into minuette wave (i) price territory below 1,259.61.
When minuette wave (iv) is complete, then the target would be recalculated using Fibonacci ratios at minuette degree. At that stage, the target would change and would probably move lower. Minuette wave (v) would be equal in length with minuette wave (i), the most likely ratio, if it were to be 11.60 long.
WEEKLY CHART IV
Click chart to enlarge.
What if the bull market beginning in December 2015 remains intact? Price has essentially been moving sideways since that date, so all possibilities should be considered.
The Morning Doji Star at the low labelled intermediate wave (B) will not be considered as a reversal pattern here because it comes in what is essentially a sideways movement. It does not come after a downwards wave, so there is nothing to reverse.
This wave count requires confirmation above 1,294.96. That would invalidate the first three weekly charts (the third is seen in historic analysis only).
It is possible that cycle wave b is continuing higher as a double zigzag. However, double zigzags normally have brief and shallow X waves. The purpose of the second zigzag in a double (and the third when there is one) is to deepen the correction when price does not move deep enough in the first (or second) zigzag. Thus double (and triple) zigzags normally have a strong and clear slope against the prior trend. To achieve this look their X waves normally are brief and shallow.
In this case, primary wave X is neither brief nor shallow. It is a 0.77 depth of primary wave W and lasted 0.74 the duration of primary wave W. Overall, this does not have a typical look of a double zigzag so far.
This wave count also must see the rise up to the high labelled intermediate wave (A) as a five wave impulse, not a three wave zigzag. This looks a little forced, so it reduces the probability of this wave count.
This wave count should only be used if confirmed with a new high above 1,294.96. Low probability does not mean no probability, but should always be given less weight until proven.
TECHNICAL ANALYSIS
WEEKLY CHART
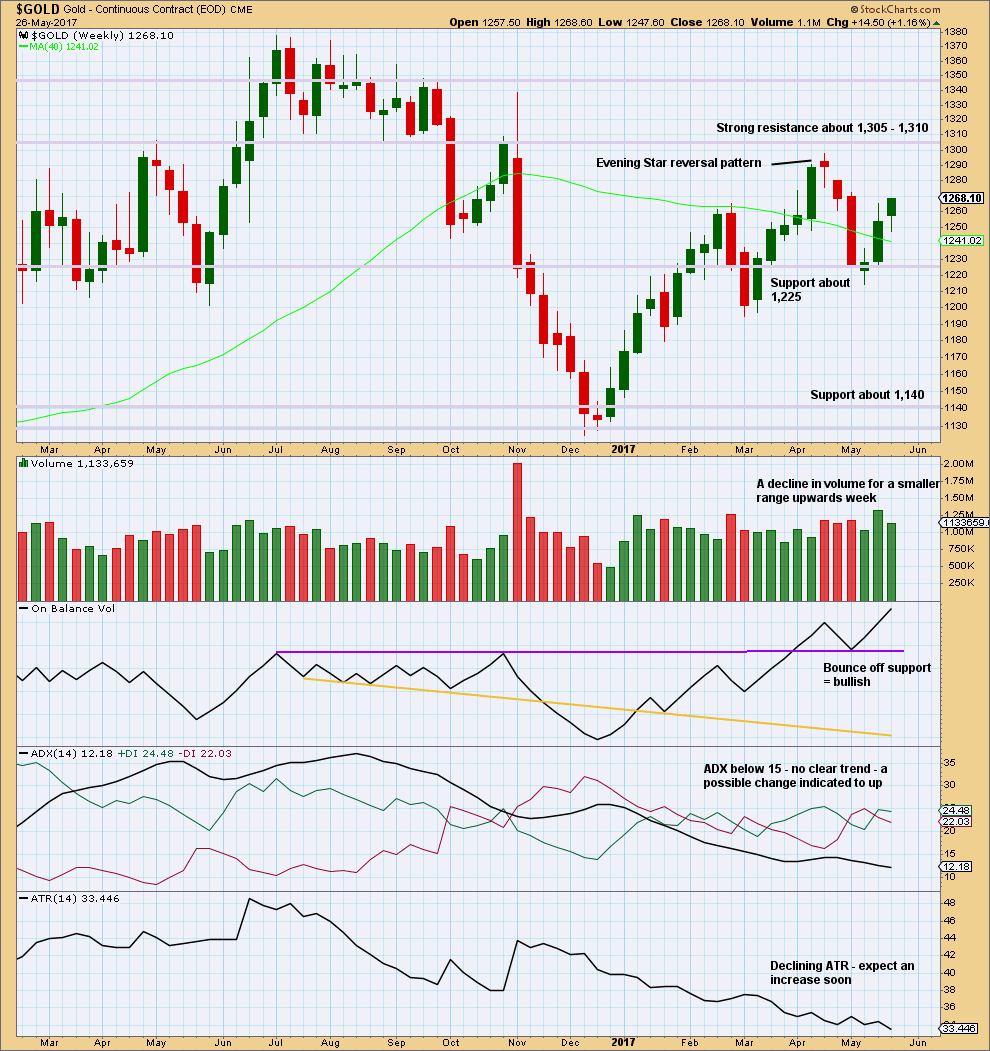
Click chart to enlarge. Chart courtesy of StockCharts.com.
The decline in volume is bearish, but it does not mean upwards movement must stop here. Price can continue higher on declining volume for another few weeks before a trend change as it did in February of this year.
On Balance Volume remains bullish. The long lower wick on this weekly candlestick is bullish.
ATR is bearish.
Overall, this chart is slightly bullish.
DAILY CHART
Click chart to enlarge. Chart courtesy of StockCharts.com.
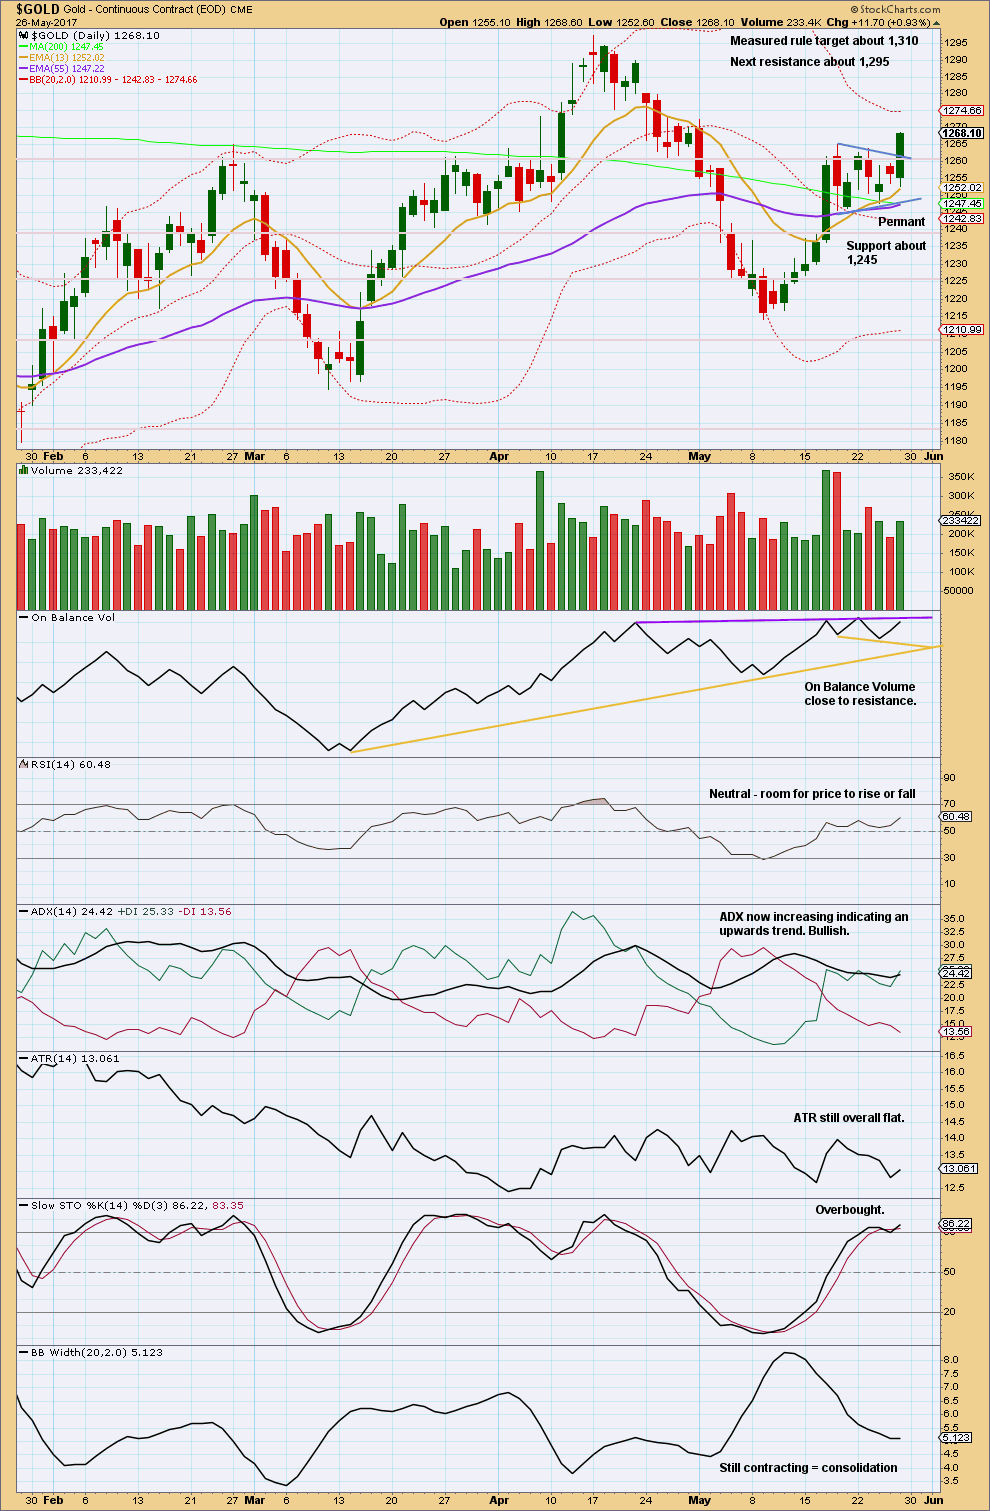
A strong upwards day comes with support from volume. Price has broken out of the pennant pattern upwards. The target calculated using the flagpole length of 50.7 and the breakout point about 1,260 remains at 1,310.
Volume is still lighter than recent downwards days though. Volume remains mid term bearish. The volume profile suggests the upwards breakout may be false or short lived.
On Balance Volume is at resistance. If it turns down on Monday, that will be a bearish signal. If it breaks above the purple resistance line on Monday, that would be a strong bullish signal. At that stage, some confidence in the target about 1,310 may be had.
Bollinger Bands normally expand with a trend and contract on a counter trend movement. Bollinger Bands still support the first two weekly Elliott wave counts which see this upwards movement as a B wave.
GDX
DAILY CHART
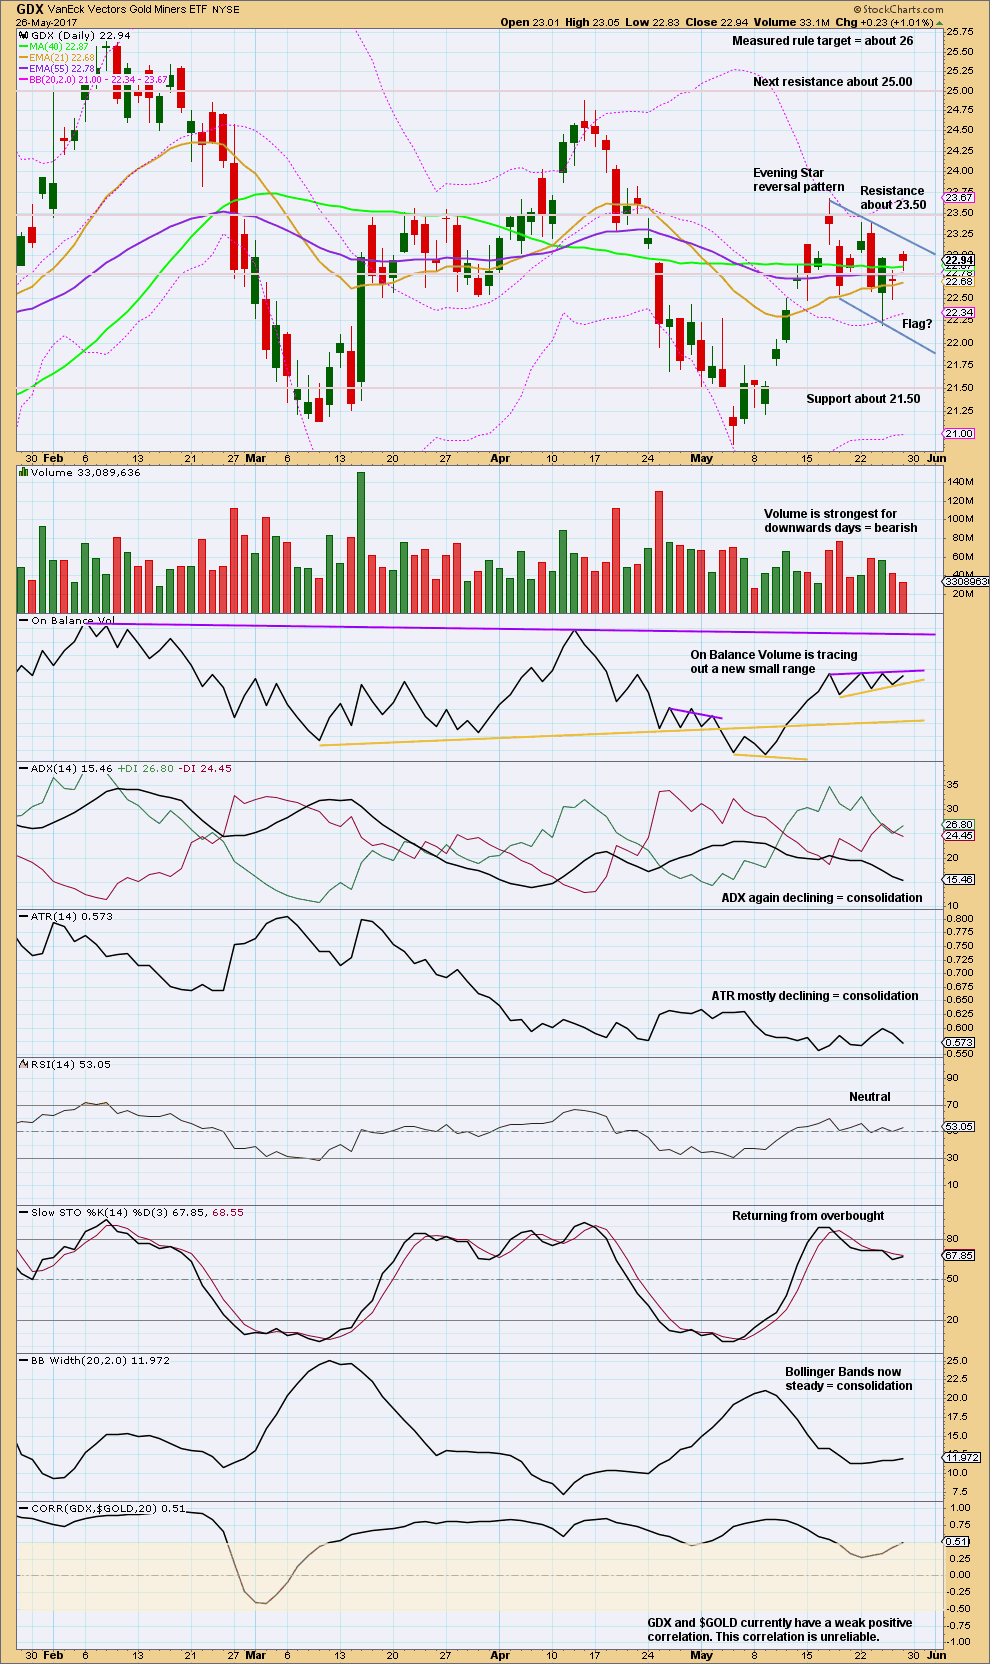
Click chart to enlarge. Chart courtesy of StockCharts.com.
Volume supports the flag pattern; as price moves essentially sideways volume declines.
Flags and pennants are reasonably reliable continuation patterns. This one expects an upward breakout. But volume remains heavier for recent downwards days indicating more support for downwards movement and a possible downwards breakout.
This analysis is published @ 09:55 p.m. EST on 27th May, 2017.
With sideways movement in a small range it looks like a small correction within an upwards trend, short term on the hourly chart.
The combination hourly chart looks the best today.
Minuette (iv) fits as an incomplete combination; zigzag – X – flat.
If minuette (iv) ends about the 0.236 Fibonacci ratio at 1,265 and minuette (v) is about equal in length with minuette (i), then minuette (v) may end about 1,277 which is very close to the target calculated at one degree higher 1,278.
So it looks like that target may now actually be reasonable.
A bullish candlestik chart pattern on daily gold.
A doji between two large green candles. The last candle high above the trading range. These three candle pattern is bullish short time.
Good day.
So many possibilities for GDX at this time. If gold can’t get past 1,285 this week and GDX stops at about 24.20, then this count may be a strong contender. It matches pretty good with the Gold idea I posted below.
https://www.tradingview.com/x/vZJy5a48/
Note:
US Memorial Day Holiday Schedule
All US markets will be closed on Monday, May 29th, for Memorial Day.
Canadian markets will be open.
US markets will resume normal operations on Tuesday morning.
End of Week Analysis
Data as at the close of May 26
=========================
Gold markets initially fell during the week, testing the 1250 level for support. Finding buyers in that area, prices have rebounded, shooting higher during the session on Friday, testing the 1268 level before pulling back toward the close of the trading session.
The Daily Ichimoku Chart shows gold continuing to trade around the top cloud boundary. Prices grind higher, but there was no real urgency, the tenkan-sen being still slightly below the kijun-sen although its gradient suggests that it is likely to crossover soon. A clean break above the cloud would instil confidence that the bull market has returned, but we are not there yet. Going forward, we should still see bullish pressure at least in early week. This is because price had finally crossed a critical threshold: the 1263-1265 stubborn resistance zone. So, the market looks likely to continue to try to grind higher, the near-term target being the peak in the green cloud near 1273 (in early June) before falling back to relieve some pressure. (Do note that Lara’s Hourly Triangle scenario suggests a top at Friday’s high, while the Hourly Flat and Combo recommend a rise toward a new slight high).
The lower cloud boundary at 1247.10 looks fairly strong support at the moment. I would expect that the gold price will next test this support. Investors are now divided into two distinct camps. The bears are still clinging on to the head-and-shoulders pattern which portends a steep drop to the 1130s; this pattern only aborts with a high above the “head” at 1297.40. The bulls find hope in the flag pennant, with a target in the 1300s.
Lara’s Hourly Triangle, Flat and Combo all have a bearish slant. All predict that gold price will drop to at least 1140, which implies that prices will close below the lower cloud boundary, the first indication of a bearish sign. The brown support line acts as the last defence for the still-hopeful bulls. Below that, bears come out dancing. The three scenarios will see to that. On the other hand, the count I suggested in Friday’s forum post is skewed toward the bullish case, and prognosticate that gold price will rebound off the bottom cloud boundary. Only time will tell which is the correct position. But, at the moment, my money is on the drop from the vicinity of 1278 toward the lower cloud boundary, a good shorting opportunity.
Thanks Alan for your above analysis. The sucker B wave! Imo (my 2c worth) Gold price is bullish, the trend is up, ADX is up and momentum is bullish. Although the US/UK markets would be closed on Monday, expecting 1265/60 range to hold for Gold price to put in an upside move for a take out of 1269 and reach for the upper band (1273-74) as per yours and possibly higher with an ATR of $12-$14. Imo sister Silver appears to be looking to top and pullback for Monday. That may just curtail Gold price rise? Lets see how this plays out. Tricky trade at this stage; seldom pays to go chasing price above the upper band. However, both Gold & Silver appear bottomy on weekly outlook basis; scalp shorts may be in play 1274-77+ but inclined to keep it long Gold on the drops. Too early to tell lol… 🙂
Lara, based on my trendline, I think we are still within striking distance of the Magee Bear Market trendline. I have a feeling that we at minimum get a proper test of that trendline before the Bear possibly resumes. Can you please add it back into your charts?
So we know that triangles are notoriously hard to nail down until sometimes the last minute….
Here’s another possible triangle variation for your consideration. This version would allow for a proper test of the all important Magee Bear Market trendline in the next month or two. From a timing perspective, I’m expecting Cycle wave b to end around mid July. This fits that scenario. Thoughts?
https://www.tradingview.com/x/Nh8QAfuC/
Oh yes, that looks good too!
I saw another variation of the triangle at the weekly chart level as I was recording the video too. Primary B could be moving lower as a double zigzag.
Crikey. There are just so many alternates possible at this time 🙁
Dreamer, this is an excellent concept. It yields a milder price rise, but it is closer to the high predicted by the flag pennant. I love it.
The higher price target in the 1450s requires investors to embrace a very bullish sentiment, most likely fuelled by a drastic event such as a stock market collapse or a full scale war with North Korea, both hardly forseeable at the present moment.
Thanks Alan, if gold stops at the downtrend line around 1,285 this week, then I think this count may gain in probability. I really think gold wants to test it’s Magee Bear Market trendline, which may be around 1,330 by the time it works it’s way there, in the coming weeks. What it does there will be key…