A small range inside day saw price move slowly sideways.
Summary: In the short term, a new low below 1,259.61 prior to a new high would add confidence in a trend change back to down. At that stage, the target would be 1,140 although this may be too low.
A new high tomorrow would indicate minor wave B is most likely incomplete.
New updates to this analysis are in bold.
Last historic analysis with monthly charts is here, video is here.
Grand SuperCycle analysis is here.
MAIN ELLIOTT WAVE COUNT
For clarity I have decided at this time it may be best to publish on a daily basis weekly charts I, II and IV. Both weekly charts I and II expect a zigzag down to complete and the difference is in the expected depth. Weekly chart IV has a very low probability and will only be given serious consideration if price makes a new high above 1,294.96.
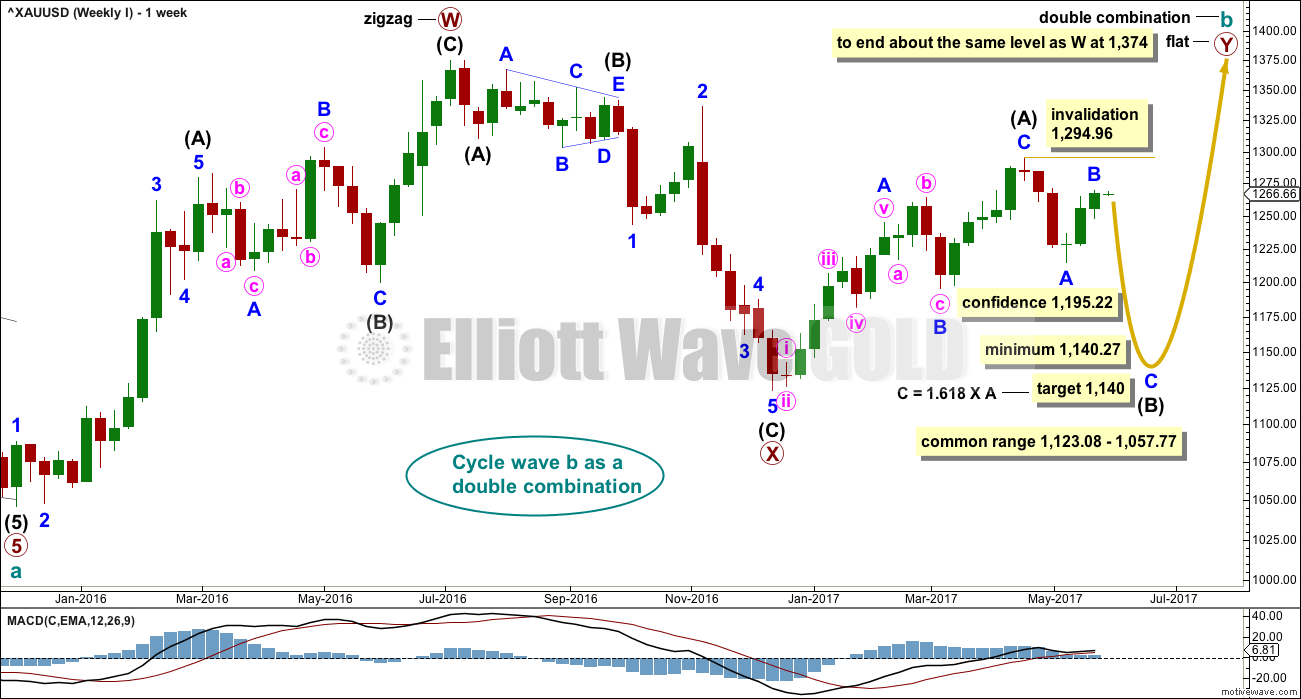
WEEKLY CHART I
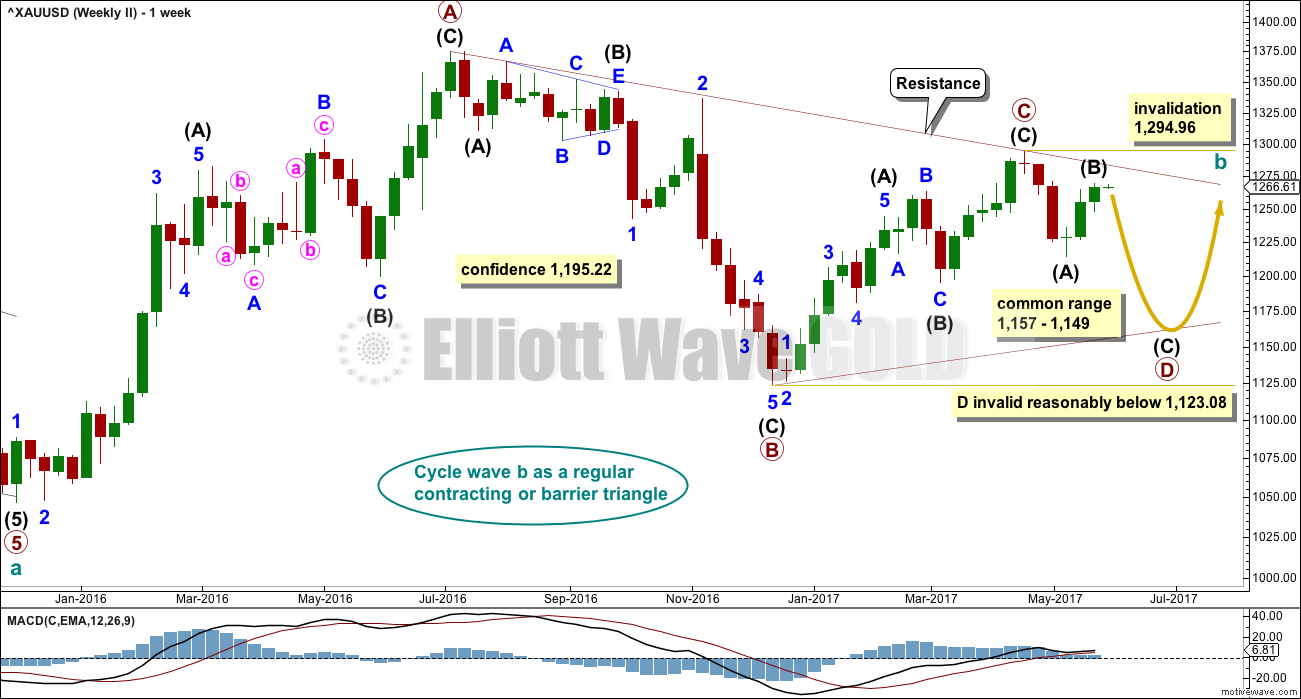
Combinations are very common structures. Cycle degree waves normally last one to several years, and B waves do tend to be more time consuming waves than all other waves. Given these tendencies the most likely scenario at this point may be that cycle wave b is an incomplete double combination.
The first structure in the double labelled primary wave W fits as a zigzag. This upwards movement will subdivide as either a three (zigzag) or a five (impulse). It does have a three wave look to it.
The double is joined by a deep three in the opposite direction labelled primary wave X, which is a 0.77 depth of primary wave W. X waves within double combinations are normally very deep; this one looks right.
The second structure in the combination may be either a triangle or a flat correction. Both of these structures have A waves which subdivide as threes.
At this stage, the upwards wave from the low in December 2016 does now look best and subdivide best as a completed zigzag. This may be intermediate wave (A) of a flat correction or a triangle. Because a triangle for primary wave Y would look essentially the same as the second weekly chart below, only a flat correction is considered here. The most common two structures in a double combination are a zigzag and a flat.
This wave count follows the most common scenario and has the best fit.
Within the flat correction of primary wave Y, intermediate wave (B) must retrace a minimum 0.9 length of intermediate wave (A) at 1,140.27. The most common length for intermediate wave (B) is from 1 to 1.38 times the length of intermediate wave (A), giving a common range from 1,123.08 to 1,057.77.
A target is now calculated for minor wave C to complete intermediate wave (B). This target would meet the minimum requirement for intermediate wave (B). If minor wave B moves any higher, then this target must be recalculated.
Intermediate wave (B) may subdivide as any corrective structure, but the most common structure for B waves within flats is a zigzag. At this stage, on the hourly chart it looks like a five down labelled minor wave A is complete, which would indicate intermediate wave (B) is a zigzag subdividing 5-3-5.
The daily and hourly charts will follow this weekly chart. That does not mean the other three weekly charts aren’t possible, they are, but the number of charts must be kept reasonable on a daily basis.
WEEKLY CHART II
What if cycle wave b is a triangle? This is also entirely possible. Triangles are not as common as double combinations, but they are not uncommon.
Within the triangle, primary waves A, B and C are all single zigzags. One of the five subwaves of a triangle normally subdivides as a more complicated multiple, usually a double zigzag. This may be what is unfolding for primary wave D. It may also subdivide as a single zigzag.
Primary wave D of a regular contracting triangle may not move beyond the end of primary wave B below 1,123.08.
Primary wave D of a regular barrier triangle should end about the same level as primary wave B at 1,123.08, so that the B-D trend line is essentially flat. What this means in practice is that primary wave D may end slightly below 1,123.08 and the triangle would remain valid. This is the only Elliott wave rule which is not black and white.
Thereafter, primary wave E should unfold upwards and would most likely fall a little short of the A-C trend line. If not ending there, it may overshoot the A-C trend line. Primary wave E may not move beyond the end of primary wave C above 1,294.96.
Triangles normally adhere very well to their trend lines. Occasionally, price may overshoot the trend lines but when this happens it is not by much and is quickly reversed. The upper A-C trend line should offer very strong resistance at this stage if cycle wave b is unfolding as a triangle. This trend line is added to the daily chart below.
At this stage, the structure on the hourly chart is still the same for both this weekly wave count and the first weekly wave count: a zigzag downwards is unfolding. However, they now diverge in how far down the next wave is expected to go. This second weekly wave count expects a more shallow movement to not end reasonably below 1,123.08.
DAILY CHART
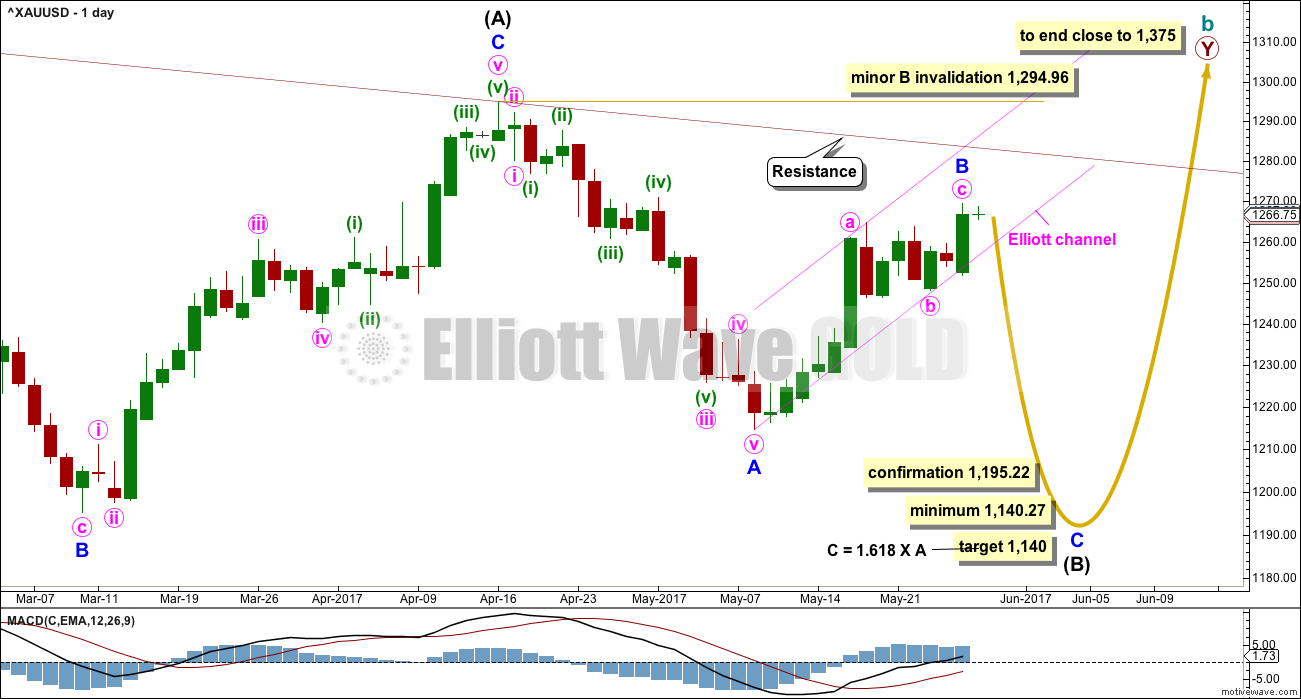
This daily chart will suffice for both weekly charts above, although the labelling follows weekly chart I.
Both weekly charts expect a zigzag downwards. (It may also turn out to be a double zigzag. For now a single only will be charted but a double will be kept in mind). Weekly chart I expects a deep zigzag for intermediate wave (B) to a minimum at 1,140.27. Weekly chart II expects a zigzag down for primary wave D to not move below 1,123.08 and most likely fall well short of that point.
The daily chart follows the expectations for weekly chart I, but the structure for weekly chart II would be exactly the same at this stage.
Within the flat correction of primary wave Y, intermediate wave (B) must retrace a minimum 0.9 length of intermediate wave (A) at 1,140.27. The most likely corrective structures to achieve the deep correction required for B waves within flats are single or multiple zigzags. These begin with a five, then a three in the opposite direction.
Minor wave A is complete. Minor wave B may now be a complete zigzag.
There are still three hourly wave counts for minor wave B below. They are presented in order of probability. The order has changed slightly from last analysis.
Minor wave B may not move beyond the start of minor wave A above 1,294.96.
HOURLY CHART – COMBINATION
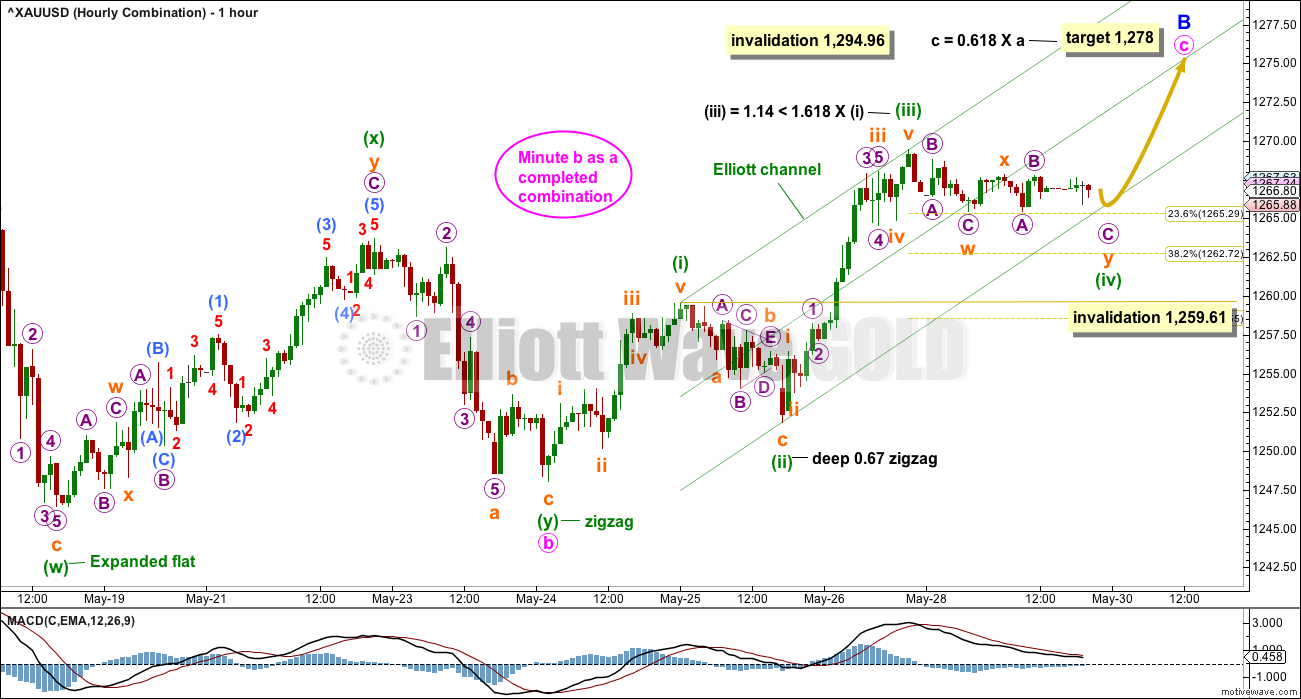
Minute wave b may be a complete double combination. These are very common structures. The most common combination of corrective structures in a double is a zigzag and a flat.
Minuette wave (w) fits as an expanded flat. Minuette wave (y) fits now as a completed zigzag.
The structure for minute wave b is a big sideways movement. This looks typical for a double combination.
Within combinations, X waves may be any corrective structure including multiples. However, they are most commonly single zigzags. For this wave count, the multiple zigzag for minuette wave (x) reduces its probability. However, sideways movement for Monday’s quiet session looks like a small fourth wave which fits this wave count well.
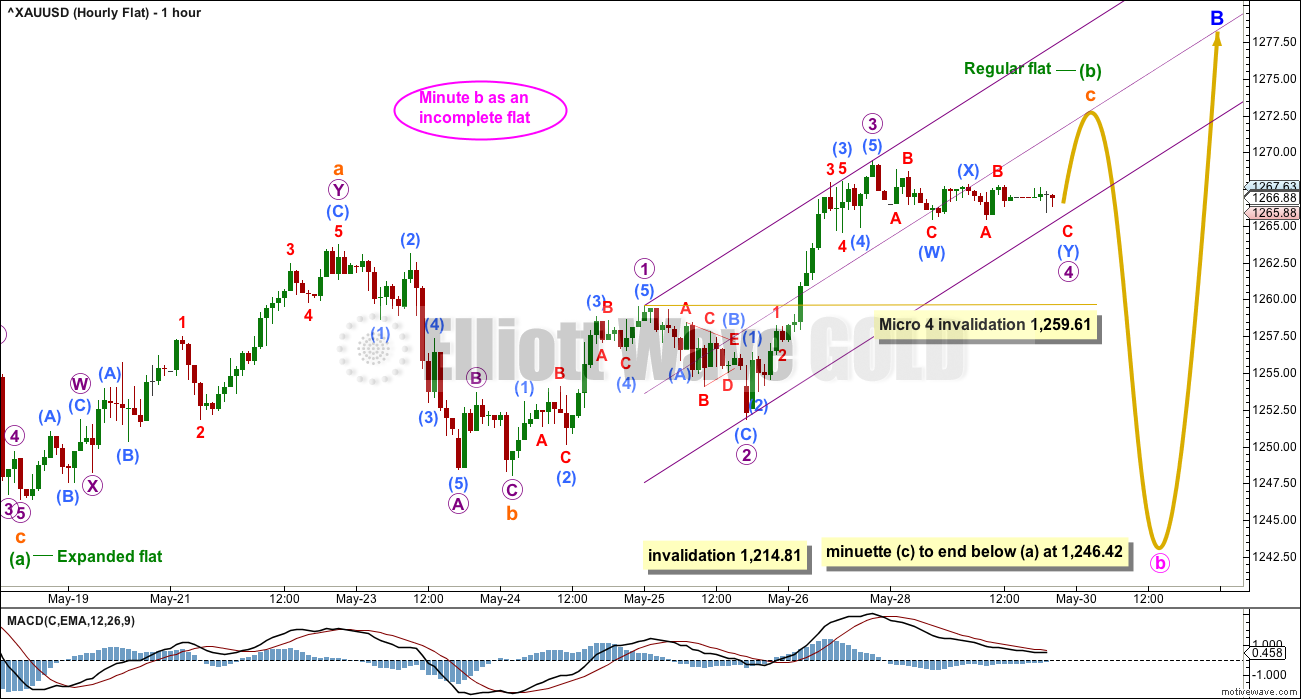
Minute wave c must subdivide as a five wave motive structure, either an impulse or an ending diagonal. So far it looks very much like it would be an impulse. The structure is incomplete. The fourth wave of minuette wave (iv) may be an almost complete double combination, then a final short fifth wave up would be required to complete the structure.
Minuette wave (iv) may not move into minuette wave (i) price territory below 1,259.61.
If minuette wave (iv) ends close to the 0.236 Fibonacci ratio of minuette wave (iii) at 1,265, then minuette wave (v) would reach equality in length about 1,277. This is very close to the target calculated one degree higher. The target looks to have a reasonable probability.
HOURLY CHART – TRIANGLE
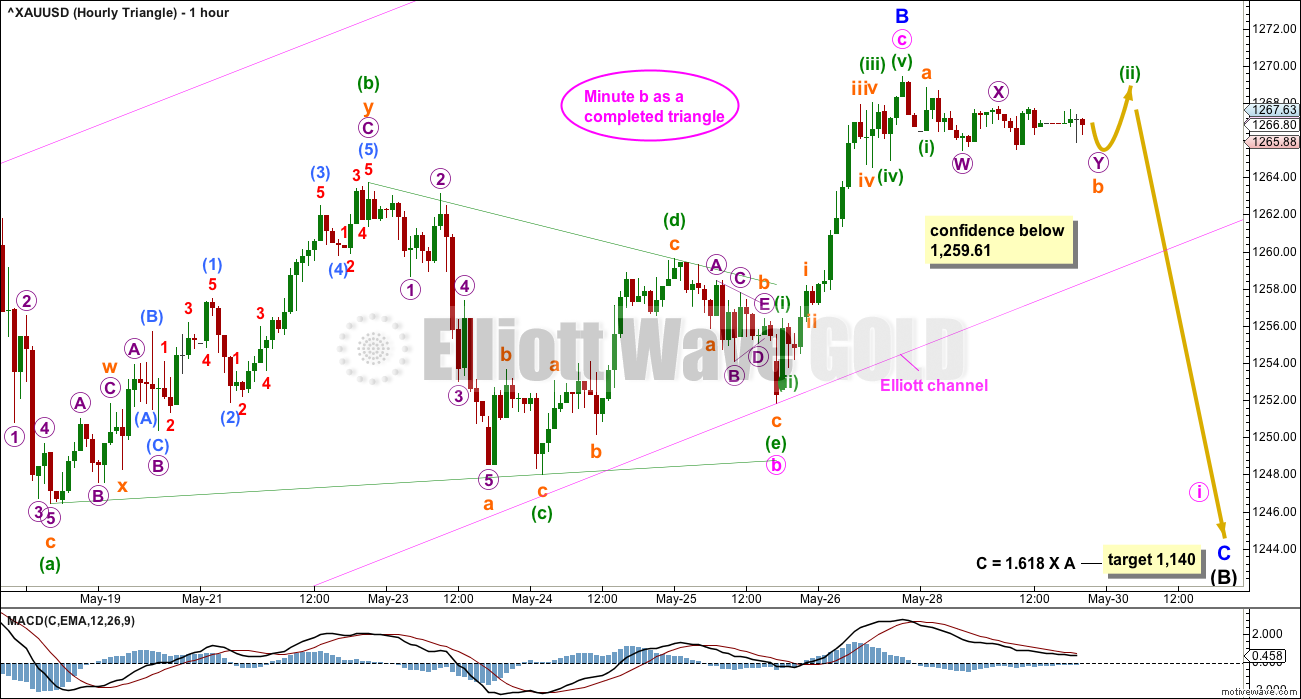
In the short term, a new low below 1,259.61 (prior to a new high) would invalidate the other two hourly charts and provide some confidence in this triangle wave count.
Thereafter, a breach of the lower edge of the pink Elliott channel by downwards (not sideways) movement would provide further confidence in this triangle wave count.
If minor wave B is a complete zigzag, then within it minute wave c is just 0.77 short of 0.382 the length of minute wave a.
Gold does often exhibit remarkably short and brief fifth waves out of its fourth wave triangles. It can sometimes also exhibit this tendency for its C waves out of B wave triangles.
HOURLY CHART – FLAT
When a triangle is considered, it is vital that other options are considered also. Too often I have seen what looks like a triangle to be unfolding, or even completed, only to then see price make an unexpected movement and invalidate the triangle.
What if a flat correction is still unfolding for minute wave b and minuette wave (b) within it is still incomplete?
Within a flat correction, both of waves A and B must subdivide as threes. Here, minuette wave (a) is an expanded flat and this is classified as a three. Minuette wave (b) may be an incomplete regular flat, also classified as a three.
Within the regular flat of minuette wave (b), subminuette wave c has now moved above the end of subminuette wave a at 1,263.71 avoiding a truncation. The structure of subminuette wave c is incomplete. It must complete as a five wave motive structure, so it needs to complete micro waves 4 and 5.
Micro wave 4 may not move into micro wave 1 price territory below 1,259.61.
Thereafter, minuette wave (c) would be extremely likely to move at least slightly below the end of minuette wave (a) at 1,246.42 to avoid a truncation.
This wave count allows for further sideways movement in an ever increasing range.
This wave count does not have as good a look as the combination or triangle wave counts. Here, minuette wave (b) is technically a regular flat, but they more commonly have C waves that are about even in length with their A waves and end only a little beyond the end of the A wave. Here, subminuette wave c is already reasonably beyond the end of subminuette wave a, but the structure is incomplete and needs to continue higher.
WEEKLY CHART IV
What if the bull market beginning in December 2015 remains intact? Price has essentially been moving sideways since that date, so all possibilities should be considered.
The Morning Doji Star at the low labelled intermediate wave (B) will not be considered as a reversal pattern here because it comes in what is essentially a sideways movement. It does not come after a downwards wave, so there is nothing to reverse.
This wave count requires confirmation above 1,294.96. That would invalidate the first three weekly charts (the third is seen in historic analysis only).
It is possible that cycle wave b is continuing higher as a double zigzag. However, double zigzags normally have brief and shallow X waves. The purpose of the second zigzag in a double (and the third when there is one) is to deepen the correction when price does not move deep enough in the first (or second) zigzag. Thus double (and triple) zigzags normally have a strong and clear slope against the prior trend. To achieve this look their X waves normally are brief and shallow.
In this case, primary wave X is neither brief nor shallow. It is a 0.77 depth of primary wave W and lasted 0.74 the duration of primary wave W. Overall, this does not have a typical look of a double zigzag so far.
This wave count also must see the rise up to the high labelled intermediate wave (A) as a five wave impulse, not a three wave zigzag. This looks a little forced, so it reduces the probability of this wave count.
This wave count should only be used if confirmed with a new high above 1,294.96. Low probability does not mean no probability, but should always be given less weight until proven.
TECHNICAL ANALYSIS
WEEKLY CHART
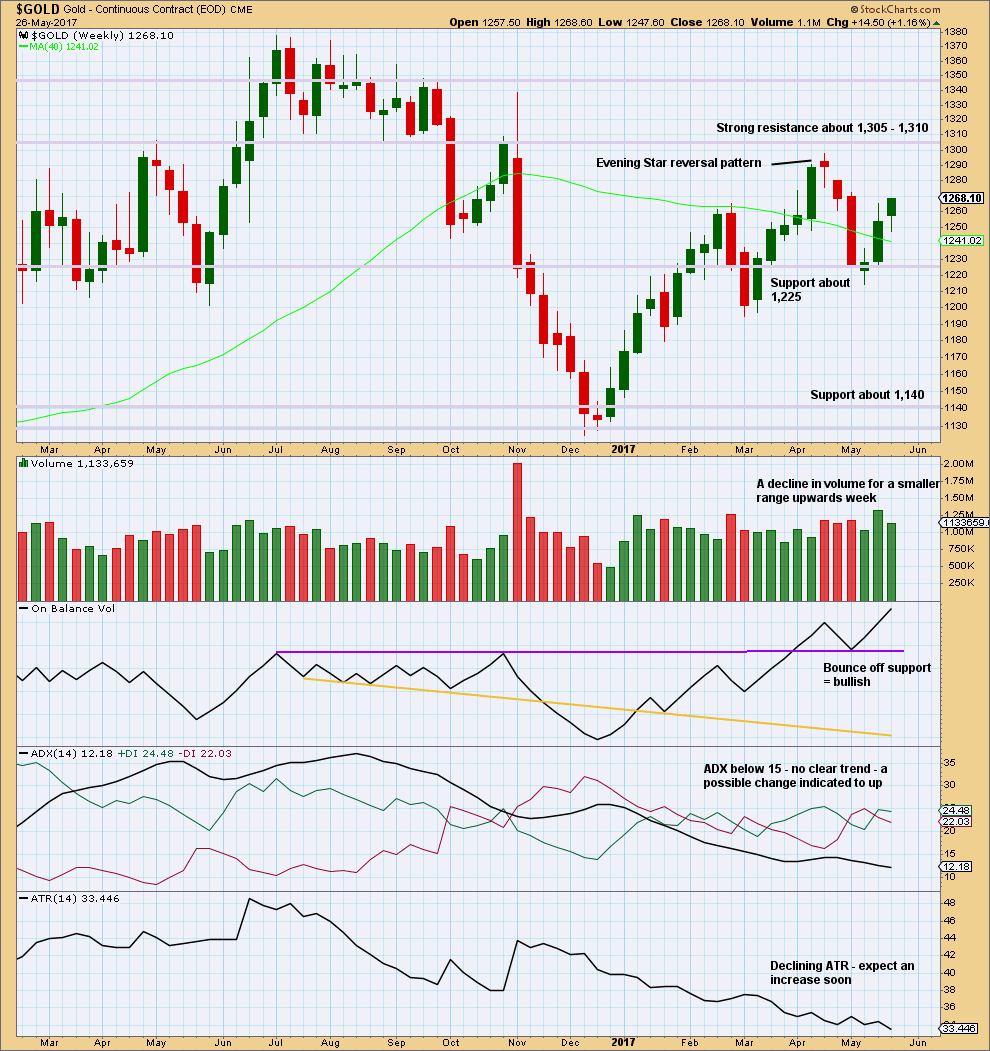
Click chart to enlarge. Chart courtesy of StockCharts.com.
The decline in volume is bearish, but it does not mean upwards movement must stop here. Price can continue higher on declining volume for another few weeks before a trend change as it did in February of this year.
On Balance Volume remains bullish. The long lower wick on this weekly candlestick is bullish.
ATR is bearish.
Overall, this chart is slightly bullish.
DAILY CHART
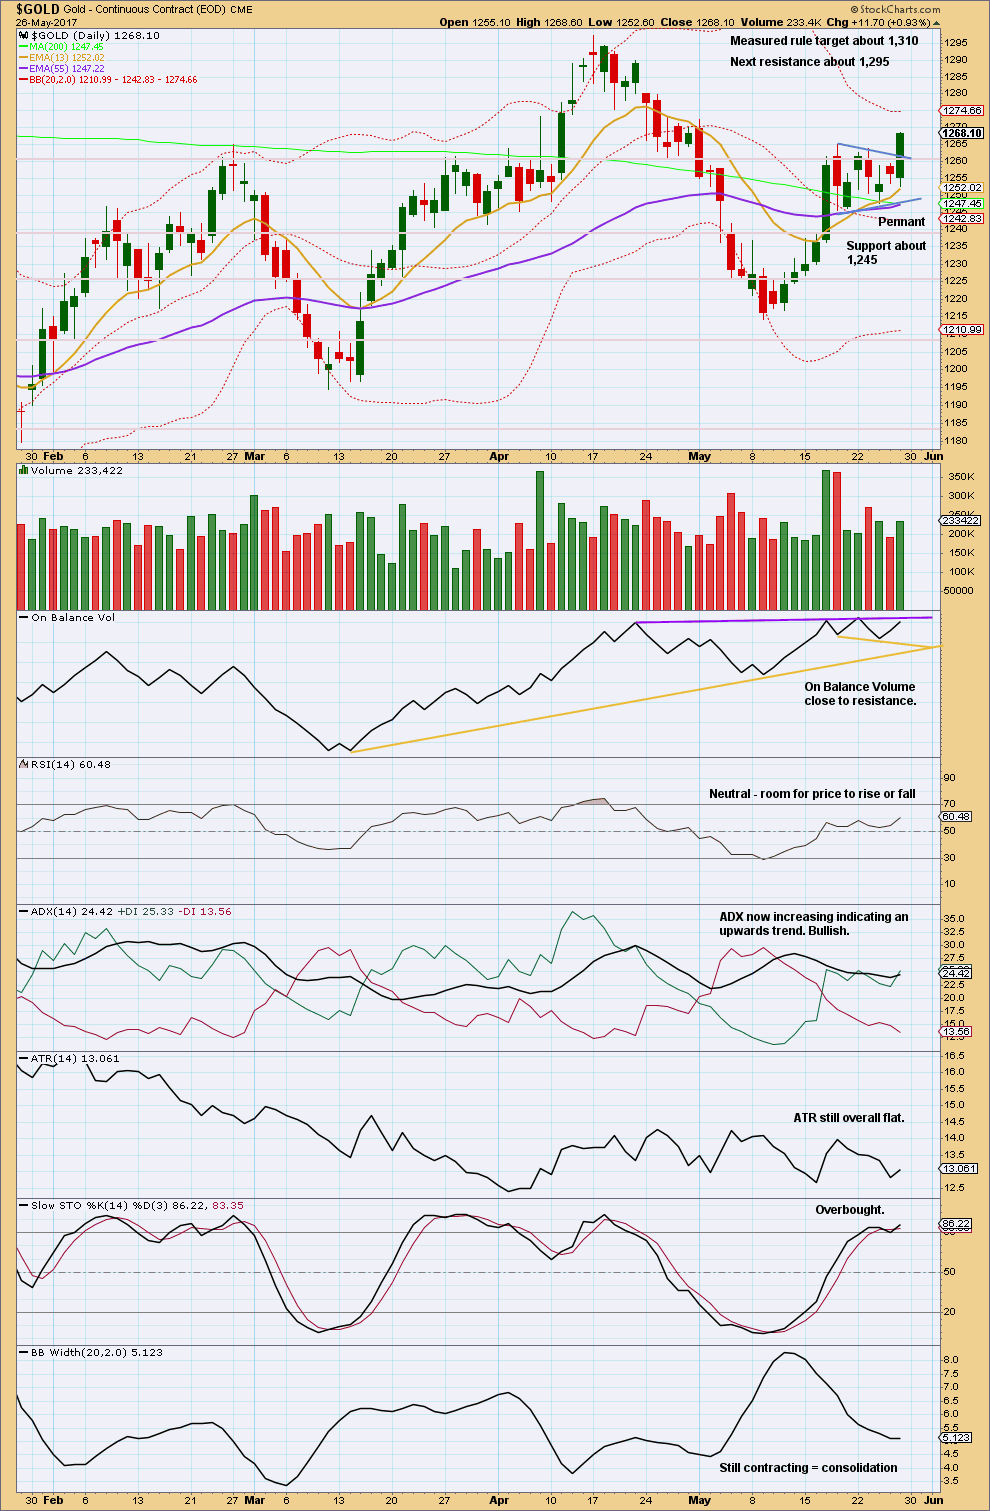
Click chart to enlarge. Chart courtesy of StockCharts.com.
StockCharts data is NY session only. No new data is available for Monday as NYSE was closed for Memorial Day. The classic analysis is unchanged.
A strong upwards day comes with support from volume. Price has broken out of the pennant pattern upwards. The target calculated using the flagpole length of 50.7 and the breakout point about 1,260 remains at 1,310.
Volume is still lighter than recent downwards days though. Volume remains mid term bearish. The volume profile suggests the upwards breakout may be false or short lived.
On Balance Volume is at resistance. If it turns down on Monday, that will be a bearish signal. If it breaks above the purple resistance line on Monday, that would be a strong bullish signal. At that stage, some confidence in the target about 1,310 may be had.
Bollinger Bands normally expand with a trend and contract on a counter trend movement. Bollinger Bands still support the first two weekly Elliott wave counts which see this upwards movement as a B wave.
GDX
DAILY CHART
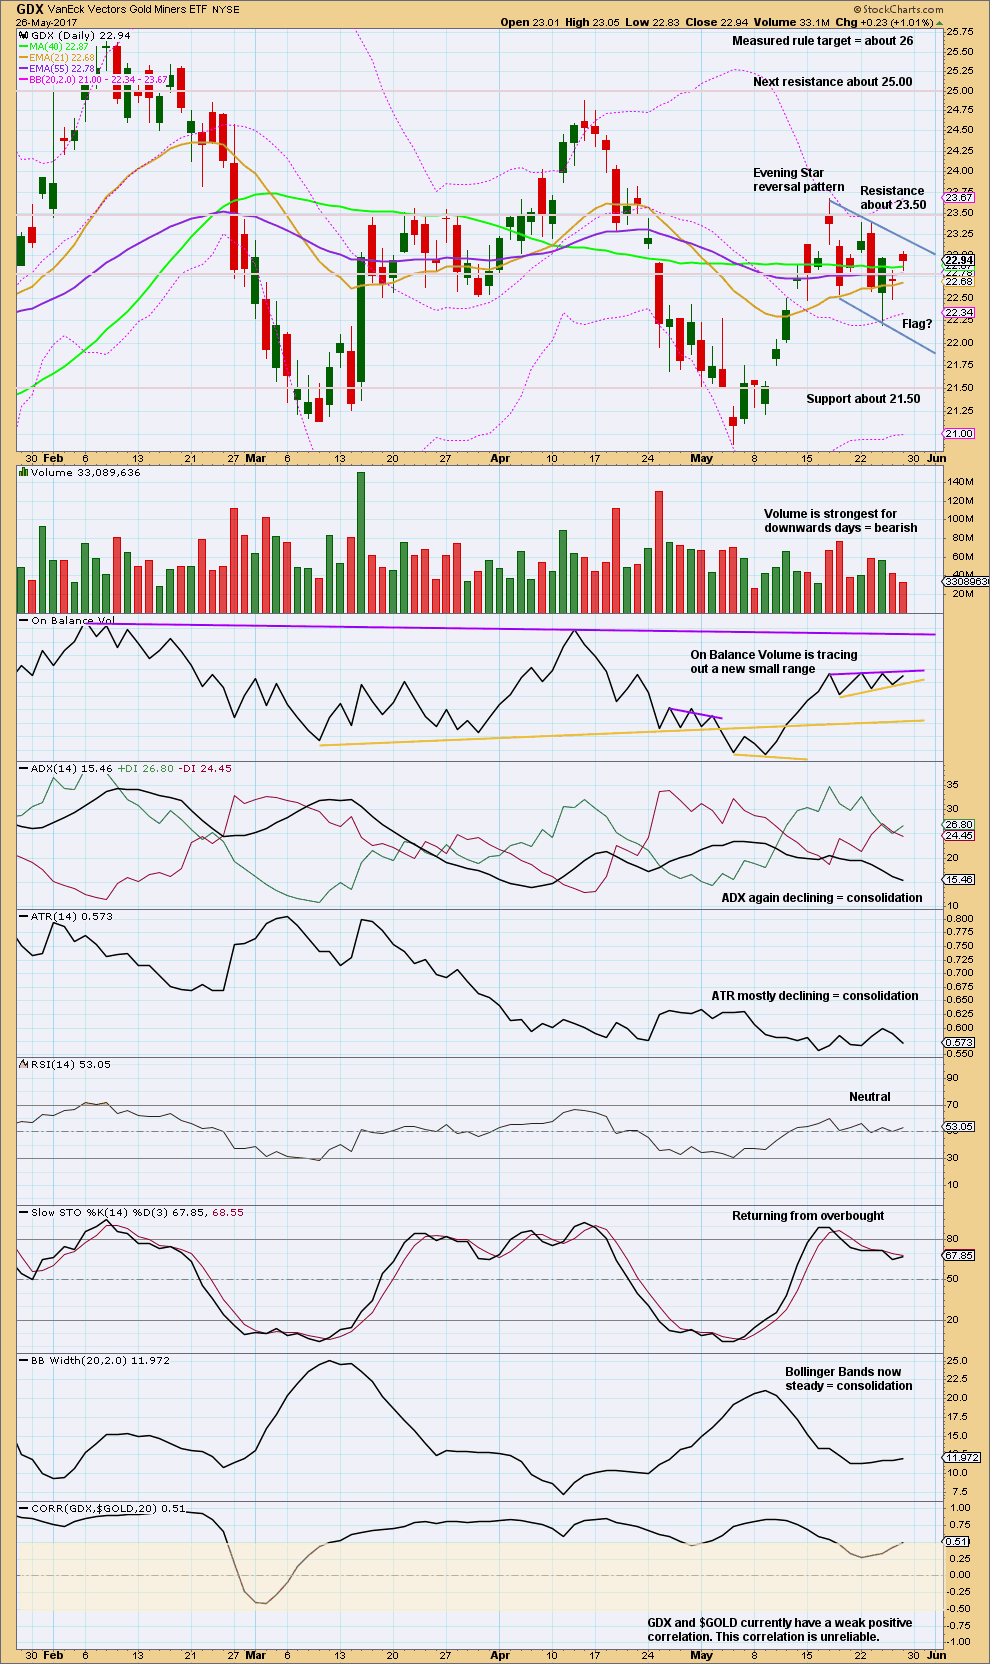
Click chart to enlarge. Chart courtesy of StockCharts.com.
Volume supports the flag pattern; as price moves essentially sideways volume declines.
Flags and pennants are reasonably reliable continuation patterns. This one expects an upward breakout. But volume remains heavier for recent downwards days indicating more support for downwards movement and a possible downwards breakout.
This analysis is published @ 09:55 p.m. EST.


Lara, could this small move down just be a 2nd wave pullback for the move up out of the hourly triangle count? I know that sometimes the moves out of a triangle are short and brief, but isn’t it possible that the move up is not over?
This is going to be labelled the main wave count today at the hourly chart level.
BUT it comes with the very strong caveat that we should not have confidence in it while price remains within the pink Elliott channel. We need to see that channel breached before we can have reasonable confidence in a trend change.
A channel breach won’t invalidate the alternate below, it will still remain valid, and it will still illustrate the risk to short positions.
This wave count has a better look.
Draw the channel carefully from the start of minor B, to the end of minute b within it, then place a parallel copy on the end of minute a. Do this on the hourly chart on an arithmetic scale.
Right now price is sitting right at the lower edge.
Gold made a slight new high and has remained above the invalidation point for the fourth waves on the hourly chart.
However, the little fourth wave looks complete, and the fifth wave although much shorter than expected has a perfect Fibonacci ratio to the first of 0.382.
The five up now looks very good and complete. Perfect alternation, excellent to perfect Fibonacci ratios.
This is my less preferred scenario. It will today be labelled an alternate. This wave count represents the risk to entering short now.
Direction of nominal price of gold/silverwill depend on which way GSR will break from the down slopping wedge in 2 hour period.
Hourly combo wave count is invalidated.
https://www.tradingview.com/x/Lt8XMKPK/
Papudi. Regretfully, Hourly Combination is not invalidated yet. Price low was 1259.84. Lara requires 1259.61. I was hoping for it to go. As is also the triangle. The idea of a drop immediately to 1140 irks me. I’m still clamouring for a rise toward the 1280s. Price has hugged the lower cloud boundary at the 1-hour level but there was no breach and so the drop scenario is not activated yet. Close, but no cigar.
On PmBull Gold low is 1259.383. Again data feed can be blamed again.
Ichimoku Gold Update
Data as at 5:55 am ET May 30
========================
Gold price has risen to a new high at 1270.32 (above the last high at 1269.45), and subsequently fell as low as 1262.60. With price dropping below both the tenkan-sen and the kijun-sen, the question looms whether 1270.32 is all there is to the push higher before a pullback. Please refer to my last analysis; I had considered the peak of the daily green cloud at 1273 to be the target. Price could now be dropping to test the lower cloud support at the daily level at 1247.10.
The critical point to watch is now the 1-hour cloud bottom at 1261.22. If price drops below that, heading toward 1247.10 is a given. But, if price finds support at 1261.22, then I would expect a slow grind today toward 1280 – 1290 maximum before the downturn. Gold currently lacks upside momentum, signifying that a major breakout is not yet in the cards. I would expect gold to be rejected at 1280 – 1290, where the 78.6% Fibonacci retracement resides.
From an EW perspective, a rebound off the cloud bottom at 1261.22 is in line with the Hourly Combo and the Hourly Flat. It means that the 4th wave is an expanded flat, and the drop toward 1261.22 is respectively minuette 4 and micro 4. The 5th wave will then target 1273 or maybe 1278-1280.
The same outlook matches my version of Weekly IV in which the target represents Minute 1, to be followed by a drop to test and to rebound off the daily cloud bottom at 1247.10, or maybe the strong support at 1243.
A drop past 1261.22 is expected for the Hourly Triangle.
Thanks Alan for your views.
This is an excellent example of combining Lara’s count and TA.
Thats’ what i do with PM sector PM indicators. I line them with Lara’s wave count.
Thanks to all Dreamer/Verne/Sayed and others.
Nice. Bottom should be in if we are going higher. I’m thinking we top at the downtrend line around 1,280-85. Thanks for you continued analysis! 😎
My pleasure. I like to call it as I see it. If it can help some others in their trading, I’ll be most delighted. But of course I may be wrong. Nothing in trading is ever cast in stone. It’s all a probability exercise. Sometimes we choose the percentage play and we win. Sometimes, the anti-percentage play comes along and spooks everybody out. That’s why we buy insurance: stops and position sizing.
Essential checks and balances for all gold bulls.
http://allstarcharts.com/will-time-buy-gold/
His underlying assumption is that price will not breach the long-term downtrend bull-bear line. I’m sure he’ll sing a different tune if it does. Analysts are like that. There are permabulls and there are permabears. I’ve long ago forsaken them. They just lay down one scenario, and boost their case with a smattering of indicators. Anyone can conjure up a different set of indicators to paint a grossly different picture. Indicators are just that: they indicate, they do not forecast.
The best course of action for us humble traders to take is to focus on the picture right in front of us. That’s what Lara does, and that’s what endears her to us. Sensational bull or bear rhetoric may win these analysts readership, but do they translate to money in the bank?
Alan
He is neither a permabear nor a permabull. He makes that point in the first paragraph. Yes his style is flamboyant but I don’t think you can ascribe the word ‘sensational’ to the analysis.
There is no glaring conflict between his conclusions and those of Lara’s more bearish ideas. Basically he sees B’s within B’s using a different prism and that is what he says to run away from. Lara might say the same if she was addressing novice traders.
He could well be wrong and I hope he is. The point of posting is to test our conviction and be the ‘devil’s advocate’.