
Price moved slightly lower, which was not what the main wave count expected, but it was allowed for. No confirmation of a trend change has yet been seen.
Summary: The upwards trend should resume here or very soon. Confidence may be had in this expectation if price makes a new high above 1,268.38 and breaks above the best fit channel on the hourly chart. The target for now is about 1,392.
Price should find very strong support at the lower edge of the base channel if price does move lower, which would be about 1,244 now for tomorrow’s session.
New updates to this analysis are in bold.
Grand SuperCycle analysis is here.
Last monthly and weekly charts are here.
MAIN ELLIOTT WAVE COUNT
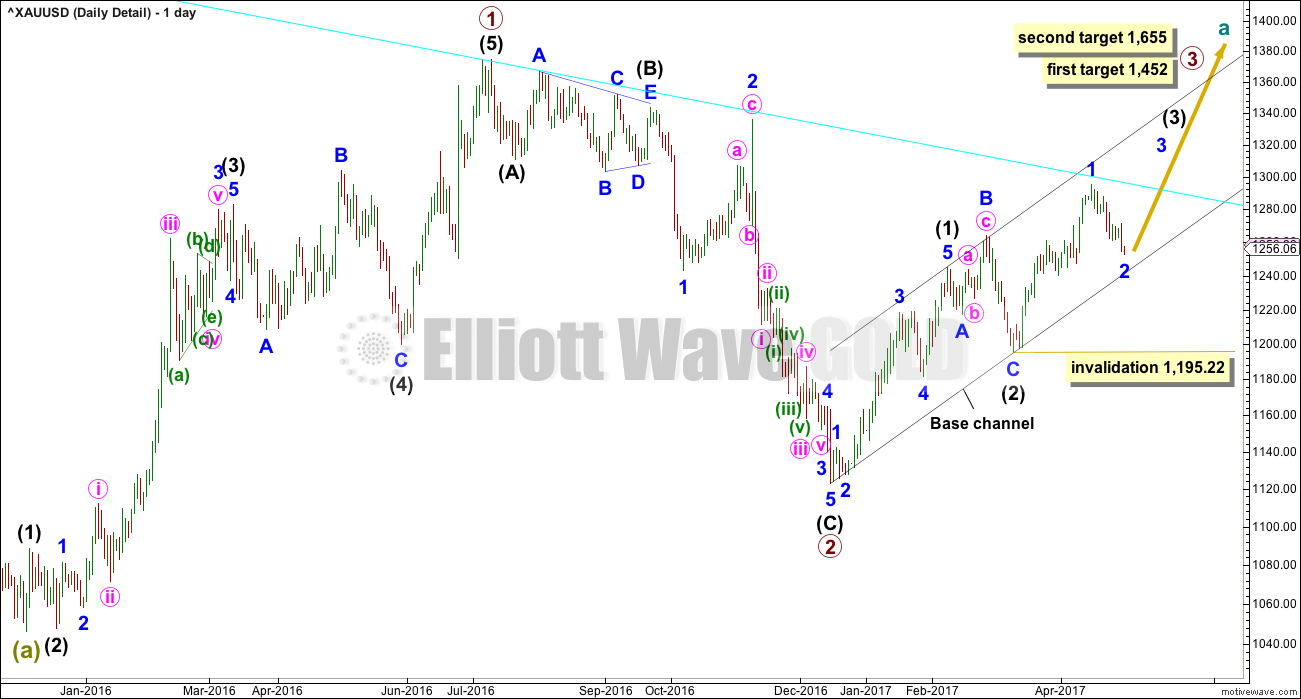
DAILY CHART – DETAIL
Click chart to enlarge.
This chart steps back to see all movement since the important low on the 3rd of December, 2015.
To see how this fits into the bigger picture, please see the last historic analysis linked to at the start of this analysis.
The first upwards movement labelled primary wave 1 fits well as a five wave impulse. Primary wave 2 fits as a zigzag. It would be difficult to see the downwards wave of primary wave 2 as an impulse because that would require ignoring what looks very much like a triangle at its start (labelled intermediate wave (B) ). To see this as an impulse that movement would need to be a second wave correction, but second waves do not subdivide as triangles.
Primary wave 3 should have begun. Within it intermediate waves (1) and (2) should be complete. Intermediate wave (2) is a very common expanded flat correction.
The middle of this big third wave looks unlikely to have passed, so it is still ahead.
A cyan trend line is added to all charts. Draw it from the high in October 2012 to the high in July 2016. This line has been tested five times. Price is finding resistance at the cyan trend line now. If price can break through resistance here after some consolidation, then that may release energy to the upside for the end of minor wave 3.
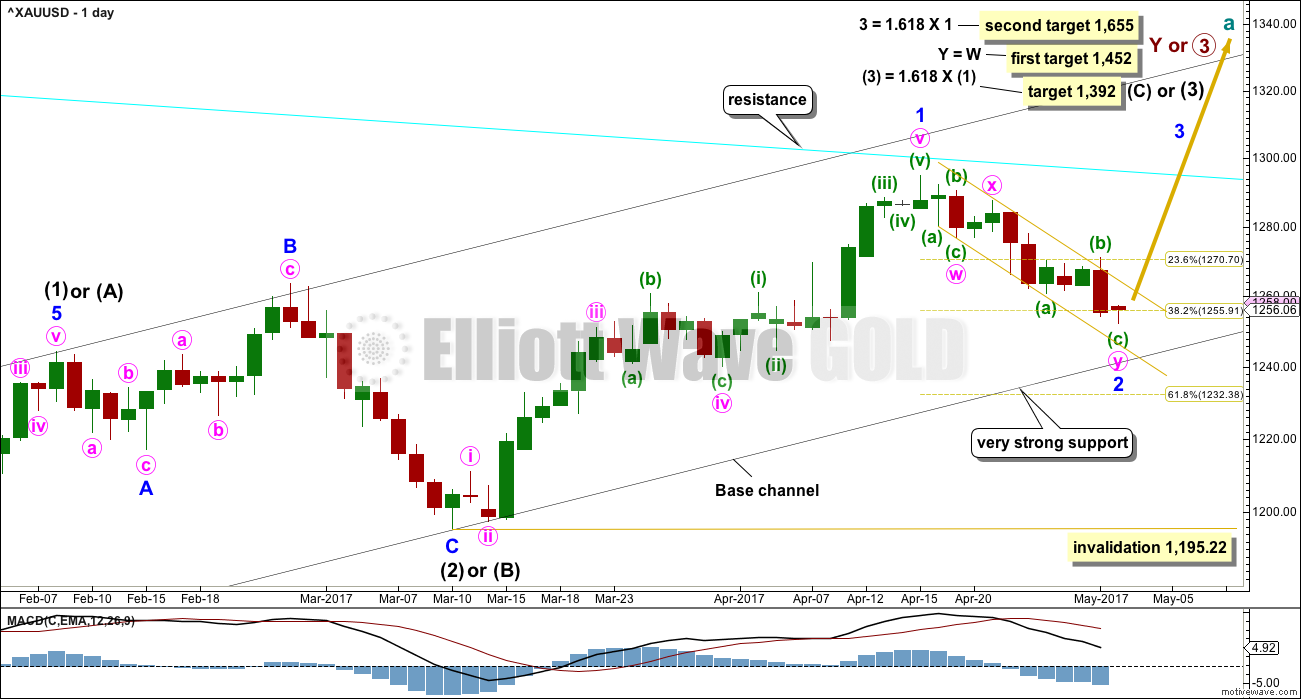
DAILY CHART
Click chart to enlarge.
This daily chart will suffice for both weekly charts, which can be seen in the last published historic analysis.
Upwards movement at primary degree is either a third wave (first weekly chart) to unfold as an impulse, or a Y wave (second weekly chart) to unfold as a zigzag. If upwards movement is a zigzag for primary wave Y, then it would be labelled intermediate waves (A) – (B) and now (C) to unfold. It is most likely a third wave because cycle wave a is most likely to subdivide as an impulse.
Intermediate wave (1) or (A) is a complete five wave impulse lasting 39 days. Intermediate wave (2) or (B) looks like an expanded flat, which is a very common structure.
It is possible that minor wave 1 is over at the recent high and now minor wave 2 may be unfolding lower. If it gets down to the lower edge of the base channel, it should find very strong support there. If this wave count is correct, then price should not break below this trend line.
If the pullback does continue, then price may come down to touch the lower edge of the base channel. If that happens, it would offer us a gift of a very good entry point to join the upwards trend. If that happens, then members would be strongly advised to enter long with a stop just below the lower edge of the channel (give the market a little room to move and allow for overshoots).
Minor wave 2 may not move beyond the start of minor wave 1 below 1,195.22. However, if the base channel provides support, price should not get close to this invalidation point. Only if the base channel is breached by a full daily candlestick below and not touching the lower edge would a bearish wave count be considered.
The gold best fit channel about minor wave 2 is shown on the daily chart today, so that members may see how it is drawn.
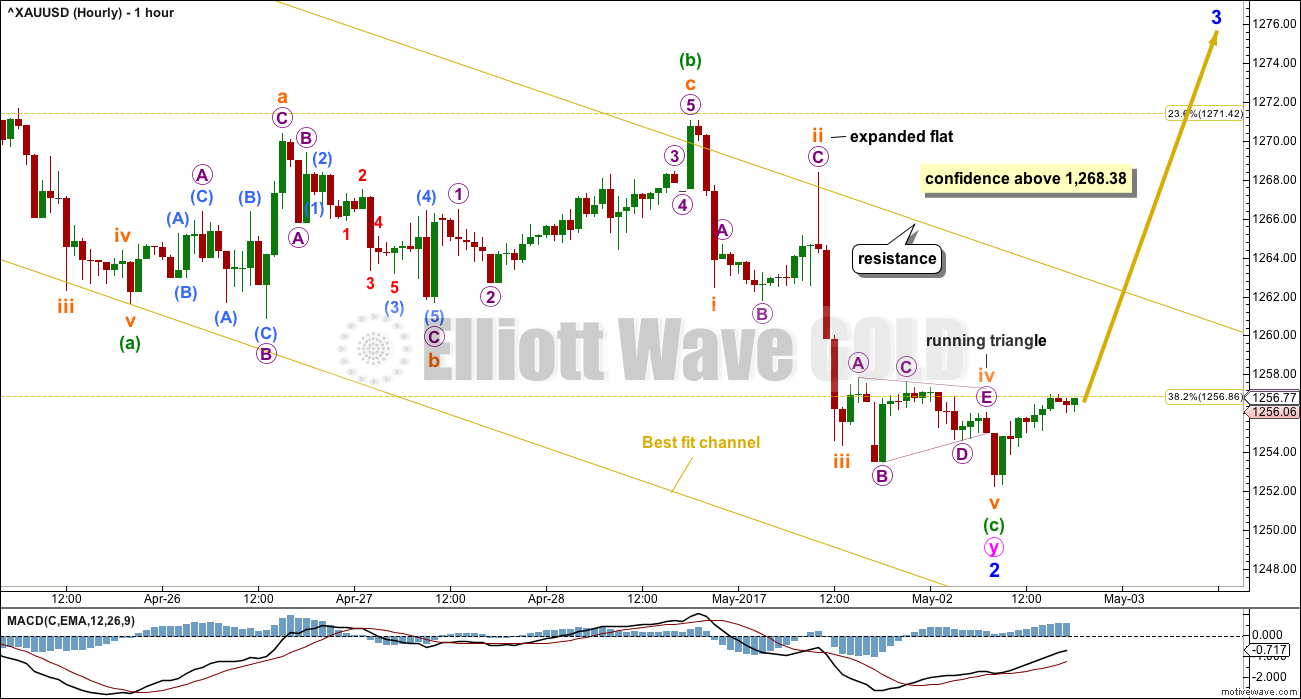
HOURLY CHART
Click chart to enlarge.
Minor wave 2 may be a complete double zigzag. The second zigzag labelled minute wave y is now a complete structure. Within the zigzag, minuette wave (c) no longer exhibits a Fibonacci ratio to minuette wave (a).
Within minuette wave (c), there is good alternation between the expanded flat of subminuette wave ii and the triangle of subminuette wave iv.
If price breaks above the gold best fit channel with clear upwards movement, not sideways, that shall offer some confidence that a low is in place. A new high above 1,268.38 would offer further confidence.
Allow for the possibility that price could continue lower while it remains within the channel.
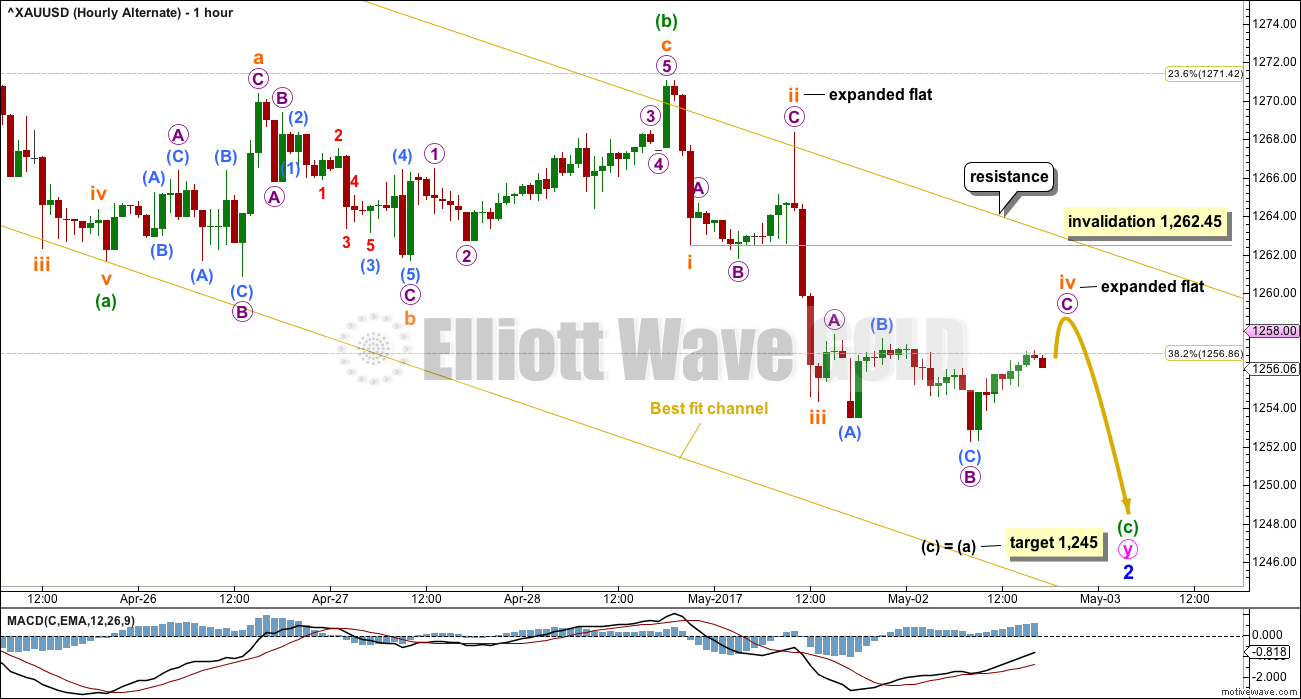
ALTERNATE HOURLY CHART
Click chart to enlarge.
It is also possible that minor wave 2 is not over and may continue lower.
Within minuette wave (c), there is no longer alternation between the corrections of subminuette waves ii and iv. If subminuette wave iv is continuing further, then it looks like an expanded flat correction. Alternation is a guideline not a rule, so this wave count is possible but the lack of alternation does reduce its probability.
The target about 1,245 would now very closely align with support at the lower edge of the base channel on the daily chart.
TECHNICAL ANALYSIS
WEEKLY CHART
Click chart to enlarge. Chart courtesy of StockCharts.com.
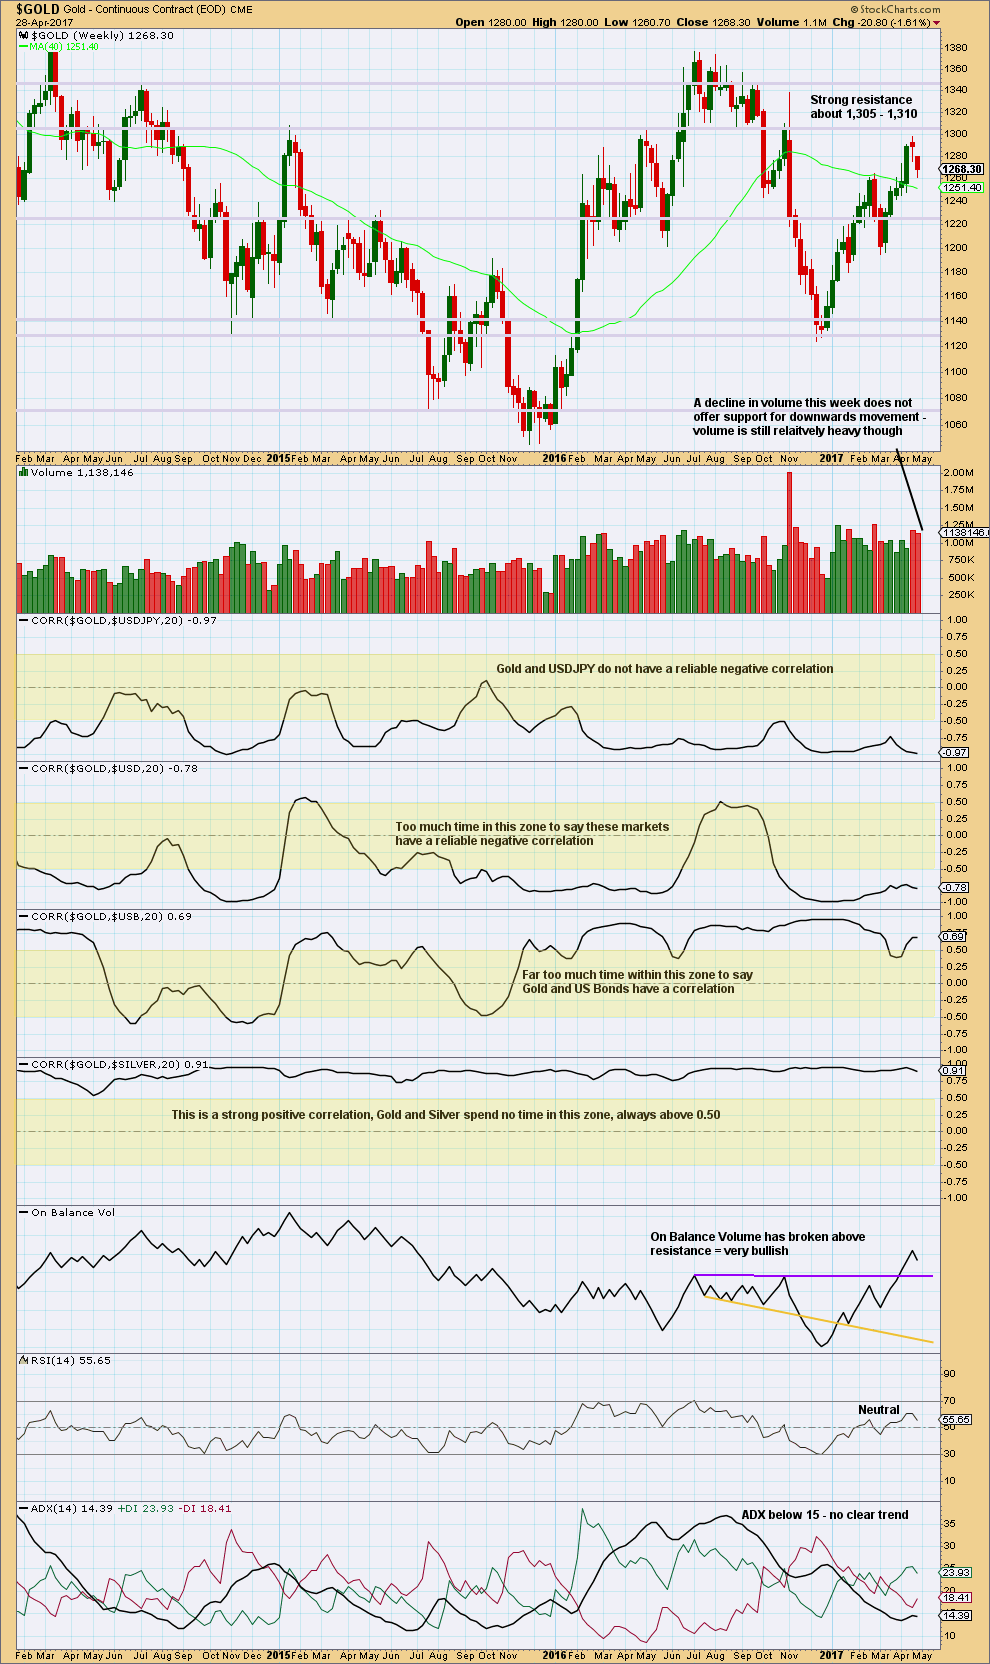
There are a lot of assumptions out there about Gold and its relationships to various other markets. Happily, there is a quick and easy mathematical method to determine if Gold is indeed related to any other market: StockCharts have a “correlation” option in their indicators that shows the correlation coefficient between any selected market and the one charted.
The correlation coefficient ranges from -1 to 1. A correlation coefficient of 1 is a perfect positive correlation whereas a correlation coefficient of -1 is a perfect negative correlation.
A correlation coefficient of 0.5 to 1 is a strong positive correlation. A correlation coefficient of -0.5 to -1 is a strong negative correlation.
Any two markets which have a correlation coefficient that fluctuates about zero or spends time in the 0.5 to -0.5 range (shown by highlighted areas on the chart) may not be said to have a correlation. Markets which sometimes have a positive or negative correlation, but sometimes do not, may not be assumed to continue a relationship when it does arise. The relationship is not reliable.
For illustrative purposes I have included the correlation coefficient between Gold and Silver, which is what strong and reliable correlation should look like.
Volume for last week suggests the downwards movement is a pullback, and it may still continue further as volume remains fairly heavy.
Gold has made a series of higher highs and higher lows since the low in December 2016, the definition of an upwards trend. Assume the trend remains the same until proven otherwise.
This weekly chart still remains mostly bullish with some neutrality.
DAILY CHART
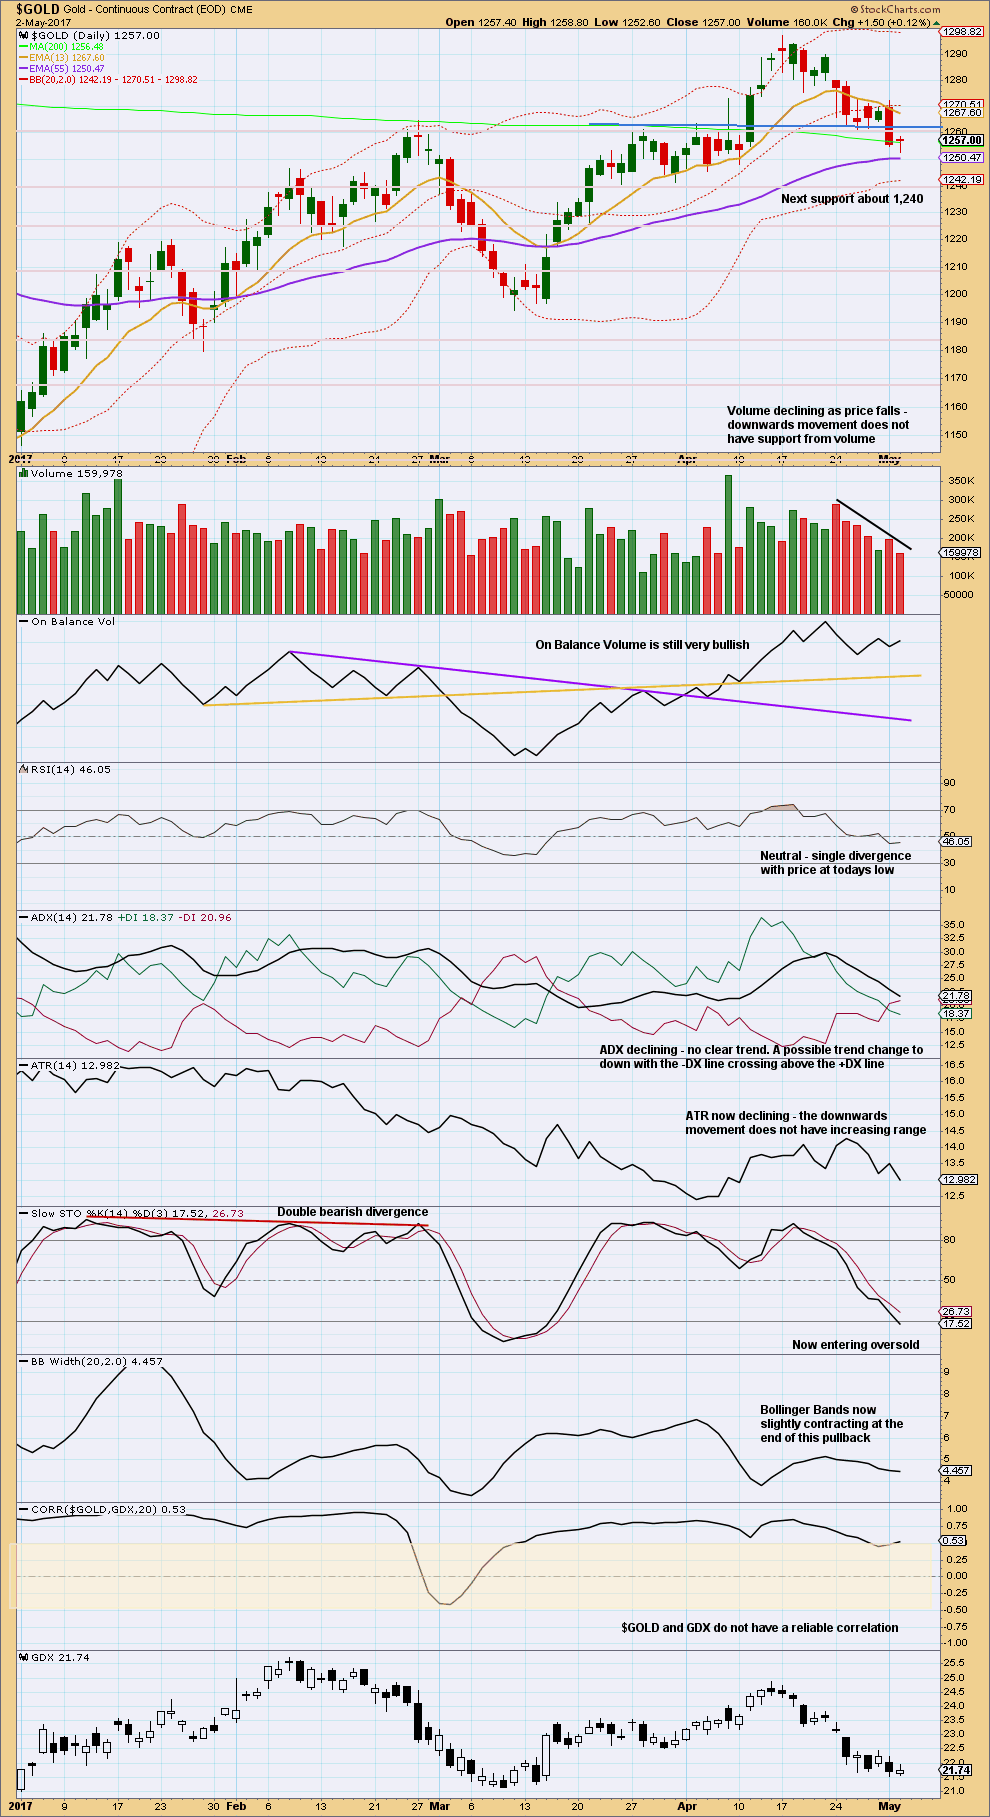
Click chart to enlarge. Chart courtesy of StockCharts.com.
Support about 1,240 aligns nicely with the Elliott wave target at 1,245 and the lower edge of the base channel on the daily Elliott wave charts. If price does move lower, it looks very likely to end about the 1,245 to 1,240 area.
Price may be finding some support today at the mid term Fibonacci 55 day moving average.
Today’s session completes a doji, which has a very small upper wick; this is a Dragonfly Doji, which is bullish. While doji are useful in calling market tops, they are less useful in calling market bottoms. More confirmation is needed to signal a low.
RSI is today very slightly bullish with some divergence.
ADX, ATR and Bollinger Bands still point to this downwards movement being a pullback within a larger upwards trend.
TRADING ADVICE
More adventurous members may like to enter long here for Gold. If entering a long position here, be prepared to have an underwater position for up to about three days. Stops may be set a little below 1,240.
More conservative members may like to wait for the channel on the hourly chart to be breached before entering long.
Always follow my two Golden Rules for risk management.
1. Always use a stop.
2. Invest only 1-5% of equity on any one trade.
GDX
DAILY CHART
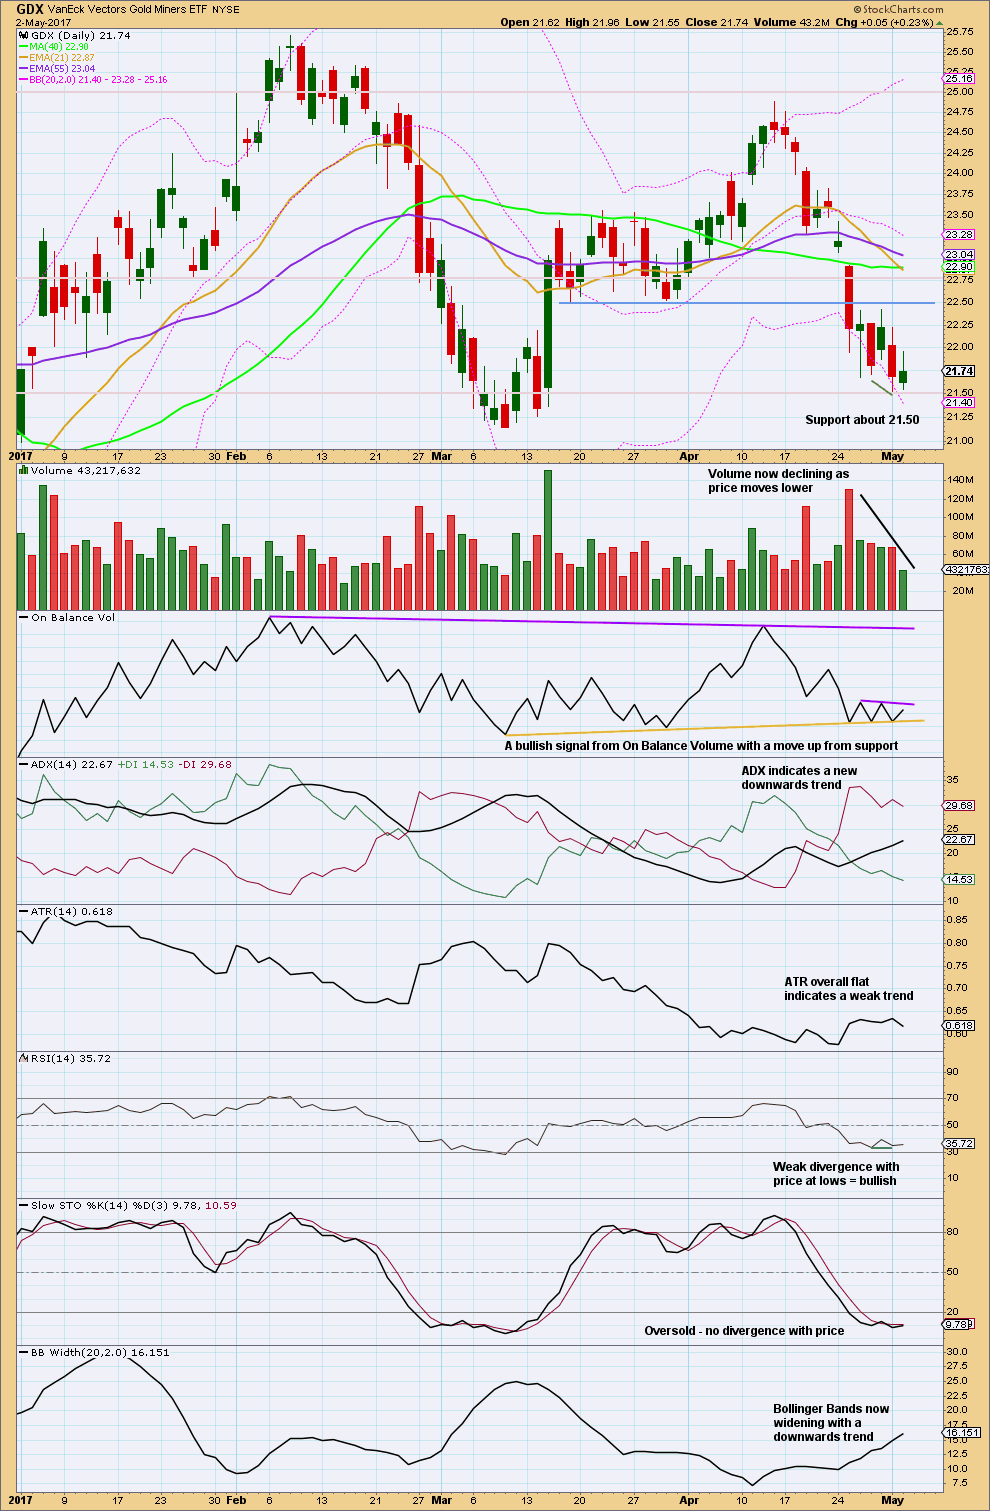
Click chart to enlarge. Chart courtesy of StockCharts.com.
This chart is mixed. Bollinger Bands and ADX indicate a downwards trend with volatility. But ATR, RSI and volume indicates some weakness.
On Balance Volume at support is a strong signal. A new resistance line is added but this does not yet have good technical significance.
It looks like a low for GDX may be either already in or may be very close.
STUDY OF A THIRD WAVE IN $GOLD
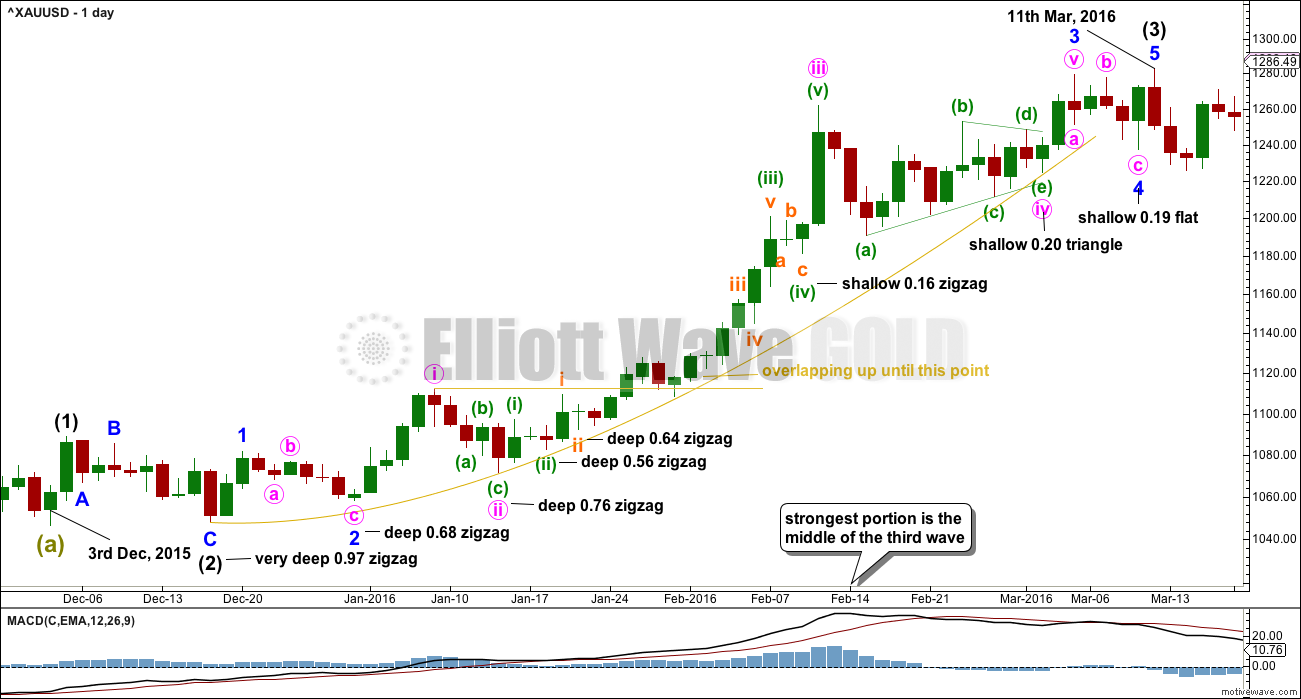
Click chart to enlarge.
This study of a third wave will be left in daily analysis until the current third wave is either proven to be wrong (invalidated) or it is complete.
This third wave spans 59 trading days.
It was not until the 40th day that the overlapping ended and the third wave took off strongly.
The middle of the third wave is the end of minute wave iii, which ended in a blow off top.
There is excellent alternation between second and fourth wave corrections.
This third wave began with a series of five overlapping first and second waves (if the hourly chart were to be added, it would be seven) before momentum really builds and the overlapping ends.
The fifth wave of minuette wave (v) is the strongest portion.
This third wave curves upwards. This is typical of Gold’s strong impulses. They begin slowly, accelerate towards the middle, and explode at the end. They do not fit neatly into channels. In this instance, the gold coloured curve was used.
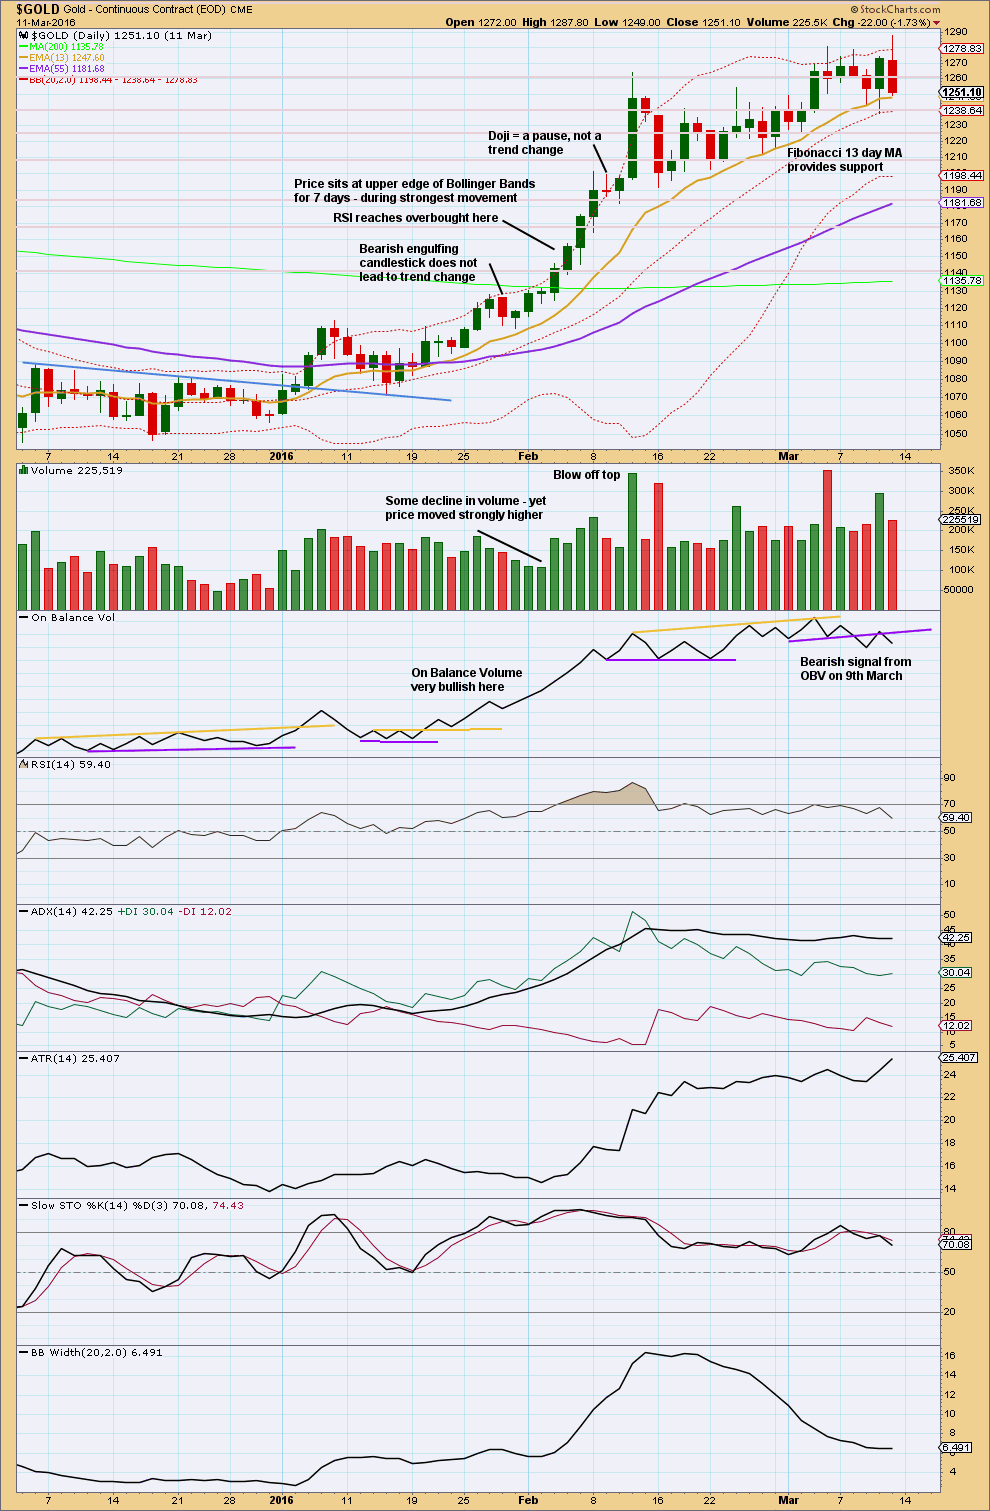
Click chart to enlarge. Chart courtesy of StockCharts.com.
This trend began after a long consolidation period of which the upper edge is bound by the blue trend line. After the breakout above the blue trend line, price curved back down to test support at the line before moving up and away.
RSI reaches overbought while price continues higher for another five days and RSI reaches above 85. The point in time where RSI reaches overbought is prior to the strongest upwards movement.
ADX reached above 35 on the 9th of February, but price continued higher for another two days.
The lesson to be learned here: look for RSI to be extreme and ADX to be extreme at the same time, then look for a blow off top. Only then expect that the middle of a big third wave is most likely over.
The end of this big third wave only came after the blow off top was followed by shallow consolidation, and more highs. At its end RSI exhibited strong divergence with price and On Balance Volume gave a bearish signal.
Third waves require patience at their start and patience at their ends.
This analysis is published @ 06:40 p.m. EST.
Dreamer called it people. We have our long lower wick in the futures market. I’m waiting for a nice fat green one and I’m out of my hedges. Man, did they pop on the capitulation move down today…perfect timing! Saddle up! 😀
I can hear the William Tell Overture!
The part you know well is at 7:45 time stamp, but you have to admit, the rest of it is also pretty good! 🙂
https://www.youtube.com/watch?v=g6gzgcGrE2M
PS. Some of you might recognize the famous RAID commecial!
Lara
Gold is below the trend line (daily EW).
Does that mean that the EW count which we were following since months is now in danger ?
Only if that trend line is breached by one full daily candlestick fully below and not touching the line, is the bull count in danger.
It is only at that point I would publish the very bearish alternate.
That line is the point which differentiates the two counts.
The price drop saw a capitulation bottom, not done yet. This is because the low at 1245.73 broke below the Ichimoku support at 1245.95, paving the way for the next support at the 0.618 retrace for Minor 2, where Minor 2 = 0.618 * Minor 1 at 1233.32. And that’s where I’m entering long. Guess it would have to be tomorrow. May the fourth be with you!
Yep! Yep! Yep! Capitulation it is Cap’n! 🙂
Daily channel testing…
.618 is 1233
Something doesn’t seem right…I’ve greatly reduced all GC and miners positions. Looking for clarity…
Something must be wrong, the Big Boys at play lol….Just thinking, if Gold price does not pull itself back up above 50dma (1249-50) then most likely the 100dma at 1220 will come in to play… Lets see how this closes today. All the best. Tomorrow is another day!
Puzzled! lol… Was long Gold at 1246, switched it with upside risk 1253-55; if 1243-39 don’t hold, opens up 1227… Unusual for hourly / 4-hourly RSI to stay below 30 for too long but DMI+ crossed below DMI- on the daily and CCI on daily, weekly, monthly tells a different story…..
I’m in long, stop just below 1,239.
nice action on copper today. I closed 50% of my short on this good down move.
Wow! That’s one huge fat red candlestick!
Nice to see divergence in miners. You’d think they’d be down 3% based on recent action. We should see some follow through in the next few days.
Well, that didn’t work out so well 🙁
Will wait for some clarity before attempting again.
The low so far today is very close to the alternate target at 1,245.
I’m having difficulty figuring out the possible structure of subminuette iv. I’ve labelled it as a combination, which offers some structural alternation with submineutte ii, but I’m not happy with the running flat within it.
Price is so close to the lower edge of the base channel. Based upon the simplest approach and looking at the weekly chart, it’s very reasonable to expect support here. The larger trend is up, so this deep pullback offers a gift to join it at a very good price.
This will feel wrong, it’s one of the hardest things to do as traders, enter on a pullback. Buy The Dips is a common refrain, but it’s not actually done very successfully by too many people I would guess.
I am merrily adding to my SLV 15.50 calls. Cost basis at exactly 0.30
Content to hang tough above 0.20 as I am starting with a small speculative stake. How low, can we go???! 🙂 🙂
Just my two cents, but be careful here. Dreamer had shared some charts which noted that both were to make lower lows. They haven’t done so yet.
Alan has noted that the Fed is to release their decision on rates today and brings up an excellent point about how the Fed is handling the asset liquidation. I don’t believe this key piece will be addressed within the statement today but instead, will be addressed when the minutes are released.
Lara has pointed out that the we need the channel to be broken to indicate an upwards movement is back in play.
It’s hard to resist when GDX and GDXJ are moving up when gold is moving down indicating a bottom is possibly in or close to being in, but be careful with your entries.
Thanks to all who continue to make contributions with their postings!
Very wise advice. For the bold, layer into long positions…
GDXJ and GDX outperforming going into FOMC announcement (same as March 15).
Amazing how gold has held up in relation to silver and the miners.
If we start this 3rd leg up in gold, then the miners *should* rip higher. When gold was trading at 1370 last summer, GDX was 31 bucks…that’s over 40% above today’s price. GDXJ was 70% higher!
Silver has now declined for thirteen consecutive trading days, exceeding the longest such recent streak by two days. We are quite a distance from the 200 dsma and ectremely oversold. On RTM principle alone, buying SLV week 2 15.50 strike calls for 0.33 per contract.
We could see a sharp rebound…
The GLD decisive surrender of the 200 dsma is bearish. The longer it stays below this critical pivot the more troble for us bulls. Adding to hedges until we climb back above.
While we are waiting for some big Mo from big G, I hope everyone is taking advantage of Lara’s great call on oil. APC is going to gap down at the open a whopping three handles!
Apologies for the missing Ichimoku chart.
In the very short term, both the Main and the Alternate counts predict prices will increase, and that in tandem. My calculations show the end point of such an increase lies in the region of 1260 – 1262. Following this, the drop will distinguish between the two. For the Main Count, price cannot drop below 1252.25, the end of Minor 2. If it does the Main count needs to be re-evaluated; one possibility is that the low of 1252.25 is only subminuette 3 of Minor 2 as I suggested yesterday. For the Alternate count, price must drop below 1252.25, targeting the 1245 region.
I still think that the Alternate is the more likely. According to Ichimoku daily analysis, the support lies at 1245.95. In the meantime, the price movement is unenthusiastic as prices fell below both the tenkan and kijun lines, but remain above the green cloud. The inference is weakly bullish. Until price can break above the two lines (1269.45 and 1271.35 respectively), the uptrend cannot be said to re-assert itself.
Perhaps the impetus can emerge from the FOMC today. From a fundamental viewpoint, a June rate hike seems uncertain, but a more telling sign would be the details of the assets liquidation (which tantamounts to a rate hike). If neither meets with approval, then equities could lose their lustre, but would that mean gold will be the beneficiary? Given the lull in geopolitical tension, the much-hoped-for strong uptrend might not manifest itself soon.
http://www.howestreet.com/2017/04/28/equities-gold-oil-bound-together/
Traders may want to listen to Interview w/Tim Wood- Cyclesman.com….
more lows coming for all of above before one more blast up in equities and commodities together…
Thanks for the post Melanie.
As Gold traders, I don’t think his general comments that SPX, OIL, and commodities move together is very helpful.
For example, look at the CORRELATION between GOLD and SPX and between GOLD and OIL.
The green shaded areas denote “strong positive correlation” and the pink shaded area denote “strong negative correlation”. The rest of the time, the correlation is weak and moves from positive to negative. No consistency at all.
Exactly.
Simple math.