
A little upwards movement was expected but price fell $8 short of the target.
Summary: The bounce for minor B looks complete. Downwards movement is expected for one to a few weeks. The first weekly chart has a target at 1,141. The second weekly chart has a target range at 1,157 to 1,149. These two targets have a close to even probability, with the first weekly chart only slightly more likely.
Members may enter short here with a stop just above the last swing high at 1,270.32, or may wait for the channel on the hourly chart to be breached for further confidence before entering short. Always use a stop. Invest only 1-5% of equity on any one trade.
New updates to this analysis are in bold.
Last historic analysis with monthly charts is here, video is here.
Grand SuperCycle analysis is here.
MAIN ELLIOTT WAVE COUNT
For clarity I have decided at this time it may be best to publish on a daily basis weekly charts I, II and IV. Both weekly charts I and II expect a zigzag down to complete and the difference is in the expected depth. Weekly chart IV has a very low probability and will only be given serious consideration if price makes a new high above 1,294.96.
WEEKLY CHART I
Click chart to enlarge.
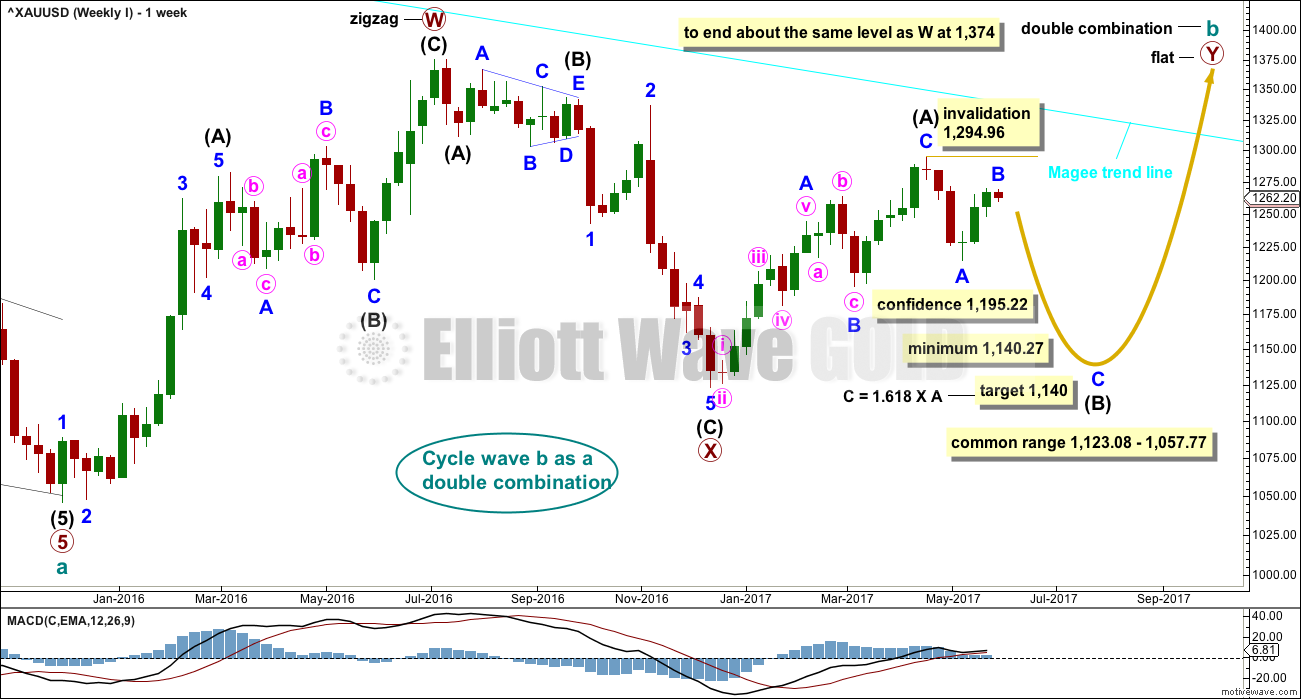
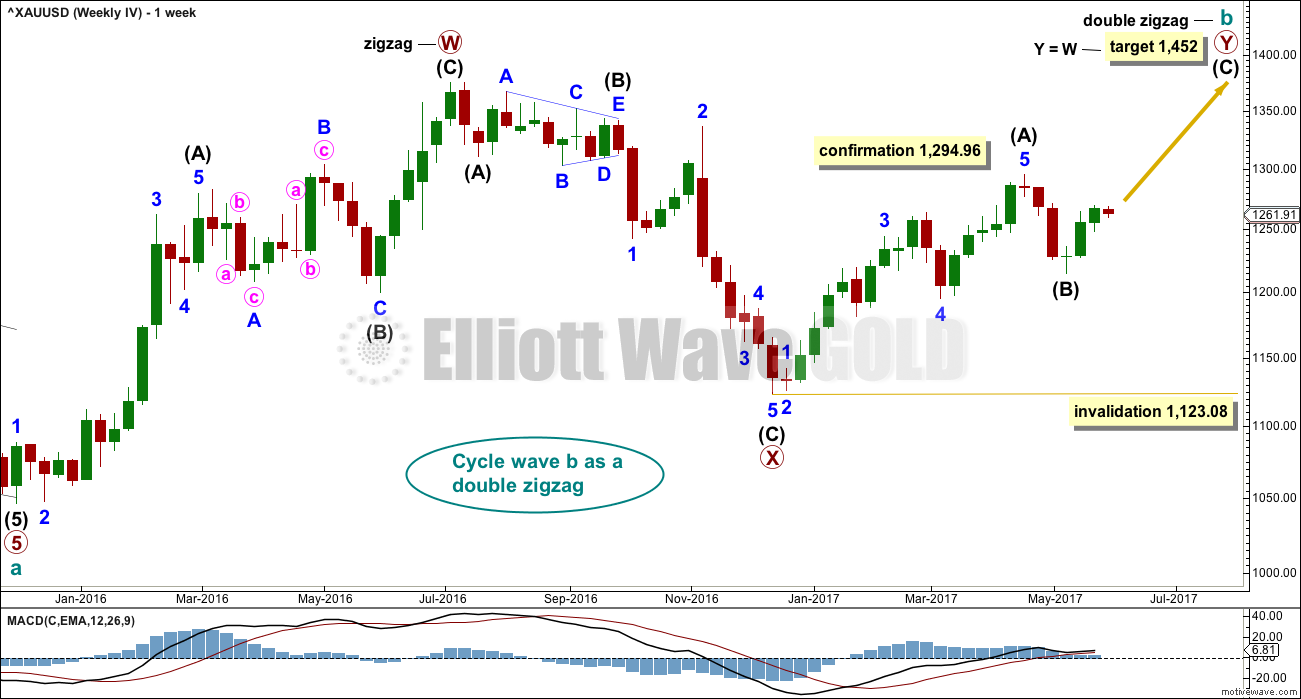
Combinations are very common structures. Cycle degree waves normally last one to several years, and B waves do tend to be more time consuming waves than all other waves. Given these tendencies the most likely scenario at this point may be that cycle wave b is an incomplete double combination.
The first structure in the double labelled primary wave W fits as a zigzag. This upwards movement will subdivide as either a three (zigzag) or a five (impulse). It does have a three wave look to it.
The double is joined by a deep three in the opposite direction labelled primary wave X, which is a 0.77 depth of primary wave W. X waves within double combinations are normally very deep; this one looks right.
The second structure in the combination may be either a triangle or a flat correction. Both of these structures have A waves which subdivide as threes.
At this stage, the upwards wave from the low in December 2016 does now look best and subdivide best as a completed zigzag. This may be intermediate wave (A) of a flat correction or a triangle. Because a triangle for primary wave Y would look essentially the same as the second weekly chart below, only a flat correction is considered here. The most common two structures in a double combination are a zigzag and a flat.
This wave count follows the most common scenario and has the best fit.
Within the flat correction of primary wave Y, intermediate wave (B) must retrace a minimum 0.9 length of intermediate wave (A) at 1,140.27. The most common length for intermediate wave (B) is from 1 to 1.38 times the length of intermediate wave (A), giving a common range from 1,123.08 to 1,057.77.
A target is now calculated for minor wave C to complete intermediate wave (B). This target would meet the minimum requirement for intermediate wave (B). Minor wave B has moved very slightly higher but the target remains the same. At 1,140 minor wave C would be very close to 1.618 the length of minor wave A and the minimum requirement for intermediate wave (B) would just be met.
Intermediate wave (B) may subdivide as any corrective structure, but the most common structure for B waves within flats is a zigzag. At this stage, on the hourly chart it looks like a five down labelled minor wave A is complete, which would indicate intermediate wave (B) is a zigzag subdividing 5-3-5.
The daily and hourly charts will follow this weekly chart. That does not mean the other three weekly charts aren’t possible, they are, but the number of charts must be kept reasonable on a daily basis.
The Magee bear market trend line is added to the weekly charts. This cyan line is drawn from the all time high for Gold on the 6th of September, 2011, to the first major swing high within the following bear market on the 5th of October, 2012. This line should provide strong resistance. If that resistance holds, then the second weekly chart would be correct.
WEEKLY CHART II
Click chart to enlarge.
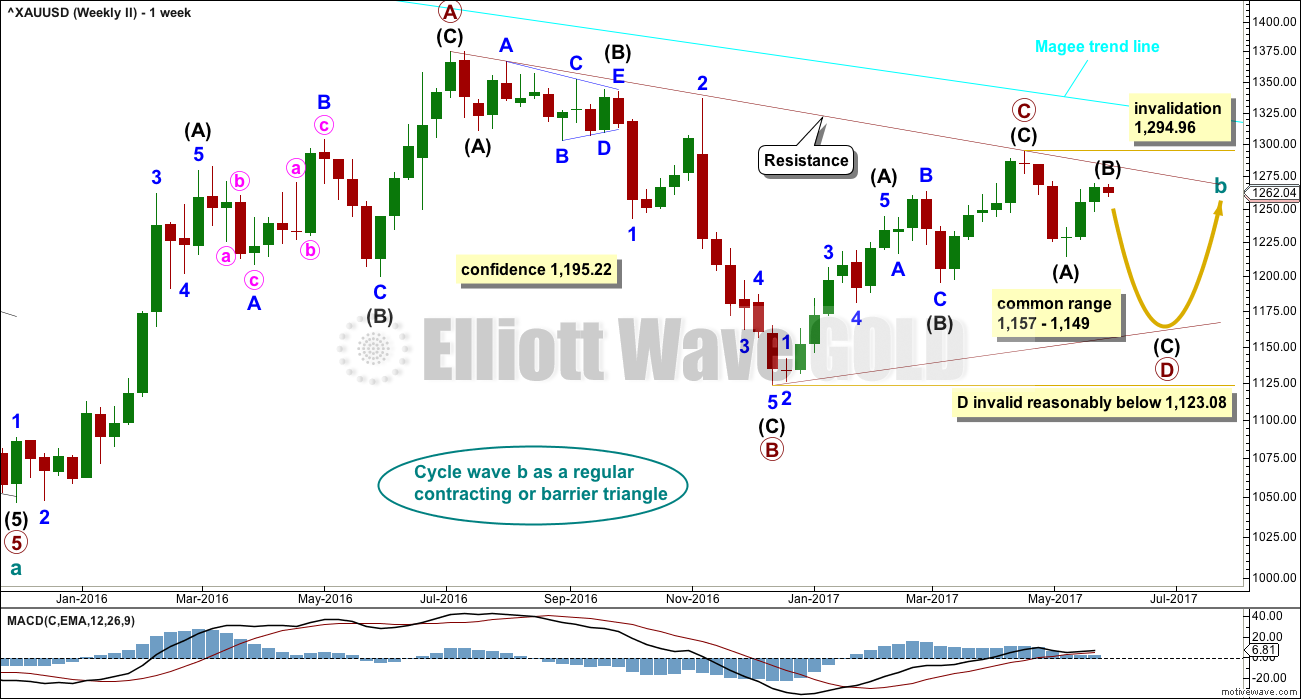
What if cycle wave b is a triangle? This is also entirely possible. Triangles are not as common as double combinations, but they are not uncommon.
Within the triangle, primary waves A, B and C are all single zigzags. One of the five subwaves of a triangle normally subdivides as a more complicated multiple, usually a double zigzag. This may be what is unfolding for primary wave D. It may also subdivide as a single zigzag.
Primary wave D of a regular contracting triangle may not move beyond the end of primary wave B below 1,123.08.
Primary wave D of a regular barrier triangle should end about the same level as primary wave B at 1,123.08, so that the B-D trend line is essentially flat. What this means in practice is that primary wave D may end slightly below 1,123.08 and the triangle would remain valid. This is the only Elliott wave rule which is not black and white.
Thereafter, primary wave E should unfold upwards and would most likely fall a little short of the A-C trend line. If not ending there, it may overshoot the A-C trend line. Primary wave E may not move beyond the end of primary wave C above 1,294.96.
Triangles normally adhere very well to their trend lines. Occasionally, price may overshoot the trend lines but when this happens it is not by much and is quickly reversed. The upper A-C trend line should offer very strong resistance at this stage if cycle wave b is unfolding as a triangle. This trend line is added to the daily chart below.
At this stage, the structure on the hourly chart is still the same for both this weekly wave count and the first weekly wave count: a zigzag downwards is unfolding. However, they now diverge in how far down the next wave is expected to go. This second weekly wave count expects a more shallow movement to not end reasonably below 1,123.08.
DAILY CHART
Click chart to enlarge.
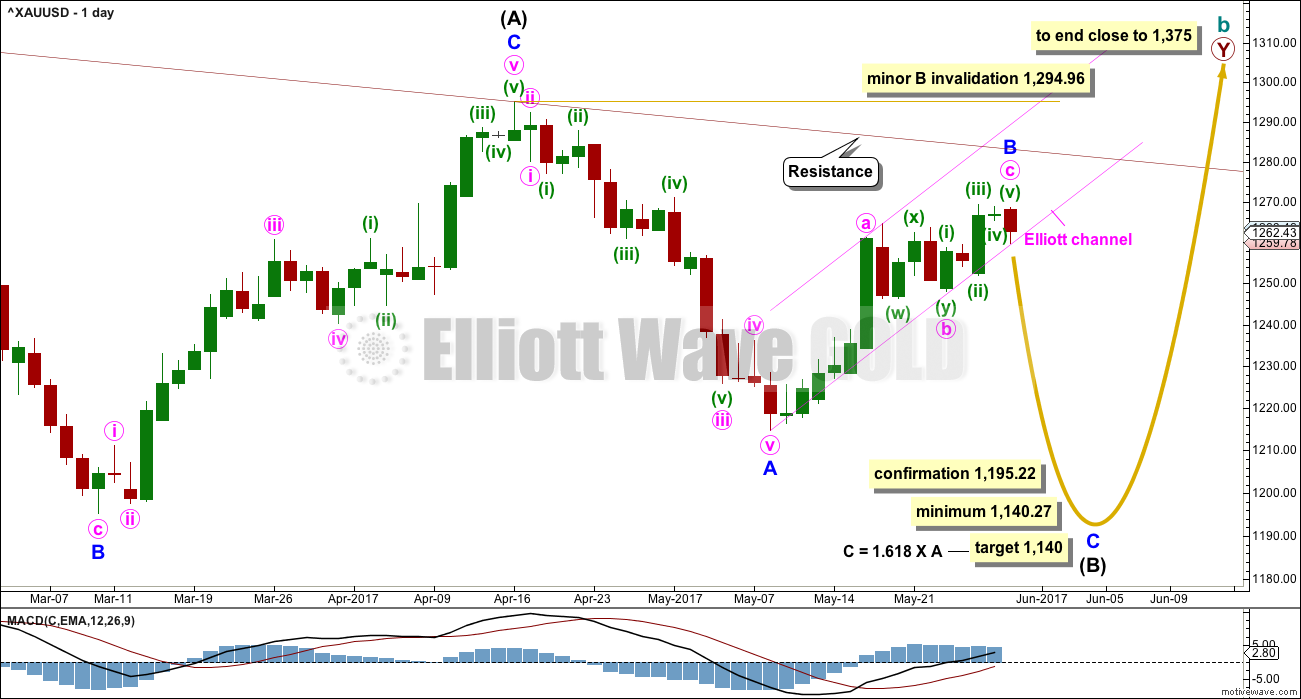
This daily chart will suffice for both weekly charts above, although the labelling follows weekly chart I.
Both weekly charts expect a zigzag downwards. (It may also turn out to be a double zigzag. For now a single only will be charted but a double will be kept in mind). Weekly chart I expects a deep zigzag for intermediate wave (B) to a minimum at 1,140.27. Weekly chart II expects a zigzag down for primary wave D to not move below 1,123.08 and most likely fall well short of that point.
The daily chart follows the expectations for weekly chart I, but the structure for weekly chart II would be exactly the same at this stage.
Within the flat correction of primary wave Y, intermediate wave (B) must retrace a minimum 0.9 length of intermediate wave (A) at 1,140.27. The most likely corrective structures to achieve the deep correction required for B waves within flats are single or multiple zigzags. These begin with a five, then a three in the opposite direction.
Minor wave A is complete. Minor wave B may now be a complete zigzag.
Because the triangle idea at this stage does not have a good fit only two hourly charts are published today.
Minor wave B may not move beyond the start of minor wave A above 1,294.96.
MAIN HOURLY CHART
Click chart to enlarge.
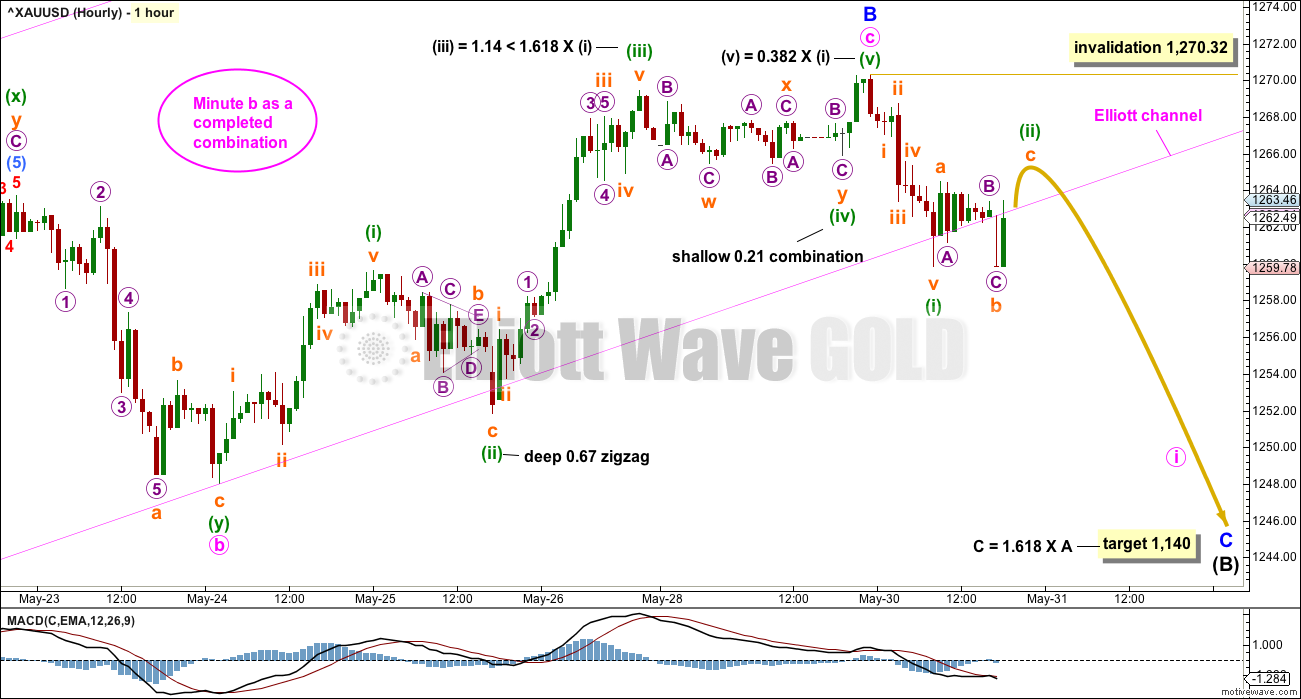
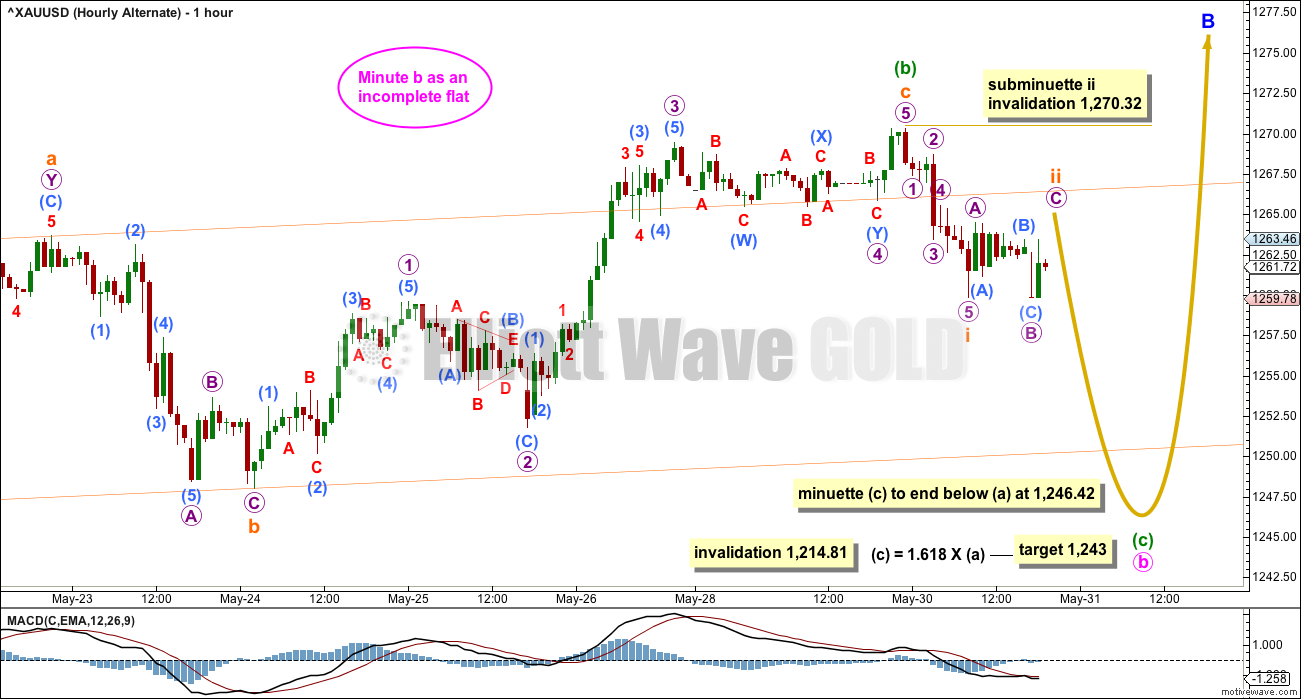
Minute wave b may be a complete double combination. These are very common structures. The most common combination of corrective structures in a double is a zigzag and a flat.
Minuette wave (w) (now off to the left of the chart) fits as an expanded flat. Minuette wave (y) fits now as a completed zigzag.
The structure for minute wave b is a big sideways movement. This looks typical for a double combination.
Within combinations, X waves may be any corrective structure including multiples. However, they are most commonly single zigzags. For this wave count, the multiple zigzag for minuette wave (x) reduces its probability. However, subsequent price movement fits this first hourly chart best at this stage.
Minute wave c now fits perfectly as a completed five wave impulse. There is perfect alternation between the deep zigzag of the second wave and the shallow combination of the fourth wave. All three actionary waves exhibit Fibonacci ratios.
Price just after the end of Tuesday’s session has broken below the Elliott channel containing minor wave B. Draw this channel from the start of minor wave B to the end of minute wave b, then place a parallel copy on the end of minute wave a. Now that the lower edge has been breached, it is possible price may find resistance there and not reenter the channel; the expectation of minuette wave (ii) to move a little higher may not happen.
Minuette wave (ii) may not move beyond the start of minuette wave (i) above 1,270.32.
ALTERNATE HOURLY CHART
Click chart to enlarge.
What if a flat correction is still unfolding for minute wave b and minuette wave (b) within it is still incomplete?
Within a flat correction, both of waves A and B must subdivide as threes. Here, minuette wave (a) is an expanded flat and this is classified as a three. Minuette wave (b) may be a complete regular flat, also classified as a three.
Within the regular flat of minuette wave (b), subminuette wave c has now moved above the end of subminuette wave a at 1,263.71 avoiding a truncation. The structure of subminuette wave c is now complete.
This wave count allows for further sideways movement in an ever increasing range.
A channel is drawn about the regular flat correction of minuette wave (b). With subminuette wave c moving only very slightly higher, it does now overall have close enough to the right look to be more seriously considered.
At this stage, both hourly wave counts expect a five down to unfold: the main hourly wave count for minute wave i within minor wave C and this alternate for minuette wave (c) within minute wave b. Classic technical analysis is now used to determine the probability of these two hourly wave counts and this alternate today has a lower probability.
WEEKLY CHART IV
Click chart to enlarge.
What if the bull market beginning in December 2015 remains intact? Price has essentially been moving sideways since that date, so all possibilities should be considered.
The Morning Doji Star at the low labelled intermediate wave (B) will not be considered as a reversal pattern here because it comes in what is essentially a sideways movement. It does not come after a downwards wave, so there is nothing to reverse.
This wave count requires confirmation above 1,294.96. That would invalidate the first three weekly charts (the third is seen in historic analysis only).
It is possible that cycle wave b is continuing higher as a double zigzag. However, double zigzags normally have brief and shallow X waves. The purpose of the second zigzag in a double (and the third when there is one) is to deepen the correction when price does not move deep enough in the first (or second) zigzag. Thus double (and triple) zigzags normally have a strong and clear slope against the prior trend. To achieve this look their X waves normally are brief and shallow.
In this case, primary wave X is neither brief nor shallow. It is a 0.77 depth of primary wave W and lasted 0.74 the duration of primary wave W. Overall, this does not have a typical look of a double zigzag so far.
This wave count also must see the rise up to the high labelled intermediate wave (A) as a five wave impulse, not a three wave zigzag. This looks a little forced, so it reduces the probability of this wave count.
This wave count should only be used if confirmed with a new high above 1,294.96. Low probability does not mean no probability, but should always be given less weight until proven.
TECHNICAL ANALYSIS
WEEKLY CHART
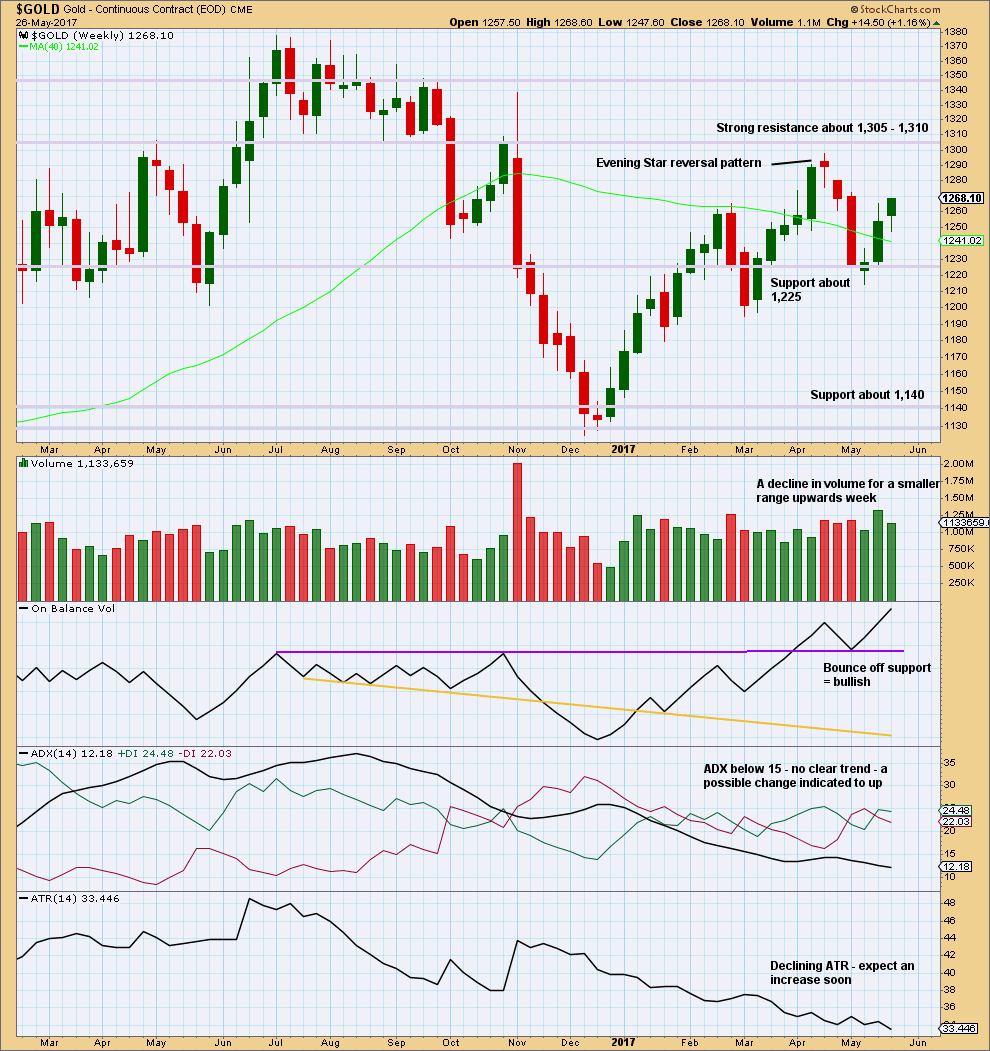
Click chart to enlarge. Chart courtesy of StockCharts.com.
The decline in volume is bearish, but it does not mean upwards movement must stop here. Price can continue higher on declining volume for another few weeks before a trend change as it did in February of this year.
On Balance Volume remains bullish. The long lower wick on this weekly candlestick is bullish.
ATR is bearish.
Overall, this chart is slightly bullish.
DAILY CHART
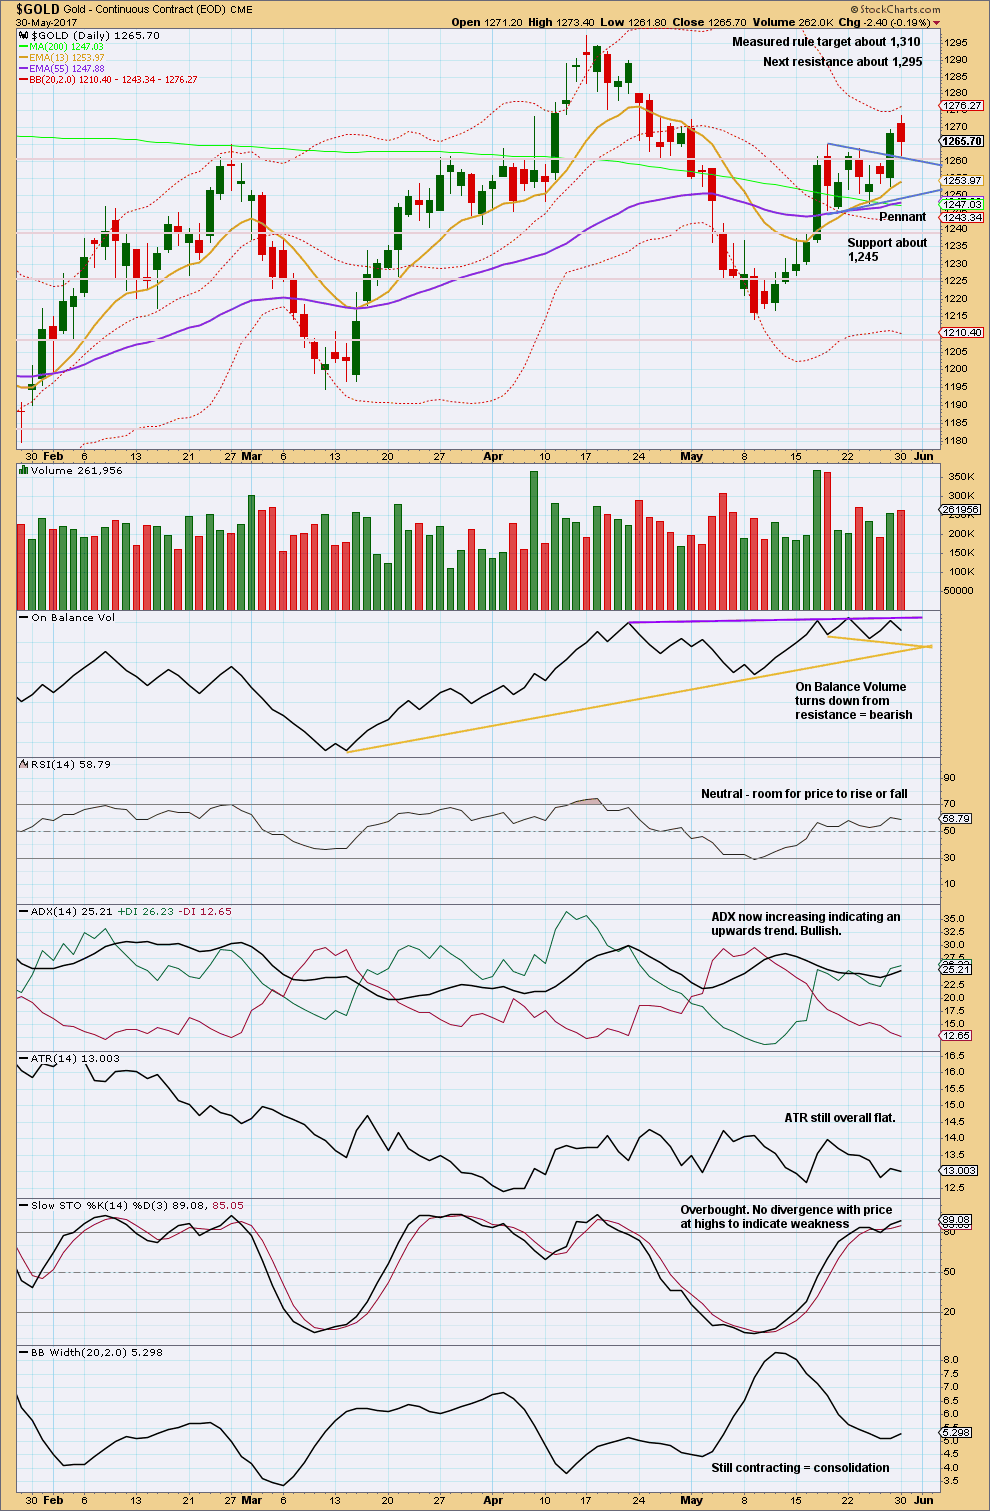
Click chart to enlarge. Chart courtesy of StockCharts.com.
Strongest recent volume (with the exception of the blow off top for the 17th of May) is for downwards days. It looks like upwards movement saw a blowoff top on the 17th of May, followed by a sideways consolidation and now a final high which shows some weakness.
The session for the 30th of May saw the candlestick close red and the balance of volume downwards. During this session, there was support for downwards movement from volume and this is read as bearish.
Price is finding support exactly at the upper edge of the small pennant pattern. At this stage, this looks like a typical test of support and it would be typical to see price now move up and away here.
However, give reasonable weight to the bearish signal today from On Balance Volume. This resistance line is reasonably long held, has been tested four times now, and has a very slight slope. The line has reasonable technical significance.
ADX and Bollinger Bands indicate there is weakness in upwards movement; it lacks range and volatility. This supports the Elliott wave counts which see upwards movement as a B wave.
GDX
DAILY CHART
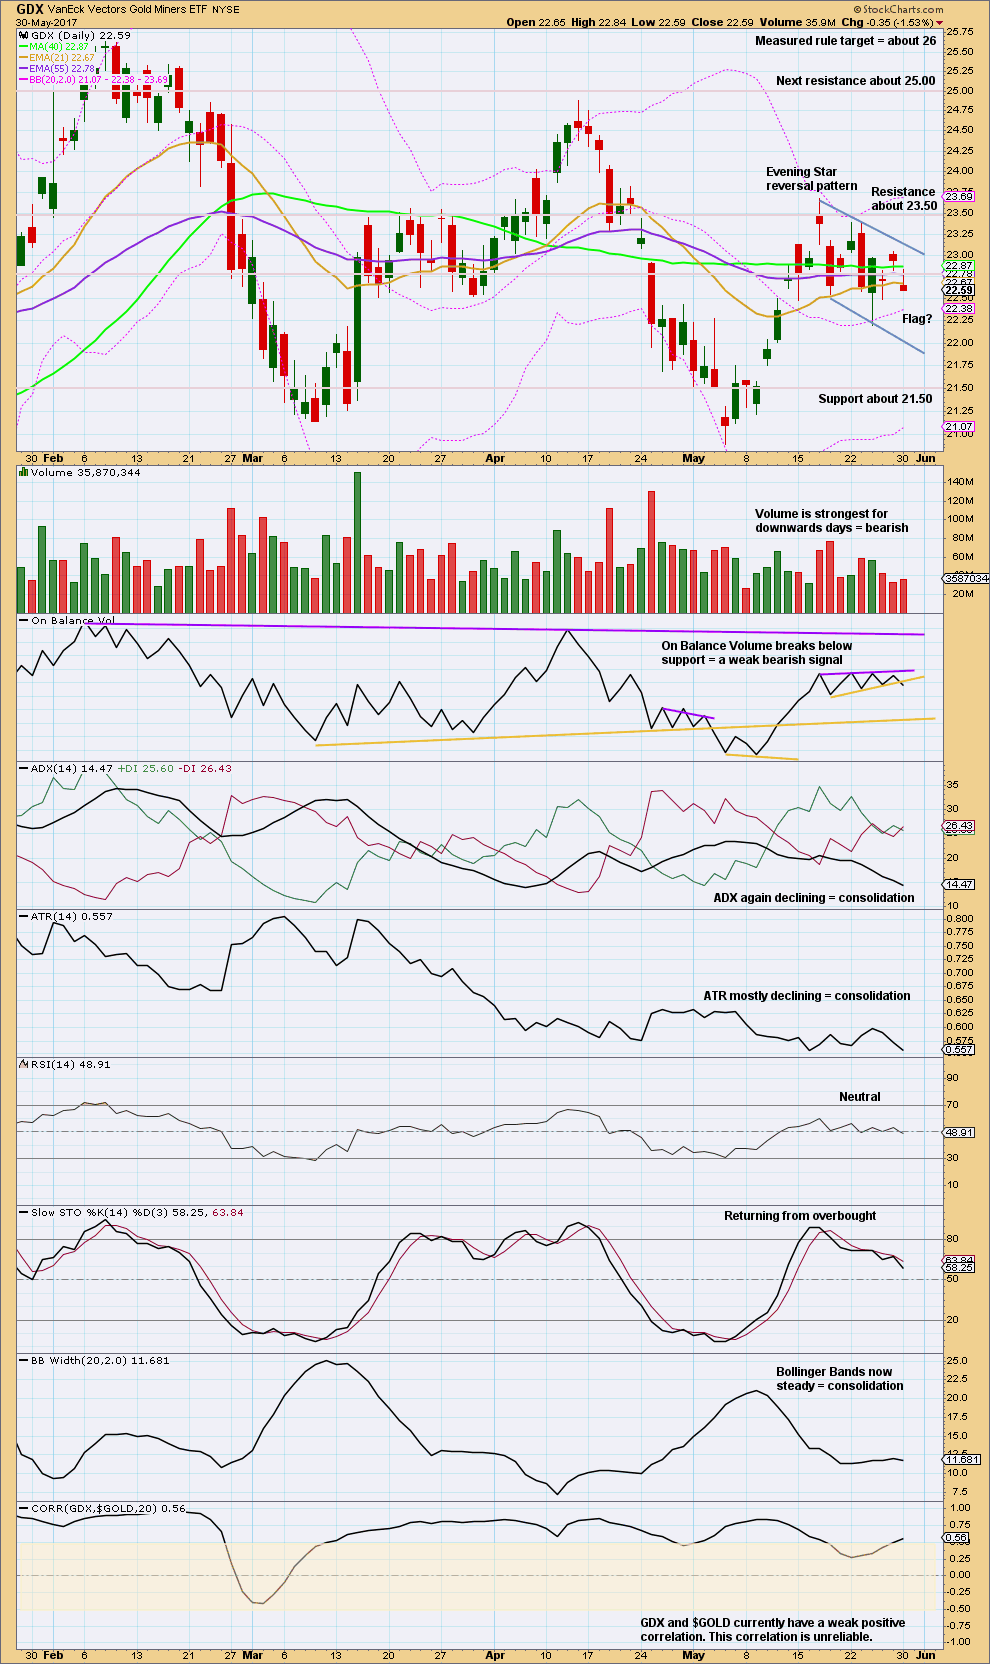
Click chart to enlarge. Chart courtesy of StockCharts.com.
A weak bearish signal from On Balance Volume shifts the probability of the next movement for price to downwards for GDX.
This analysis is published @ 08:04 p.m. EST.
Obviously minor B has moved higher, which was unexpected.
Minuette (iv) touched minuette (i), but there was no overlap.
It looks like a typically swift strong fifth wave so far. Lets see if it has support from volume, and what On Balance Volume is doing today.
Some interesting stat on gold supply/demand and trades.
From Gold money :
==============================================
Gold paper trading volumes are astounding
Governments and central banks currently have a very effective way of manipulating the gold price and this is the main reason why gold so far has not risen like Bitcoin. But in due course this will all change. If we look at the gold paper market, the amount of paper trading is astounding. In 2016, $10 trillion of paper gold was traded in four exchanges with Comex in New York accounting for 76% or of that. $10 trillion is more than all the gold ever produced in history which is $7 trillion. But the paper gold traded on the futures exchanges is totally dwarfed by the amount traded by the LBMA banks in London. In 2016, the total estimated gold traded in London is estimated at $64T. Of that less than 1% is physical. Adding the LBMA and Futures Exchanges gold trading we get to an astounding $74T annually. Thus, the world trades more paper gold than goods and services since global GDP is $70T. And the gold traded in 2016 is over 600x the gold mined every year. Even more incredible is that the paper gold traded was 10x all the gold ever produced in history.
Gold invalidated hourly wave count.
In 2 hour period gold broke out from an inverse HnS pattern.
Looks bullish to attack the final price point 1294+.
https://www.tradingview.com/x/uhzWslh9/
Unless it is a false breakout here??
Looks like a false break to the downside; imo anywhere between the 5dma/10dma (1266-61) could be a good place to go long for a take out of Wednesday high. Upside move is expecting…. Lets see!
Ichimoku Gold Update
Data as at 2:00 pm ET May 31
========================
The high at 1273.47 is most probably the top. At the daily chart level, price has almost reached the top boundary of the cloud.
Lara’s charts require some tweaking. The high would be Minor B in Weekly I and the Main Hourly. In the Alternate Hourly, it would be minuette B of Minute B.
Moving forward, the Main Count expects a waterfall starting now. The Alternate Hourly sees a drop toward 1244 – 1246 (the lower cloud boundary region) followed by a rebound before the waterfall.
In the bullish scenario, a drop to test 1250 (and probably the lower cloud boundary at 1245.30) would be followed by a sharp rebound toward the 1452 high.
I’ve already placed my short by buying DUST at 28.78. Good luck, folks.
I set a buy for some DUST around 24.50$. I am waiting for tomorrow and the over night session for a new impuls, sometimes DUST is the next day cheaper. I sold some longs in Gold. I expect the EW count for tomorrow will reflect that there are some more days of disturbance. I don´t believe a trend to trade well. The future cloud is huge you can see the down side deep and the cloud can stay crossed to upside… So it´s stressed 🙁
Accidentally removed my stops in gold think I will wait it out until Lara’s update seeing as how I am already stuck looking for a turn soon good luck all. Cl looking ready for its dive great work lara
This may be in play from Lara’s post last week.
Amazingly Gdxj is down from Friday even though gold is up….it is close to oversold on stochastics but gold is overbought….somebody is hedging big time.
… hard to see Gold price back below 1265 for 1260 now….
Can someone say short squeeze!!!! Possibly anyway… especially with GDX showing no life while gold was climbing all day. Now that gold broke higher and made another new high, several of Lara’s charts have been invalidated.
Special thanks to Alan and Dreamer. You kept my hopes alive while I hung on to my position.
Should GDX gain some traction and move up quickly, we could find ourselves with a face ripper as shorts get squeezed.
Squeeze please! 🙂
Stephen, yep GDX and GDXJ are finally green. Way to hang in there. 🎢 🙃 😃 Should see more upside now!
So here’s another possibility that I see for a move higher, before we go lower. The possible target range is 1,280 to 1,304. This 4 hour chart seems to have Ichimoku cloud support also. I’ll let Alan elaborate on that if desired.
https://www.tradingview.com/x/HL1Mvhsc/
Ichimoku Gold Daily Analysis
Data as at 5:15 am ET May 31
========================
Gold markets had an interesting session on Tuesday as prices rallied to a one-month high on geopolitical concerns but found the 1270 level to be a bit too resistive to continue the move to the upside. The rally then fizzled out when solid economic data showed increased signs that the Federal Reserve would raise interest rates next month. Price spiraled down towards the 1260 level, where it found plenty of support. Recently, gold has been in a choppy market but it does have a bit of an upward bias to it due to the safety trade. Losses might be limited by fresh economic data and geopolitical concerns. I think that traders may be waiting for Friday’s US Non-Farm Payrolls report before making their next major investment decision.
On the daily chart level, gold prices re-entered the cloud from above, weakening the bullish cause. At the moment, gold is trading above both the tenkan-sen and the kijun-sen. The tenkan-sen lies above the kijun-sen on a bullish crossover three days ago. This is an encouraging sign for the bulls moving forward. Price is in the upper half of the cloud and an attempt to close above the top cloud boundary may be taking place today. Of course, a daily close above the top cloud boundary will be a bullish sign that will push price towards another attempt to test 1280.
On the other hand, a close below the lower cloud boundary at 1245.30 will be a bearish sign. Both Lara’s Main and Alternate Hourly counts point toward a test of the lower cloud boundary, a rebound, and an eventual waterfall. My version of weekly IV portends a drop to test the bottom cloud boundary followed by a successful rebound and rise toward 1452. It is still too early to tell which of the two scenarios, the bear or the bull, will eventuate. It does not help that gold is rather whimsical as of late.
To me, the path forward in the near vicinity in front is clear. Prices are attempting to break out above the top cloud boundary near 1270, but I think the resistance is still too formidable at this point in time. The natural reaction will then be a drop, an excellent shorting opportunity. A break below the 1260 level would see bearish pressure driving prices toward the psychologically important 1250 level, and if succeeding, to gravitate toward the cloud support currently at 1245.30. My crystal ball ran out of battery trying to see past that.
Nice video Lara !
I want to share this with you all.
I surfed with dolphins again yesterday. Here’s a short video from my GoPro. Magic!
Nice. Much more fun to play with dolphins than sharks!
Wow, within a few weeks down 100 plus…..that would be a good short…..even at half that….let’s hope it over quick….be watching the commercials to see when they start accumulating long positions as a clue. Last week commercials started going heavy short. With gold anything can happen, North Korea, Russia, Iran, etc. so no guarantees on the short end. That is why we buy gold to begin with.
Well, that’s only if the first weekly chart is the right one.
If the second weekly chart (triangle) is right then it may not be by that much at all.
Either way, down for the next move expected.