Downwards movement was expected for Wednesday’s session, but this is not what happened.
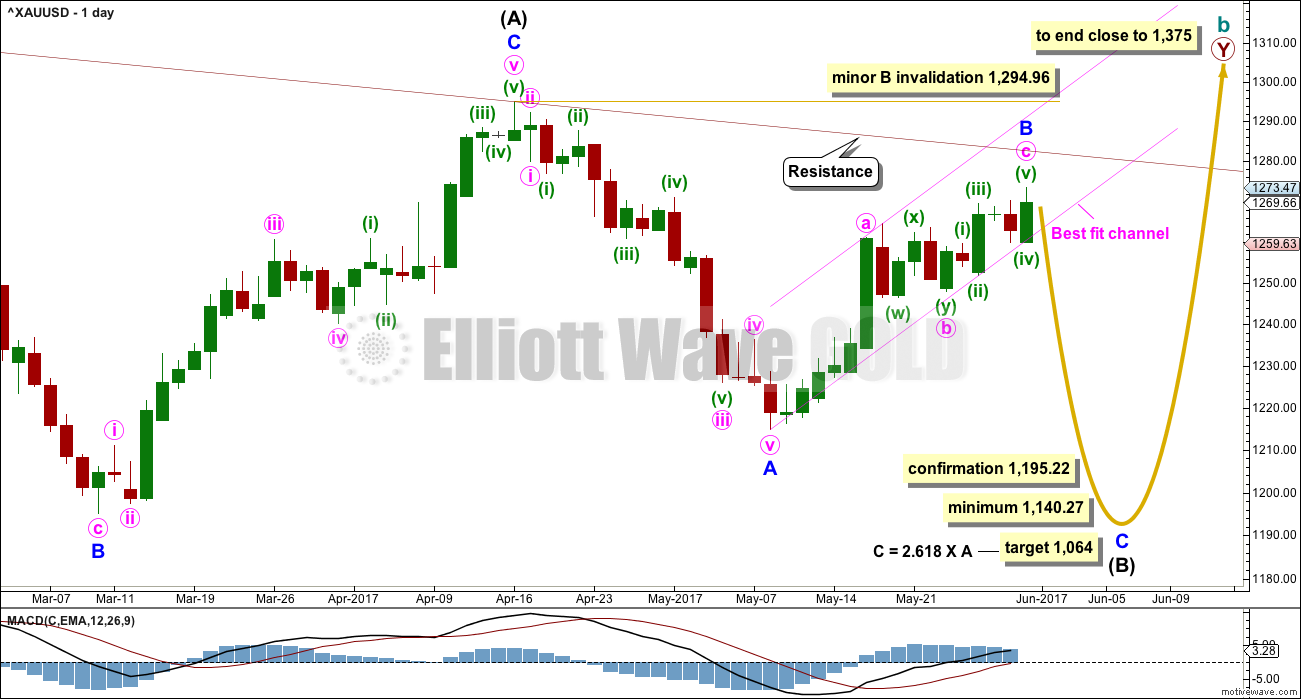
Summary: A high may again be in place here or very soon indeed. When the new channel on the hourly chart is breached, then confidence may be had in this view. The target is now at 1,064 for the first weekly chart, and still 1,157 to 1,149 for the second weekly chart.
New updates to this analysis are in bold.
Last historic analysis with monthly charts is here, video is here.
Grand SuperCycle analysis is here.
MAIN ELLIOTT WAVE COUNT
For clarity I have decided at this time it may be best to publish on a daily basis weekly charts I, II and IV. Both weekly charts I and II expect a zigzag down to complete and the difference is in the expected depth. Weekly chart IV has a very low probability and will only be given serious consideration if price makes a new high above 1,294.96.
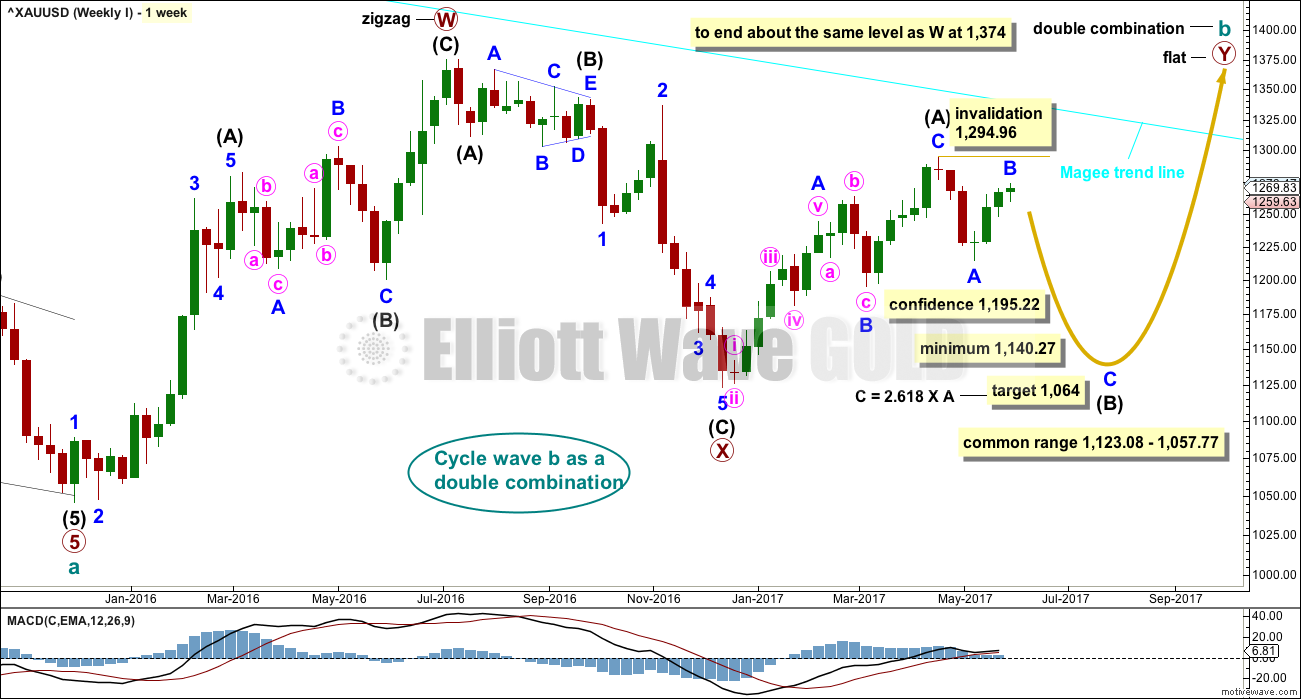
WEEKLY CHART I
Combinations are very common structures. Cycle degree waves normally last one to several years, and B waves do tend to be more time consuming waves than all other waves. Given these tendencies the most likely scenario at this point may be that cycle wave b is an incomplete double combination.
The first structure in the double labelled primary wave W fits as a zigzag. This upwards movement will subdivide as either a three (zigzag) or a five (impulse). It does have a three wave look to it.
The double is joined by a deep three in the opposite direction labelled primary wave X, which is a 0.77 depth of primary wave W. X waves within double combinations are normally very deep; this one looks right.
The second structure in the combination may be either a triangle or a flat correction. Both of these structures have A waves which subdivide as threes.
At this stage, the upwards wave from the low in December 2016 does now look best and subdivide best as a completed zigzag. This may be intermediate wave (A) of a flat correction or a triangle. Because a triangle for primary wave Y would look essentially the same as the second weekly chart below, only a flat correction is considered here. The most common two structures in a double combination are a zigzag and a flat.
This wave count follows the most common scenario and has the best fit.
Within the flat correction of primary wave Y, intermediate wave (B) must retrace a minimum 0.9 length of intermediate wave (A) at 1,140.27. The most common length for intermediate wave (B) is from 1 to 1.38 times the length of intermediate wave (A), giving a common range from 1,123.08 to 1,057.77.
A target is now calculated for minor wave C to complete intermediate wave (B). This target would meet the minimum requirement for intermediate wave (B). Minor wave B has moved higher and the target is recalculated. At 1,064 minor wave C would exhibit a common Fibonacci ratio to minor wave A, and the minimum requirement for intermediate wave (B) would be met.
Intermediate wave (B) may subdivide as any corrective structure, but the most common structure for B waves within flats is a zigzag. At this stage, on the hourly chart it looks like a five down labelled minor wave A is complete, which would indicate intermediate wave (B) is a zigzag subdividing 5-3-5.
The daily and hourly charts will follow this weekly chart. That does not mean the other three weekly charts aren’t possible, they are, but the number of charts must be kept reasonable on a daily basis.
The Magee bear market trend line is added to the weekly charts. This cyan line is drawn from the all time high for Gold on the 6th of September, 2011, to the first major swing high within the following bear market on the 5th of October, 2012. This line should provide strong resistance. If that resistance holds, then the second weekly chart would be correct.
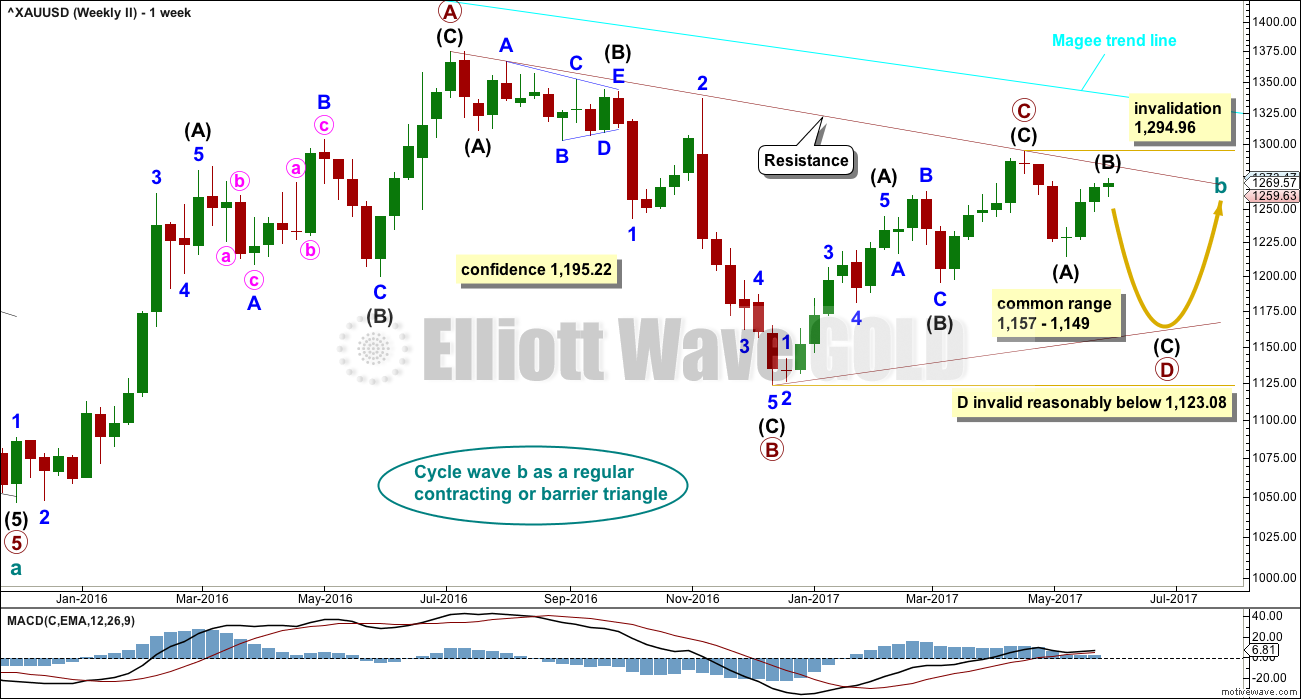
WEEKLY CHART II
What if cycle wave b is a triangle? This is also entirely possible. Triangles are not as common as double combinations, but they are not uncommon.
Within the triangle, primary waves A, B and C are all single zigzags. One of the five subwaves of a triangle normally subdivides as a more complicated multiple, usually a double zigzag. This may be what is unfolding for primary wave D. It may also subdivide as a single zigzag.
Primary wave D of a regular contracting triangle may not move beyond the end of primary wave B below 1,123.08.
Primary wave D of a regular barrier triangle should end about the same level as primary wave B at 1,123.08, so that the B-D trend line is essentially flat. What this means in practice is that primary wave D may end slightly below 1,123.08 and the triangle would remain valid. This is the only Elliott wave rule which is not black and white.
Thereafter, primary wave E should unfold upwards and would most likely fall a little short of the A-C trend line. If not ending there, it may overshoot the A-C trend line. Primary wave E may not move beyond the end of primary wave C above 1,294.96.
Triangles normally adhere very well to their trend lines. Occasionally, price may overshoot the trend lines but when this happens it is not by much and is quickly reversed. The upper A-C trend line should offer very strong resistance at this stage if cycle wave b is unfolding as a triangle. This trend line is added to the daily chart below.
At this stage, the structure on the hourly chart is still the same for both this weekly wave count and the first weekly wave count: a zigzag downwards is unfolding. However, they now diverge in how far down the next wave is expected to go. This second weekly wave count expects a more shallow movement to not end reasonably below 1,123.08.
DAILY CHART
This daily chart will suffice for both weekly charts above, although the labelling follows weekly chart I.
Both weekly charts expect a zigzag downwards. (It may also turn out to be a double zigzag. For now a single only will be charted but a double will be kept in mind). Weekly chart I expects a deep zigzag for intermediate wave (B) to a minimum at 1,140.27. Weekly chart II expects a zigzag down for primary wave D to not move below 1,123.08 and most likely fall well short of that point.
The daily chart follows the expectations for weekly chart I, but the structure for weekly chart II would be exactly the same at this stage.
Within the flat correction of primary wave Y, intermediate wave (B) must retrace a minimum 0.9 length of intermediate wave (A) at 1,140.27. The most likely corrective structures to achieve the deep correction required for B waves within flats are single or multiple zigzags. These begin with a five, then a three in the opposite direction.
Minor wave A is complete. Minor wave B may now be a complete zigzag.
Minor wave B may not move beyond the start of minor wave A above 1,294.96.
MAIN HOURLY CHART
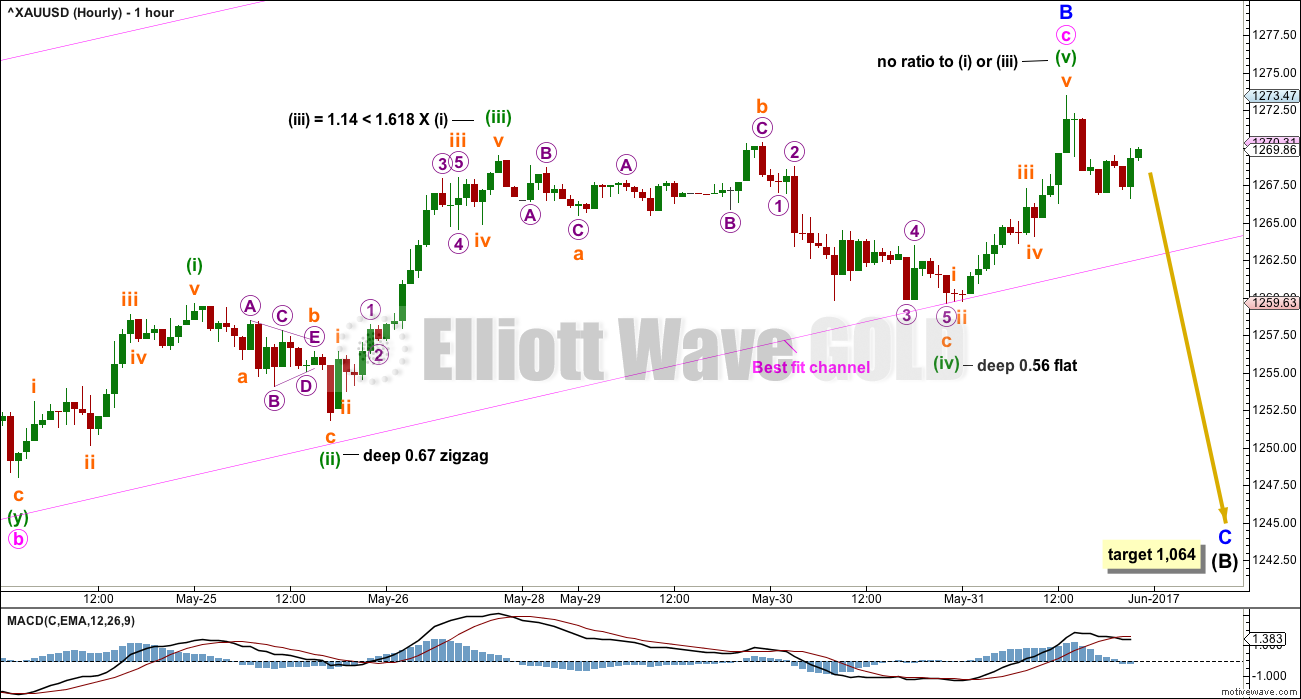
Minute wave b may be a complete double combination. These are very common structures. The most common combination of corrective structures in a double is a zigzag and a flat.
Minute wave c continued higher during Wednesday’s session. Within minute wave c, there is still alternation between minuette waves (ii) and (iv).
The channel about minor wave B is adjusted today to contain all of its movement. When price clearly breaks below the lower edge of this channel, that shall provide some confidence in a possible trend change.
ALTERNATE HOURLY CHART
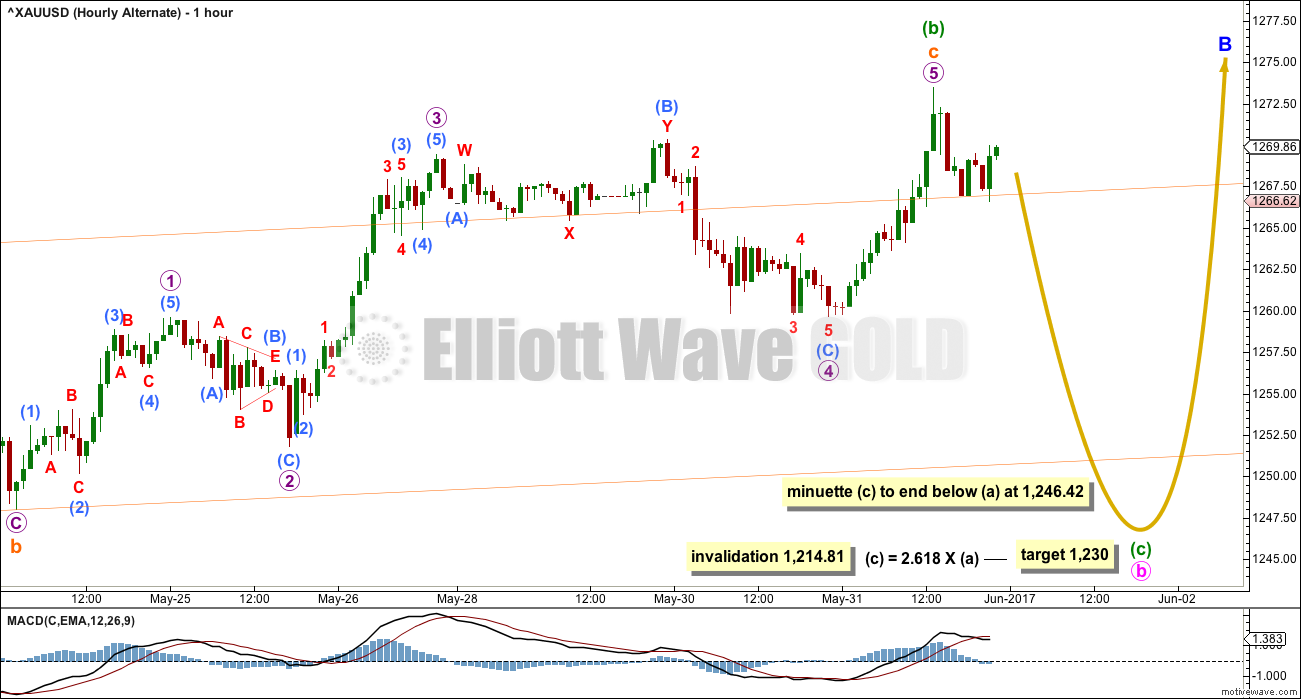
What if a flat correction is still unfolding for minute wave b and minuette wave (b) within it is still incomplete?
Both waves A and B subdivide as threes within minute wave b, as they must for a flat correction.
There is now a problem within this wave count of the regular flat of minuette wave (b). Higher movement during Wednesday’s session now sees subminuette wave c close to 1.618 the length of subminuette wave a; within regular flats, C waves are normally close to even in length with wave A. This reduces the probability of this alternate a little further today because it no longer has the right look.
This wave count allows for further sideways movement in an ever increasing range.
WEEKLY CHART IV
What if the bull market beginning in December 2015 remains intact? Price has essentially been moving sideways since that date, so all possibilities should be considered.
The Morning Doji Star at the low labelled intermediate wave (B) will not be considered as a reversal pattern here because it comes in what is essentially a sideways movement. It does not come after a downwards wave, so there is nothing to reverse.
This wave count requires confirmation above 1,294.96. That would invalidate the first three weekly charts (the third is seen in historic analysis only).
It is possible that cycle wave b is continuing higher as a double zigzag. However, double zigzags normally have brief and shallow X waves. The purpose of the second zigzag in a double (and the third when there is one) is to deepen the correction when price does not move deep enough in the first (or second) zigzag. Thus double (and triple) zigzags normally have a strong and clear slope against the prior trend. To achieve this look their X waves normally are brief and shallow.
In this case, primary wave X is neither brief nor shallow. It is a 0.77 depth of primary wave W and lasted 0.74 the duration of primary wave W. Overall, this does not have a typical look of a double zigzag so far.
This wave count also must see the rise up to the high labelled intermediate wave (A) as a five wave impulse, not a three wave zigzag. This looks a little forced, so it reduces the probability of this wave count.
This wave count should only be used if confirmed with a new high above 1,294.96. Low probability does not mean no probability, but should always be given less weight until proven.
TECHNICAL ANALYSIS
WEEKLY CHART
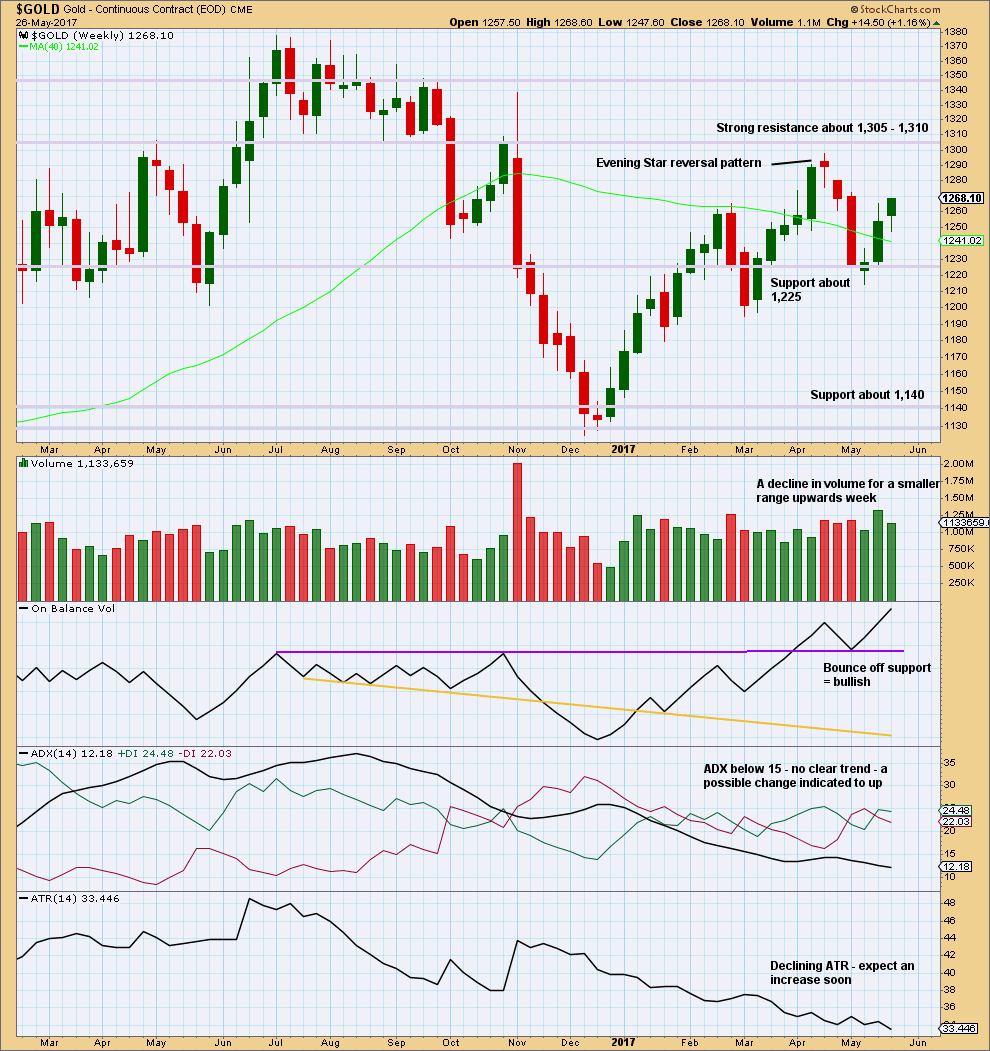
Click chart to enlarge. Chart courtesy of StockCharts.com.
The decline in volume is bearish, but it does not mean upwards movement must stop here. Price can continue higher on declining volume for another few weeks before a trend change as it did in February of this year.
On Balance Volume remains bullish. The long lower wick on this weekly candlestick is bullish.
ATR is bearish.
Overall, this chart is slightly bullish.
DAILY CHART
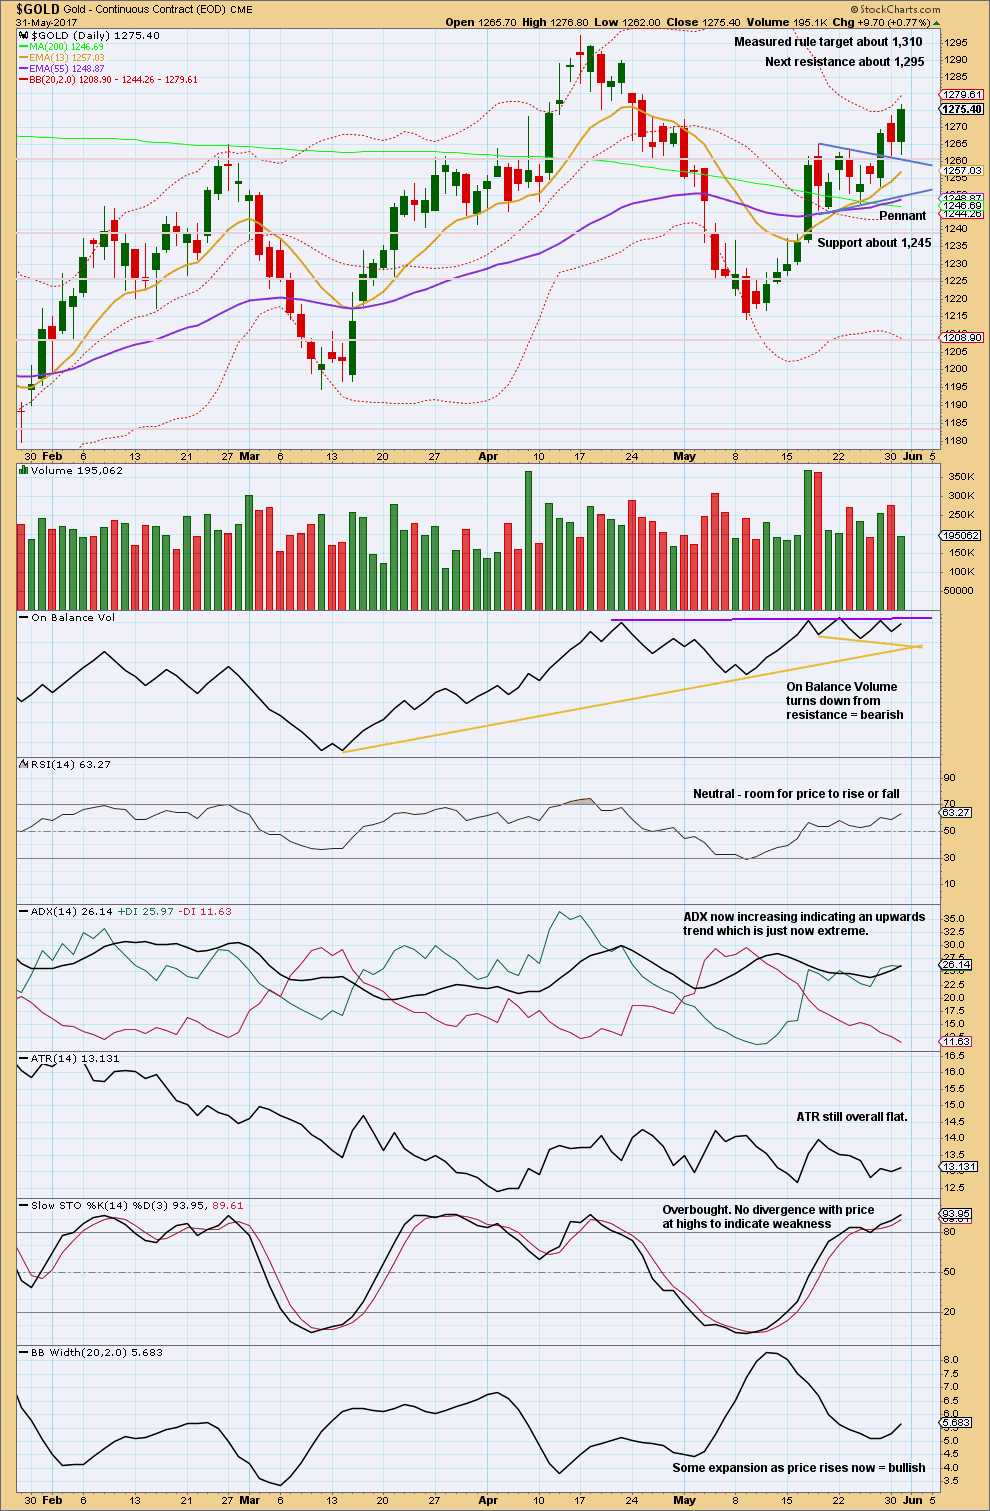
Click chart to enlarge. Chart courtesy of StockCharts.com.
Wednesday’s session moved price higher but with lighter volume. On Balance Volume is very close to resistance. ADX is just now extreme. Together this looks like a high may be in place here or very soon indeed.
Apart from the upwards day of the 17th of May, which looks like a blowoff top, strongest volume is for downwards days. This is bearish.
GDX
DAILY CHART

Click chart to enlarge. Chart courtesy of StockCharts.com.
The weak bearish signal noted yesterday from On Balance Volume was today negated. The yellow support line is redrawn.
A slight increase in volume for today’s outside day, which had a balance of volume upwards, is slightly bullish.
The flag pattern is a continuation pattern and the breakout is expected to be upwards. This is contradicted by the recent volume profile supporting downwards movement over upwards.
On Balance Volume will again be watched carefully. A breakout there may indicate the next direction for price.
This analysis is published @ 11:26 p.m. EST.
[Note: Analysis is public today for promotional purposes. Member comments and discussion will remain private.]


Hourly chart update:
The channel was breached by only one full hourly candlestick below and not touching, which closed as a hammer and price quickly returned to within it.
I’m having difficulty with how the last two waves down subdivide.
I want to see minuette (iv) as a five, and now I want to see the wave to todays low as a three. Will take a closer look on the five min chart.
Anyway, an expanded flat for minute ii may be unfolding right now.
Yikes, is that 1064 by noon tomorrow ? 😉
☝️lol
No. that target is weeks away.
MInor A lasted 16 sessions. If minor B is over at the last high it too lasted 16 sessions.
If minor C = 2.618 X minor A then it is likely to be longer in duration as well as length.
Lara. In the chart, Minuette B is 2.618 times Minuette A. Is that a concern?
Yes, it is. I wondered if anyone would comment on that.
That’s how I labelled it at first glance. But I’ve spent some time on the 5 minute chart and the downwards movement for this session will fit very nicely as a competed five.
It just doesn’t look good on the hourly chart because the fourth wave is towards the end and very short and brief.
With options expiration tomorrow who knows where gold will end the day. A few things of worry
1. Gold stocks underperforming
2 .commercials were net short last week for the week, with gold between 1235 and 1260(approximately) . What they do this week(reported Friday at 330 on cftc.gov) will give further clues as gold was around 1260 to 1275
3. June is bad month for gold
4. Gold overbought in stochastics.
5. Lara’s charts
Positive
1) world crisis, Syria, isis, North Korea, trump investigation
2) printing money ponzi style
3). Gold is finite
Etc.
Looks like for Friday’s trade it is down to for a break below 1253 or a break above 1273….. Imo unlikely to see Gold price break below 1257-56 although a pullback for both Gold & Silver looks to be on the cards…. Lets see how this goes. GL!
Looks like price heading up to test underside of broken channel…
Now gold is above the channel line and inside the flag.
Repost
Hi Alan
Have you heard of Ski report by Jeff Kern?
He is retired mathematician. Instead of describing his theory on gold price average I would point you to his blog.
His theory similar to cloud. Trend prediction sole based on mechanical system of price averages.
Weekend home work?
http://www.321gold.com/editorials/kern/current.html
Papudi. Thanks for the link.
Jeff has an interesting concept. Although the report is extremely scanty with details, I can see where he is coming from. As an example, consider the closing prices of any 5 consecutive days. Each closing price can be up or down from the previous day, ignoring the insignificant “no change in price”. Let’s say up = 1, down = 0. He’s working with the probability of say 11010, 10110, 00101 etc, a total of 3125 possibilities.
In normal everyday events, the occurrence of one outcome on one day would not affect that of the next day. Mathematically, this is called mutual independence of events. The roll of a dice is an example. But, in the stock market, there is some correlation between today’s closing price and tomorrow’s, be it waves or cycles. The probabilities have to be worked out using the statistics of mutually dependent events. The trick is to assign a probability function to the relationship. I’m sure Jeff’s team would have gone through millions of such 5-day prices to determine the frequency of each of the 3125 possibilities happening. That’s why he can sell his program. But, the accuracy is only as good as the range and extent of his dataset.
Aside: If only the prediction of his work could be applied to the roulette table. Wonderful isn’t it? Then we can all quit trading.
Alan/Lara/Dreamer
On Weekly chart there is Magee trend line. Which two price points are used to draw this resistance line?
Papudi. In today’s report, Lara wrote “The Magee bear market trend line is added to the weekly charts. This cyan line is drawn from the all time high for Gold on the 6th of September, 2011, to the first major swing high within the following bear market on the 5th of October, 2012.”
Thanks. I should have read carefully.
Hi Alan
Have you heard of Ski report by Jeff Kern?
He is retired mathematician. Instead of describing his theory on gold price average I would point you to his blog.
His theory similar to cloud. Trend prediction sole based on mechanical system of price averages.
Weekend home work?
http://www.321gold.com/editorials/kern/current.html
Ichimoku Gold Daily Analysis
Data as at 6:30 am ET June 1
========================
Gold markets initially fell on Wednesday, but found a significant amount of support at the 1260 level. The market then bounced towards the 1268-1270 level, an area of significant resistance, where we pulled back slightly at the close of the trading day. The gold market attempted to break through the 1270 level on Tuesday, and it did slightly better yesterday. The question is: would there be a third time lucky? We can see that 1270 is a formidable resistance, difficult to break above, but if we do, that would be very bullish and should send the market looking to test the high at 1294.96. That is the premise of Weekly IV.
On the daily chart level, gold prices had (almost) reached the top cloud boundary resistance, got rejected, and is pulling back down. Price remains above both the tenkan-sen and the kijun-sen. The tenkan-sen lies above the kijun-sen on a bullish crossover four days ago. The trend is still bullish. Price could still grind higher slowly in a third attempt at the top cloud boundary but, at the moment, I would expect price to first pull back towards 1256 which is the 61.8% retrace for the last big move from 1195.22 (March 10) to 1294.96 (April 17). If that fails to hold, then a test of the lower cloud boundary at 1245.30 is in play. Incidentally, this coincides with the 50% retrace at 1245.09. I do not envisage price dropping below those levels, at least not for today. At the same time, if prices do rebound strongly from these levels, then a strong case can be made for the bulls.
The big drop scenario is predicated upon the head-and-shoulders formation. In that hypothesis, gold is currently forming the right shoulder near 1270. The neckline is an upward sloping trend line near 1225. A break of this could lead to a drop on higher volume. This formation becomes invalid should prices rise above the April high of 1294.96, its head.
I feel the jury is still out regarding which of the two scenarios, the bear or the bull, will eventuate. I think that we may have to wait until Friday’s US Non-Farm Payrolls report before the picture becomes somewhat clearer.
I am trying to circumvent the website problem by posting the chart as a reply.
Folks, I posted the Ichimoku analysis at 6:30 am ET but due to a glitch (can be at my end or the website’s), it failed to load. I tried reloading but the message “duplicate” kept on appearing. You might have to wait until the system resets, or Lara intervenes from her end, before I can load that again. This problem happens fairly often in the past few days.
Did you try to post then edit your comment with the uploaded chart? Whenever I do that it puts the comment (and image) into moderation.
No. I just uploaded and then nothing happened. I will see if it occurs again. So far, the workaround helped. So, don’t worry about this.
Okay. If you or any other member experience a problem again with uploading charts here in comments, please take a screenshot of the problem / error message and send to Cesar:
webmaster@elliottwavegold.com
with a brief description of the problem, and then he can try to fix it.
It’s beyond my technical abilities 🙂
Lara, would there be any benefit to looking at Gold volatility in your analysis?
Possibly.
Volatility doesn’t have a reliable negative correlation, but when it shows a very short term day on day divergence it can be helpful in picking a low or high.
A measure of breadth would be helpful too I think. I’m thinking a measure of how many regions fall or rise, for the global gold market. But I don’t think such a data set exists.
So, I’ve taken a closer look at $GVX and $GOLD.
I just don’t think this is going to be of any assistance at all.
The correlation is completely unreliable. Gold price appears to possibly turn before volatility, and so as a predictor for price that’s useless.
I’ll keep an eye on it, but I don’t think it’s going to add anything but confusion to the analysis if I include it.
OK. Thanks for checking it out!
Now that May month trading is over time to update Gold’s monthly chart.
Last month gold has bullish hammer with long tail.
Still the huge resistance line above it. So far it last few months have green /white candles.
Papudi, unless the numbering are not EW counts, there seems to be something amiss. Shouldn’t the blue 3 be where the orange 5 is? If so, the expanding diagonal no longer holds.
Also, if the structure comes to fruition, the ED ends below 650, a very sobering thought.
I should have mentioned the numbers are NOT EW waves. These numbers represent reversal points in a consolidation wedge as per Rambus chart Chartology.
.
Cheers.
I am only apprehensive that the final low is going to be very low. In practice, it may not happen as gold miners have a threshold price below which it becomes infeasible to operate. Then, supply and demand dictates that gold price would go up.