
The target, which has not been met, remains the same.
Summary: The target is still 1,214. If this is wrong, it may be too low because price is at strong support and On Balance Volume is at support at the weekly and daily chart levels. Look out for a bounce to begin soon.
New updates to this analysis are in bold.
Last historic analysis with monthly charts is here, video is here.
Grand SuperCycle analysis is here.
MAIN ELLIOTT WAVE COUNT
For clarity I have decided at this time it may be best to publish on a daily basis weekly charts I and II. Both charts expect a zigzag down to complete and the difference is in the expected depth.
WEEKLY CHART I
Click chart to enlarge.
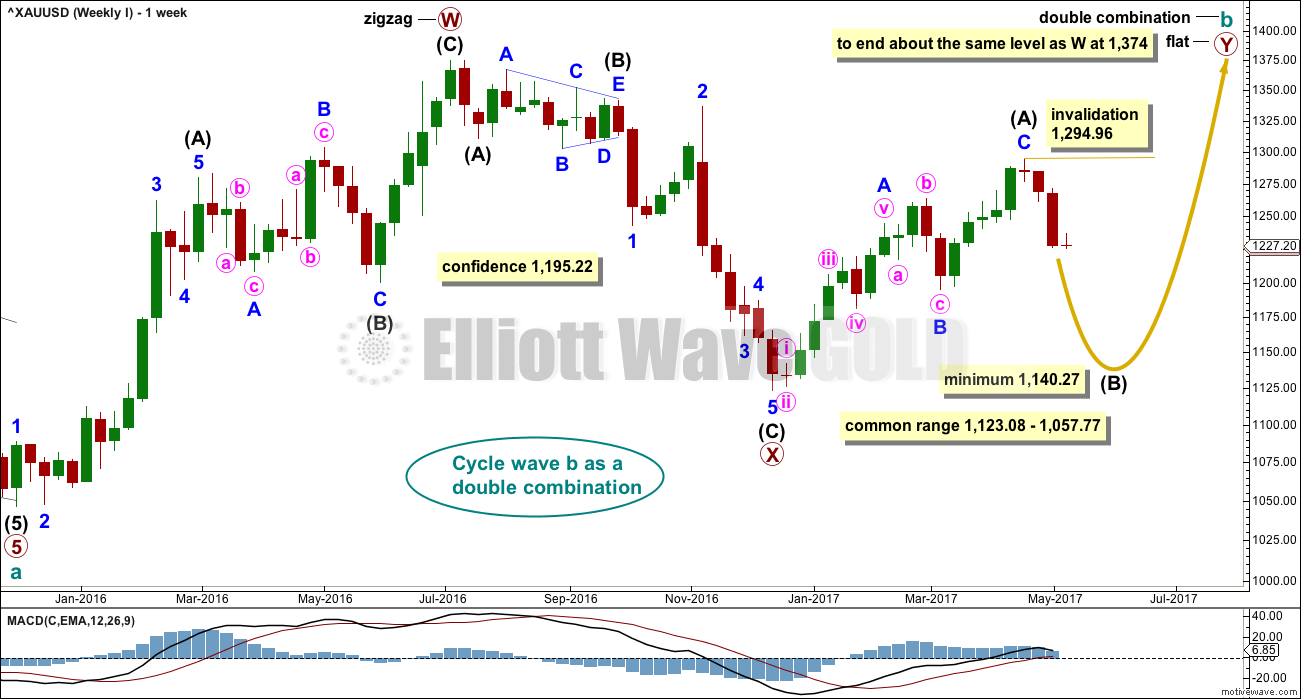
Combinations are very common structures. Cycle degree waves normally last one to several years, and B waves do tend to be more time consuming waves than all other waves. Given these tendencies the most likely scenario at this point may be that cycle wave b is an incomplete double combination.
The first structure in the double labelled primary wave W fits as a zigzag. This upwards movement will subdivide as either a three (zigzag) or a five (impulse). It does have a three wave look to it.
The double is joined by a deep three in the opposite direction labelled primary wave X, which is a 0.77 depth of primary wave W. X waves within double combinations are normally very deep; this one looks right.
The second structure in the combination may be either a triangle or a flat correction. Both of these structure have A waves which subdivide as threes.
At this stage, the upwards wave from the low in December 2016 does now look best and subdivide best as a completed zigzag. This may be intermediate wave (A) of a flat correction or a triangle. Because a triangle for primary wave Y would look essentially the same as the second weekly chart below, only a flat correction is considered here. The most common two structures in a double combination are a zigzag and a flat.
This wave count follows the most common scenario and has the best fit.
Within the flat correction of primary wave Y, intermediate wave (B) must retrace a minimum 0.9 length of intermediate wave (A) at 1,140.27. The most common length for intermediate wave (B) is from 1 to 1.38 times the length of intermediate wave (A), giving a common range from 1,123.08 to 1,057.77.
Intermediate wave (B) may subdivide as any corrective structure, but the most common structure for B waves within flats is a zigzag. At this stage, on the hourly chart it looks like a five down is almost complete, which would indicate intermediate wave (B) is a zigzag subdividing 5-3-5.
The daily and hourly charts will follow this weekly chart. That does not mean the other two weekly charts aren’t possible, they are, but the number of charts must be kept reasonable on a daily basis.
WEEKLY CHART II
Click chart to enlarge.
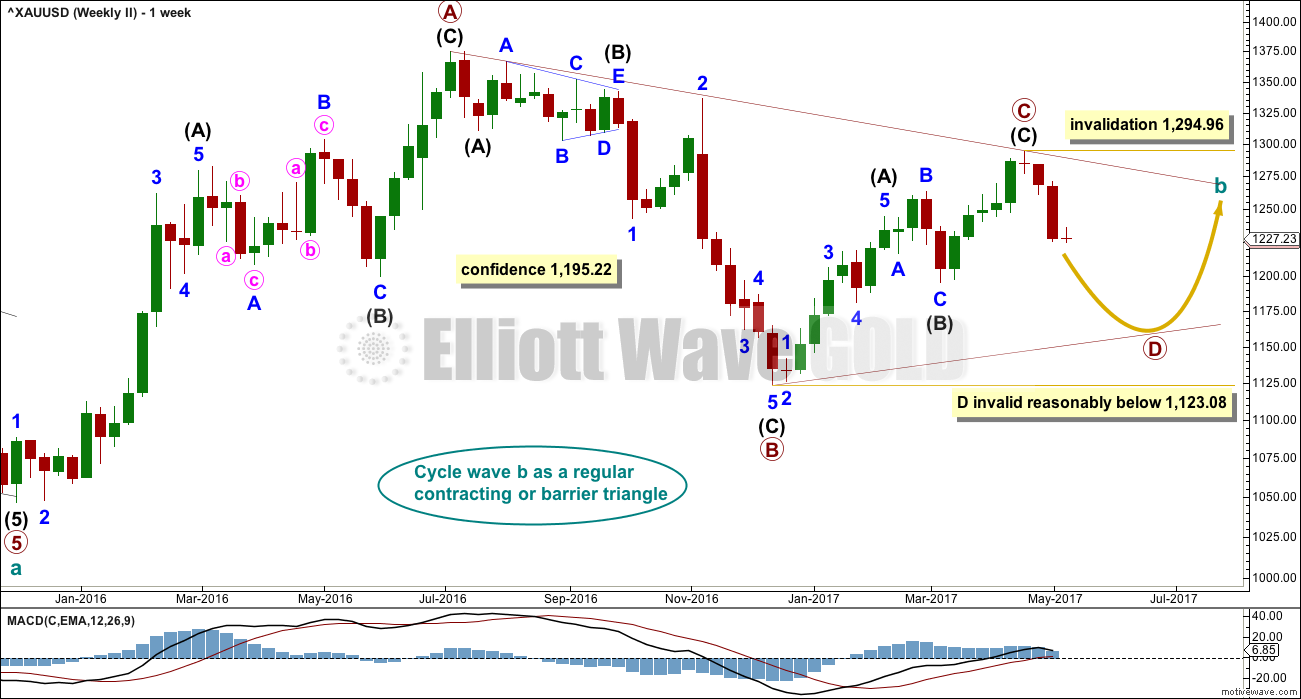
What if cycle wave b is a triangle? This is also entirely possible. Triangles are not as common as double combinations, but they are not uncommon. This wave count will be followed but not published daily. If it begins to diverge from the first weekly chart, then it will be published daily.
Within the triangle, primary waves A, B and C are all single zigzags. One of the five subwaves of a triangle normally subdivides as a more complicated multiple, usually a double zigzag. This may be what is unfolding for primary wave D.
Primary wave D of a regular contracting triangle may not move beyond the end of primary wave B below 1,123.08.
Primary wave D of a regular barrier triangle should end about the same level as primary wave B at 1,123.08, so that the B-D trend line is essentially flat. What this means in practice is that primary wave D may end slightly below 1,123.08 and the triangle would remain valid. This is the only Elliott wave rule which is not black and white.
Thereafter, primary wave E should unfold upwards and would most likely fall a little short of the A-C trend line. If not ending there, it may overshoot the A-C trend line.
DAILY CHART
Click chart to enlarge.
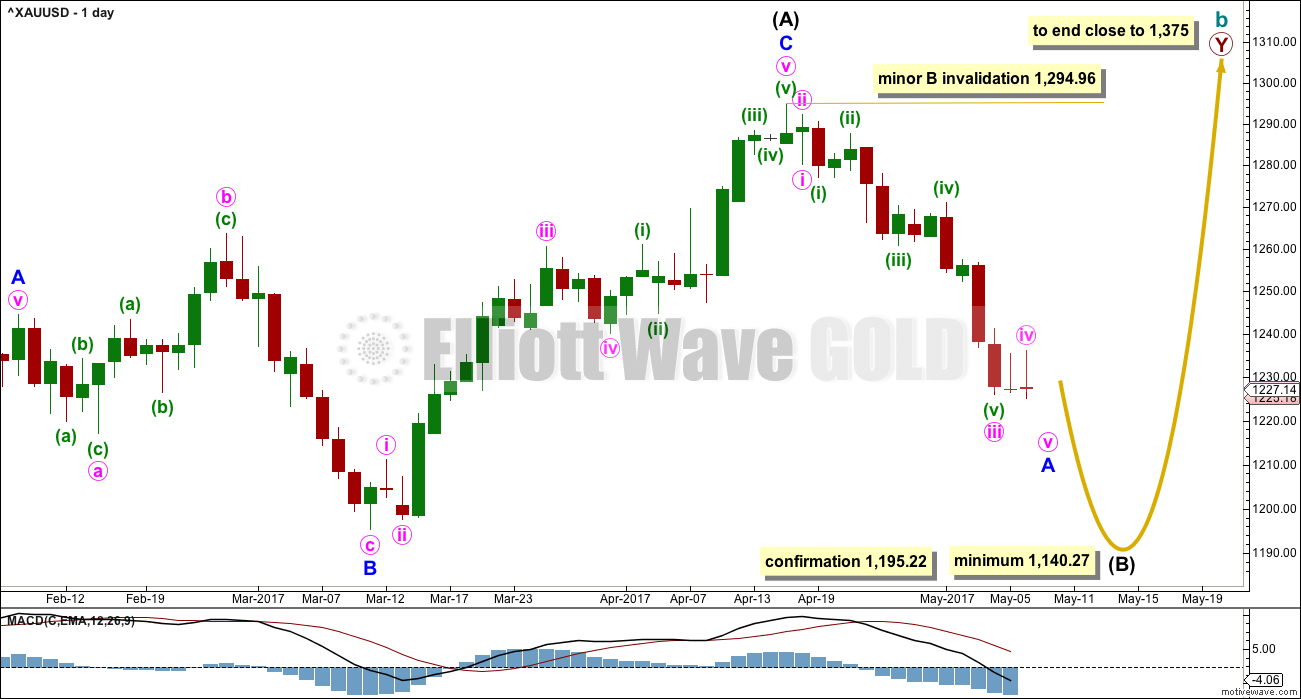
This daily chart will suffice for both weekly charts above, although the labelling follows weekly chart I.
Both weekly charts expect a zigzag downwards. Weekly chart I expects a deep zigzag for intermediate wave (B) to a minimum at 1,140.27. Weekly chart II expects a zigzag down for primary wave D to not move below 1,123.08 and most likely fall well short of that point.
The daily chart follows the expectations for weekly chart I, but the structure for weekly chart II would be exactly the same.
Within the flat correction of primary wave Y, intermediate wave (B) must retrace a minimum 0.9 length of intermediate wave (A) at 1,140.27. The most likely corrective structures to achieve the deep correction required for B waves within flats are single or multiple zigzags. These begin with a five, then a three in the opposite direction. So far a five down looks close to completion; when complete, it should then be followed by a three up.
Minor wave B, when it arrives, may be deep but may not move beyond the start of minor wave A above 1,294.96.
When minor wave A is complete and is confirmed so by a breach of the channel on the hourly chart, then the 0.382 and 0.618 Fibonacci ratios will be used as targets for minor wave B. Neither target can be favoured because B waves exhibit the greatest variety in form and behaviour; they may be shallow or very deep.
When minor waves A and B are complete, then a target may be calculated for minor wave C downwards to end the zigzag of intermediate wave (B), using the Fibonacci ratio between minor waves A and C. That cannot be done yet.
2 HOURLY CHART
Click chart to enlarge.
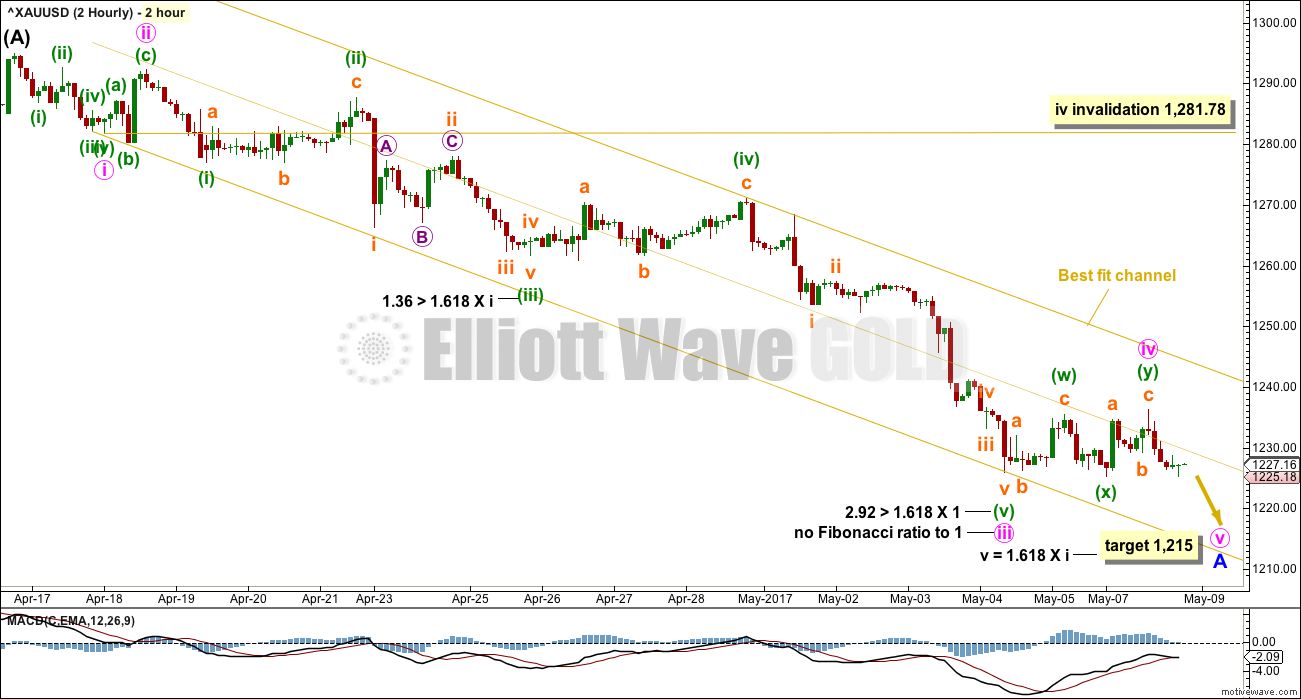
This downwards movement so far looks very much like an impulse. Fibonacci ratios at minute and minuette degrees are noted.
The best fit channel is very important. Add a mid line. Expect price to continue down while price remains within the lower half. When price breaks into the upper half, it would most likely be the end of minor wave A and the start of minor wave B. A breach of the upper edge of the channel would provide strong indication that minor wave A is over.
Minute wave iv may not move into minute wave i price territory above 1,282.01. However, Gold’s fourth waves are typically very shallow; minute wave iv is not expected to get anywhere near the invalidation point.
HOURLY CHART
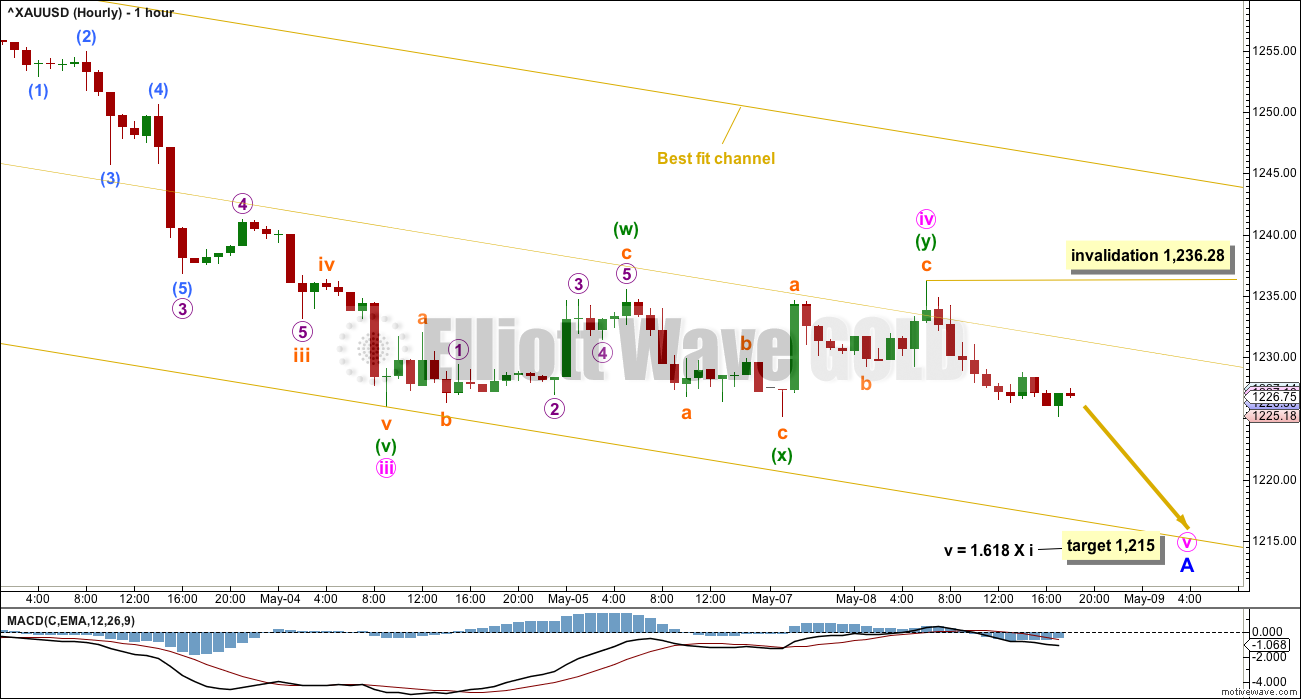
Click chart to enlarge.
This hourly chart shows more detail of the end of minute wave iii.
Sideways movement to begin the new week has remained within the lower half of the best fit channel. This looks like a continuation of minute wave iv as a combination. The target for minute wave v is slightly recalculated.
After a new low minute wave v may be over. That would complete the impulse for minor wave A.
When price breaks into the upper half of the best fit channel, that would be the earliest indication that minor wave A is most likely over and minor wave B has most likely begun. Considerable confidence may be had if price breaks above the upper edge of the channel.
At that stage, draw a Fibonacci retracement along the length of minor wave A. Use the 0.382 and 0.618 Fibonacci ratios as targets for minor wave B, favouring neither.
Minor wave B should last at least one week. It may be a quick sharp zigzag, or a more time consuming complicated combination or triangle. B waves exhibit the greatest variety in form and behaviour. They normally do not offer good trading opportunities, but a movement at minor degree may. If trying to trade this upcoming B wave upwards, members are advised to reduce the % of equity exposed and to be diligent about managing risk.
TECHNICAL ANALYSIS
WEEKLY CHART
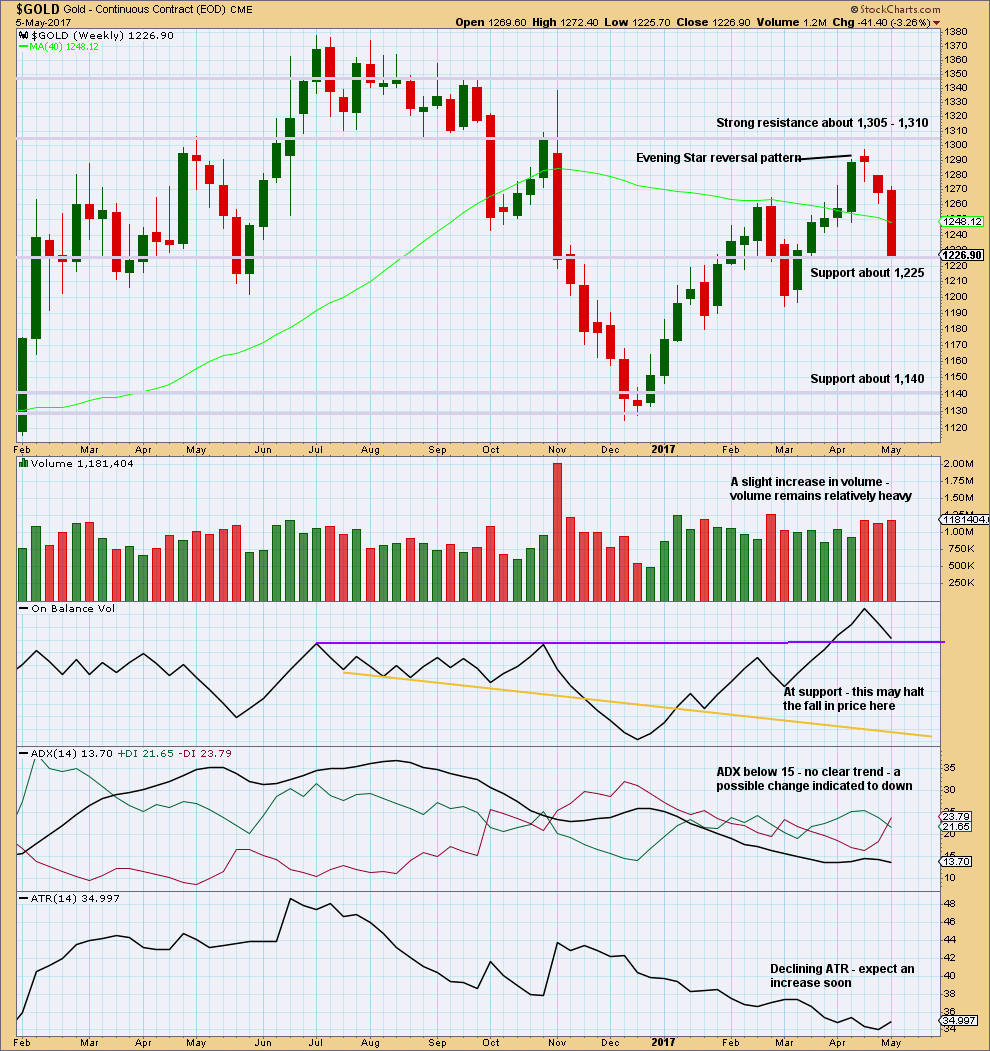
Click chart to enlarge. Chart courtesy of StockCharts.com.
This weekly chart now looks bearish. Volume is bearish. The strong weekly candlestick looks very bearish.
Support for price and On Balance Volume may halt the fall in price temporarily, a bounce about here looks like a very reasonable expectation.
DAILY CHART
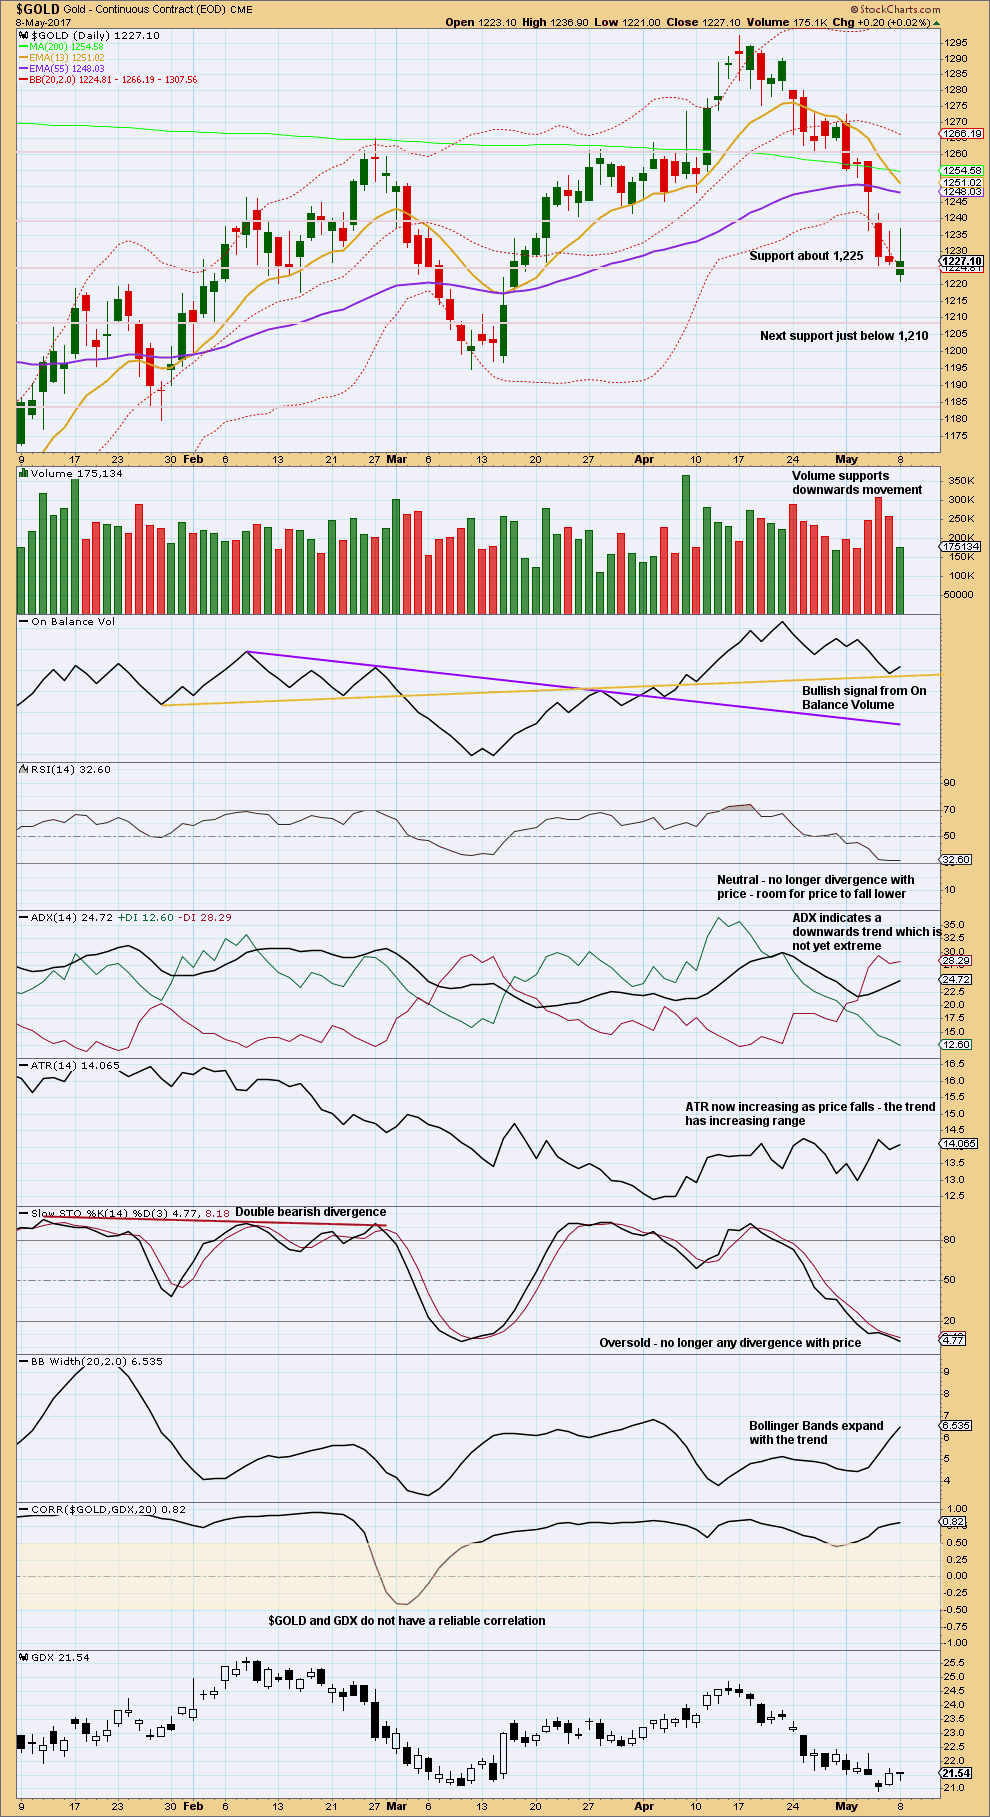
Click chart to enlarge. Chart courtesy of StockCharts.com.
The long upper wicks on the last two daily candlesticks are bearish. Volume remains bearish and the balance of upwards day today was not supported by volume.
In the short term, On Balance Volume is offering support. If price falls for the next day here, it may not be by very much.
Because ADX is not extreme and RSI is not oversold, there is room for this downwards trend to continue. A bounce here may be indicated by On Balance Volume.
GDX
DAILY CHART
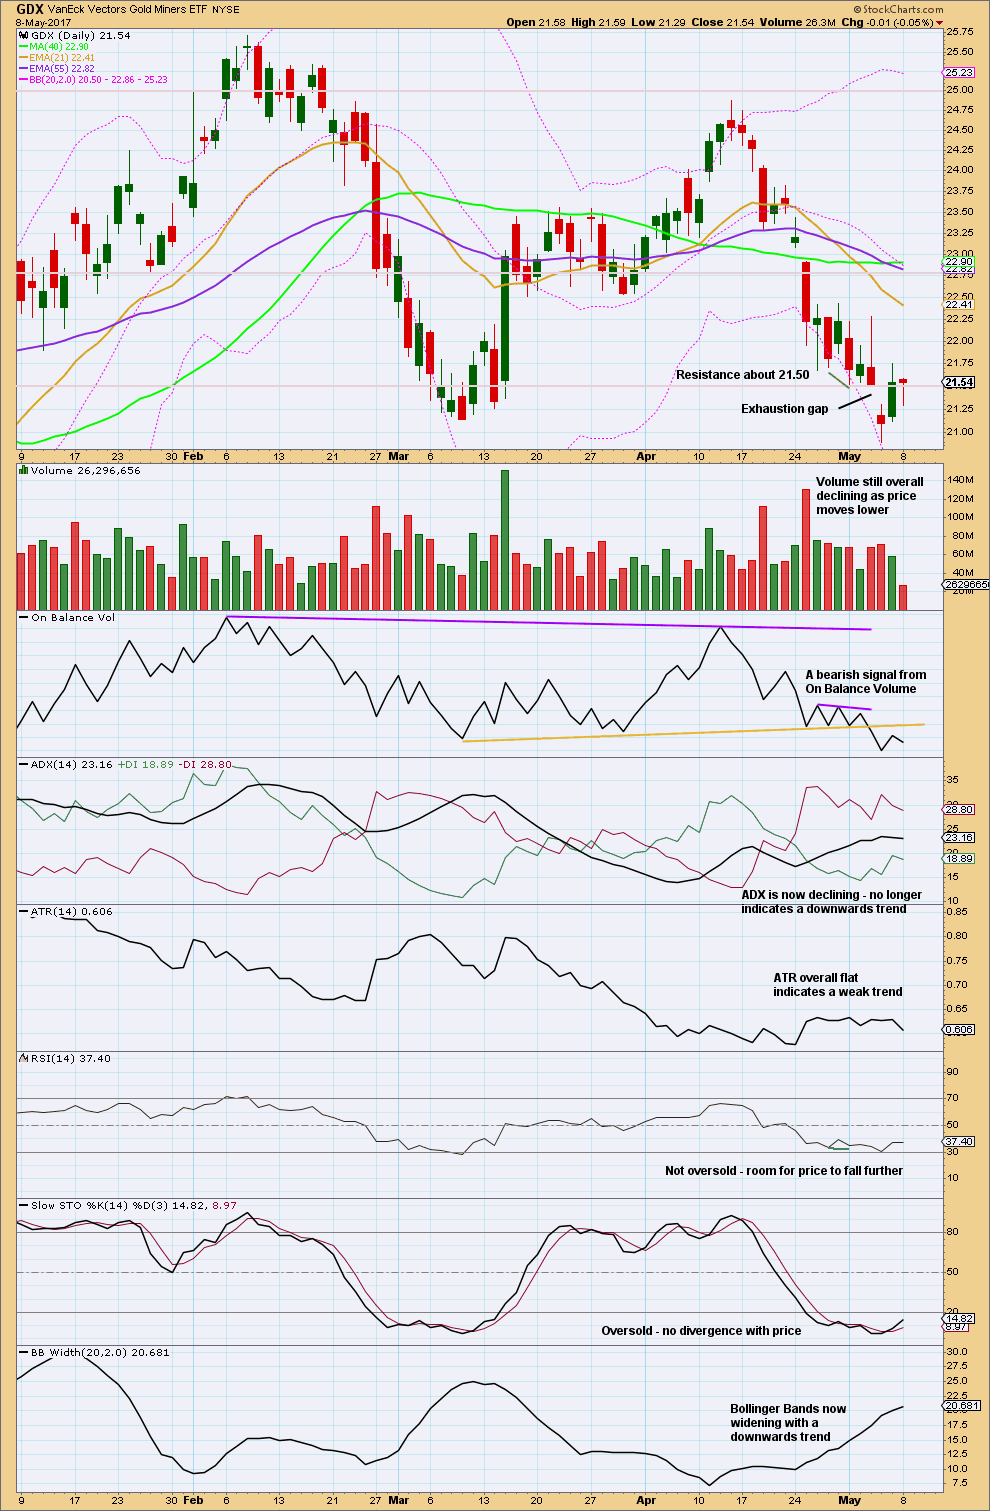
Click chart to enlarge. Chart courtesy of StockCharts.com.
Resistance about 21.50 may be giving way. Next resistance is about 22.75. On Balance Volume may also offer resistance, halting a rise in price and preventing any bounce from being very deep.
ADX and ATR now indicate a consolidation may be underway for GDX.
This analysis is published @ 07:38 p.m. EST.
Is that a hammer, I see, on GLD? 🙂
The report that North Korea is proceeding with its 6th nuclear test had caused some market jitters. S&P dropped somewhat and gold had a small spike. That spike helped to accelerate minuette 4.
Before I read comments below, here’s an updated 2 hourly chart.
Minute v has an incomplete structure. The fourth and fifth wave for minuette (iv) and (v) need to complete.
The target at 1,214 is met but the structure is incomplete so I’m calculating a new target.
One more downwards day?
Alan
If you look at the 4 hour chart with cloud gold dropped below the green cloud. That was the warning!!! Ever since gold has drifted lower and lower.
I still can not save chart from PMbull. AND tradingview does not have cloud.
On my computer when I chart cloud in PMBull it does not automatically chart in Tradingview platform.
Testing. I cannot upload a post just now. 404 error.
I had that problem yesterday too Alan. I restarted my laptop and it worked….
If anyone else is having that problem let me know. I’ll ask Cesar to look into it.
OK, it now works. I just can’t upload a picture.
Papudi. You can’t copy the graph direct from either pmbull or TradingView. I do a screen capture, and open it up in a MS Word file. Then right click and “save as picture”. It will save the image as a .png file on your computer.
To get from pmbull to TradingView for Ichimoku chart, on the pmbull chart, look for the “indicator” symbol. This looks like a bar graph with a squiggly line on top. It is immediately to the right of the time bar selection, and left of the scales icon. Click on the “indicator” symbol. Select “Ichimoku Cloud”. It will draw the graph on the TradingView platform.
Hope this helps.
It should now be obvious that gold price has dropped below the cloud support on the daily and 1-hourly level. From EW count, it is on its way to one of the lows I mentioned.
My upmove count would occur once this Minor A ends.
Just a quick thank you to you for your time, effort, and knowledge!
Thanks Stephen for your kind compliments.
Thank you very much Allan. Your presentation and analysis is a great asset here! Cant see Gold price back up above 1225 for 1233 now. Lets see. Imo there is not much by way of support all the way down to 1180 (given enough time).
Thanks Syed.
You are right. Price is headed for the ending of Minor A. The upmove should occur just after Minor A is completed. Like I said the 1235 area has a resistance cluster. Once that is taken out, then price has to negotiate 1245, followed by 1250.
Gold analysis:
https://www.edelsoninstitute.com/gold-silver/bloodbath-precious-metals-miners/?sc=WAV-E
Ichimoku 4-Hourly Analysis — data as at 6:46 am today
==============================================
As we saw in the daily chart, gold price is trading around the 1222 – 1224 cloud support and the downside is limited currently. At the 1-hour timeframe (not shown), gold is just below the cloud trying to gain access into it.
This impasse has to be broken one way or the other. If the price breaks the bottom of the cloud, then the move downwards will gain some momentum. The probable stops will be:
(1) 1218.76, which is 23.6% of the range 1195.22 to 1294.96;
(2) 1214 – 1215, as Lara calculated using EW analysis; or
(3) 1209.78, which is 14.6% of the range 1195.22 to 1294.96.
For Minor A, I do not expect any lower than these.
But what if Minor A completed at today’s low of 1224.19?
Then, prices will be seen entering the cloud at the 1-hour timeframe. For further progress upwards, the 4-hour chart gives a better picture.
The bottom of the cloud is at 1249.93 and this will prove to be strong resistance. You see, the cloud boundary, being support/resistance, behaves the same way. A previous support now becomes resistance. This could be where Minor B ends, where price is rejected by the cloud. (This will then trigger a downward move towards 1180, which is our Minor C).
The move upwards, Minor B, would be triggered by a positive crossover: the blue tenkan-sen must move from below and cross above the red kijun-sen. Then, first resistance will be a cluster at 1235 – 1237, followed by 1245.09 (the 50% range).
In summary, I will be watching two things today:
(1) A drop below the 1-hour cloud boundary at 1222-1224 will signify a continuation towards one of three supports mentioned above.
(2) A crossover of the tenkan and kijun lines in the 4-hour timeframe will trigger a move towards cloud support at 1249.93.
Happy trading.
Hi Alan
On my computer PmBull shows 4 hour candle as long wick hammer in contrast your post above which shows a full green candle.
How that can be??? UHHH
Hi Papudi.
This is the problem with different data feeds.
I have often seen price spikes on some platforms but absent in BarChart.
As Lara said, as long as we stick to one platform for all our analyses, we should be consistent.
Alan Nice analysis using cloud.
Yesterday gold put in inverted hammer a reversal candle after a sustain decline.
This pauses the decline. After brief consolidation will see if gold will resume up or down sentiment.
Los with low volume and closed in the trading range also indicates a pause here.
Still of the opinion that high volume high of Nov at 1337 needs to be tested with low volume.
Thanks Papudi for the compliment.
The hourly analysis, just posted, discusses the possible movements in detail, something along the lines to what you described.
Ichimoku Daily Analysis — data as at the close of May 8
==============================================
There is not much change at the daily level.
Gold price held support at the lower cloud boundary. Price however remains inside the cloud and the daily trend is still neutral.
Bulls need a break above the top of the cloud at 1253.05 to have some fighting chance.
The worst that could happen is a break below the last support at the lower cloud boundary. If that happens, the trend line support is the next stop.
Zooming back out to the Weekly level for GDX, this chart represents 3 possible Combinations for Supercycle wave (b). The depth of the current correction will help us determine if one of these options is likely. Price points for validation are on the chart.
There are, of course, other options such as a triangle, or that Supercycle wave (b) is already complete, that will be explored if they start to look more probable.
https://www.tradingview.com/x/bBw1Tmya/
Nice chart!
Thanks for posting.
R your wave notations consistent with Lara’s notations?
For example (a) and (b) consider to be super cycle waves a and b???
Yes, matches her last full GDX analysis
Lara,
I’ve been thinking about your triangle option for gold. What if a triangle does form, albeit in the X wave position of a combination? This would still allow for an upwards breakout, along with a breach of the Bear Market trendline. I’m thinking that a Cycle wave B would be likely to breach the bear market trendline, no? Thoughts?
https://www.tradingview.com/x/r5jFEJFJ/
Yes, that too is entirely possible.
At this time I don’t think it looks as good as the triangle for cycle b though. If it starts to look better I’ll publish it.
Just now watching one of Chris Ciovacco’s videos and I’d like to highlight this bit for members.
From 10:00 to 12:00 some very important tips for traders.
https://youtu.be/896xQ5qvBlc
Thanks Lara!
Copper looks to be starting next leg down.
Global X Copper Miners ETF (COPX) just broke and retested neckline of a clear H&S
pattern. Should be smooth downside sailing mateys! 🙂
(Also reloading June JJC 30 strike puts.)
Tips from the video:
Yes, yes, no, yes, yes, yes, no, yes.