
The target at 1,214 was met. However, the Elliott wave structure is incomplete with conditions entering oversold and On Balance Volume again at support.
Summary: The target is now at 1,202. If price makes a new high short term above 1,225.18, then the probability that a low is in place and a bounce has begun will increase. However, reasonable confidence in a bounce may only be had if price breaks above the upper edge of the best fit channel on the hourly charts.
New updates to this analysis are in bold.
Last historic analysis with monthly charts is here, video is here.
Grand SuperCycle analysis is here.
MAIN ELLIOTT WAVE COUNT
For clarity I have decided at this time it may be best to publish on a daily basis weekly charts I and II. Both charts expect a zigzag down to complete and the difference is in the expected depth.
WEEKLY CHART I
Click chart to enlarge.
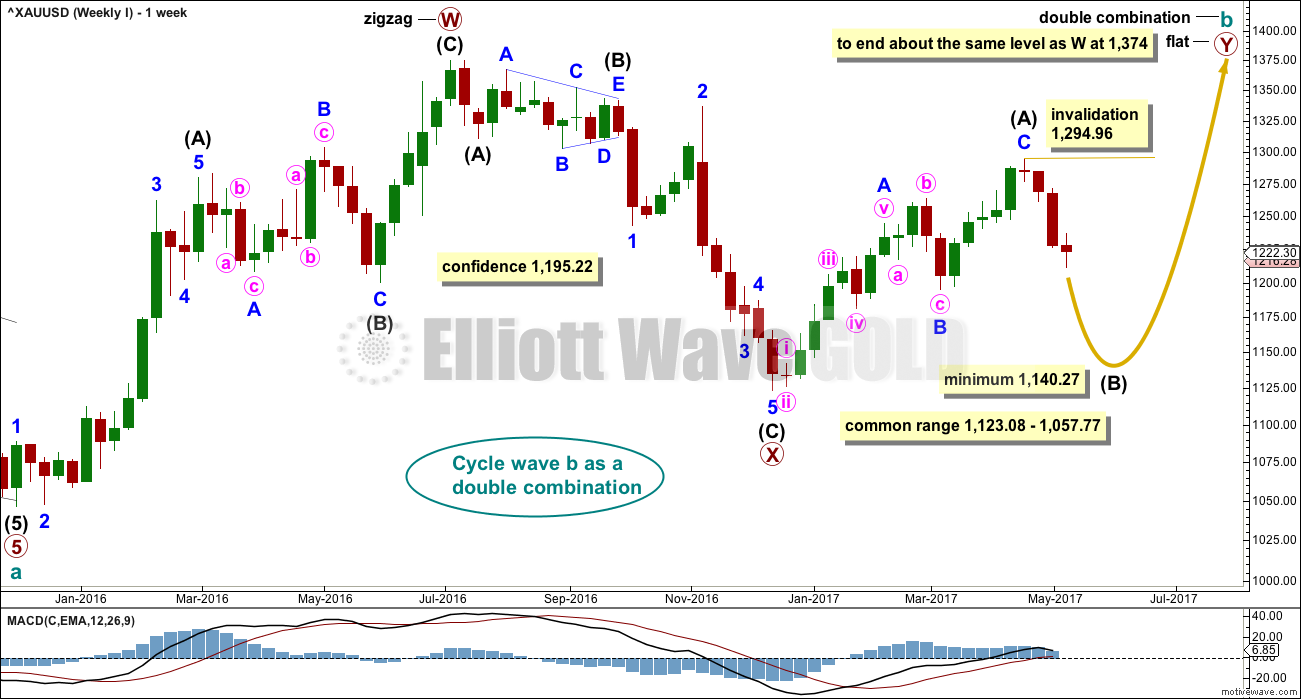
Combinations are very common structures. Cycle degree waves normally last one to several years, and B waves do tend to be more time consuming waves than all other waves. Given these tendencies the most likely scenario at this point may be that cycle wave b is an incomplete double combination.
The first structure in the double labelled primary wave W fits as a zigzag. This upwards movement will subdivide as either a three (zigzag) or a five (impulse). It does have a three wave look to it.
The double is joined by a deep three in the opposite direction labelled primary wave X, which is a 0.77 depth of primary wave W. X waves within double combinations are normally very deep; this one looks right.
The second structure in the combination may be either a triangle or a flat correction. Both of these structures have A waves which subdivide as threes.
At this stage, the upwards wave from the low in December 2016 does now look best and subdivide best as a completed zigzag. This may be intermediate wave (A) of a flat correction or a triangle. Because a triangle for primary wave Y would look essentially the same as the second weekly chart below, only a flat correction is considered here. The most common two structures in a double combination are a zigzag and a flat.
This wave count follows the most common scenario and has the best fit.
Within the flat correction of primary wave Y, intermediate wave (B) must retrace a minimum 0.9 length of intermediate wave (A) at 1,140.27. The most common length for intermediate wave (B) is from 1 to 1.38 times the length of intermediate wave (A), giving a common range from 1,123.08 to 1,057.77.
Intermediate wave (B) may subdivide as any corrective structure, but the most common structure for B waves within flats is a zigzag. At this stage, on the hourly chart it looks like a five down is almost complete, which would indicate intermediate wave (B) is a zigzag subdividing 5-3-5.
The daily and hourly charts will follow this weekly chart. That does not mean the other two weekly charts aren’t possible, they are, but the number of charts must be kept reasonable on a daily basis.
WEEKLY CHART II
Click chart to enlarge.
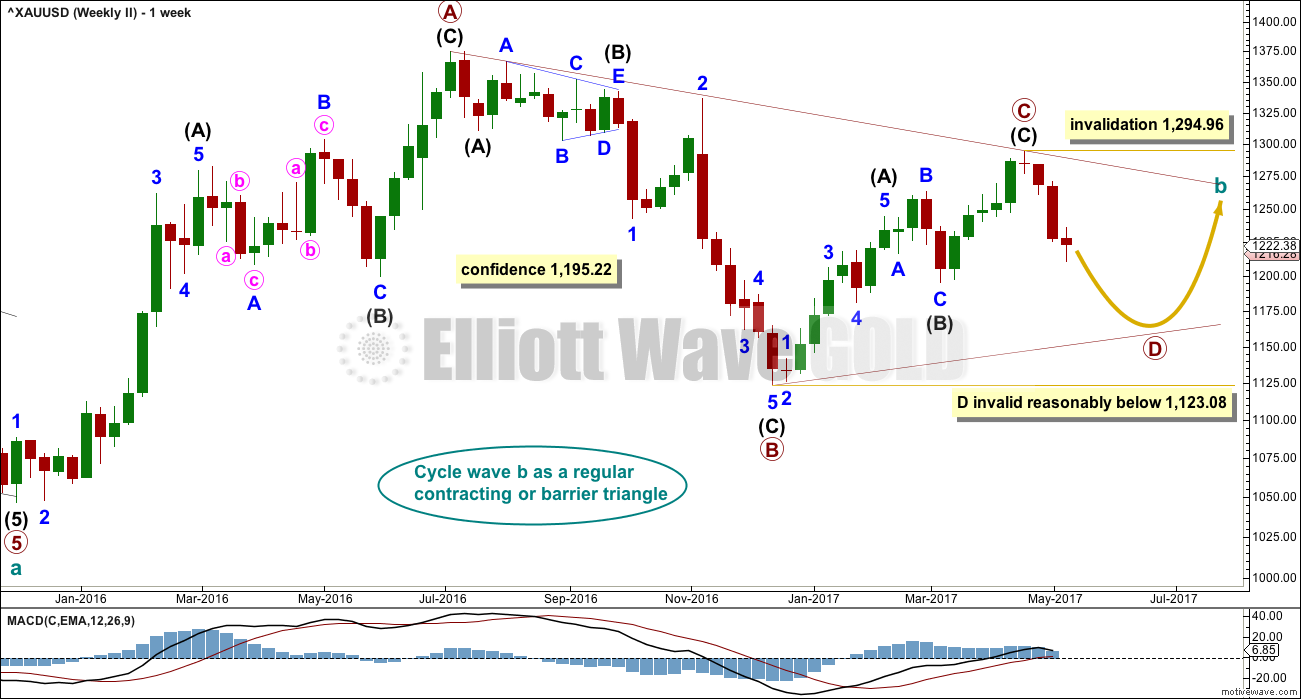
What if cycle wave b is a triangle? This is also entirely possible. Triangles are not as common as double combinations, but they are not uncommon.
Within the triangle, primary waves A, B and C are all single zigzags. One of the five subwaves of a triangle normally subdivides as a more complicated multiple, usually a double zigzag. This may be what is unfolding for primary wave D.
Primary wave D of a regular contracting triangle may not move beyond the end of primary wave B below 1,123.08.
Primary wave D of a regular barrier triangle should end about the same level as primary wave B at 1,123.08, so that the B-D trend line is essentially flat. What this means in practice is that primary wave D may end slightly below 1,123.08 and the triangle would remain valid. This is the only Elliott wave rule which is not black and white.
Thereafter, primary wave E should unfold upwards and would most likely fall a little short of the A-C trend line. If not ending there, it may overshoot the A-C trend line.
DAILY CHART
Click chart to enlarge.
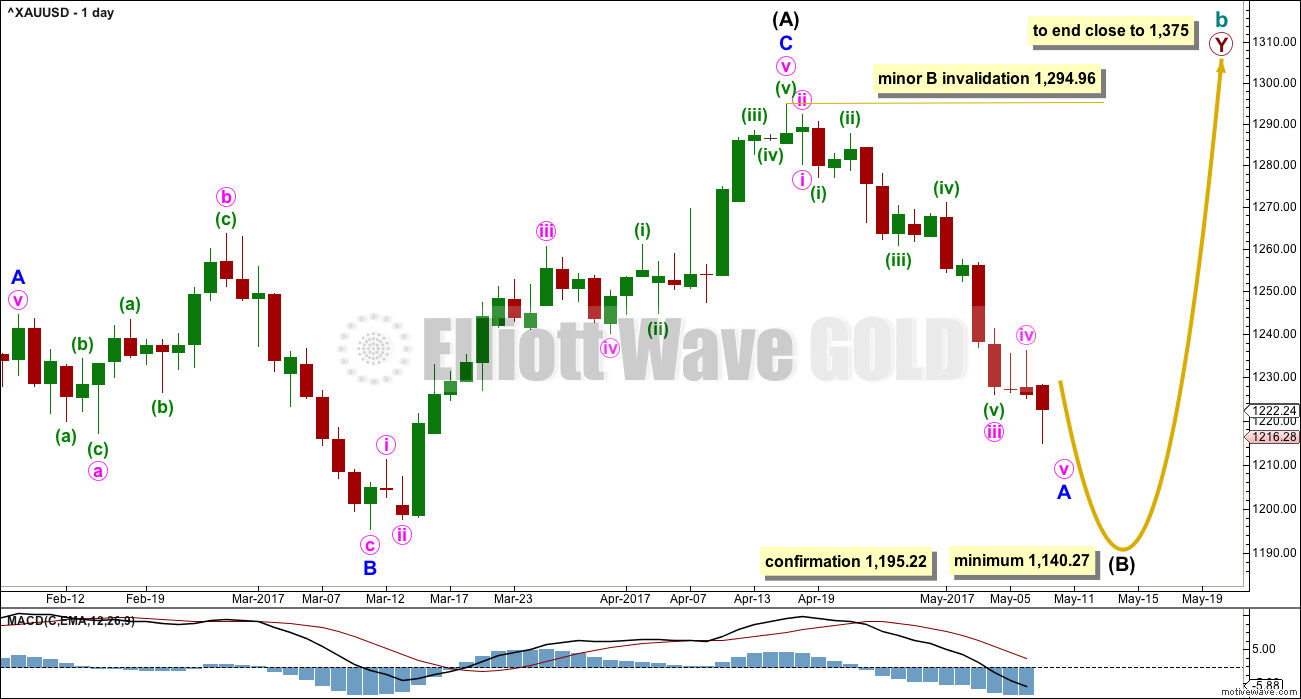
This daily chart will suffice for both weekly charts above, although the labelling follows weekly chart I.
Both weekly charts expect a zigzag downwards. Weekly chart I expects a deep zigzag for intermediate wave (B) to a minimum at 1,140.27. Weekly chart II expects a zigzag down for primary wave D to not move below 1,123.08 and most likely fall well short of that point.
The daily chart follows the expectations for weekly chart I, but the structure for weekly chart II would be exactly the same.
Within the flat correction of primary wave Y, intermediate wave (B) must retrace a minimum 0.9 length of intermediate wave (A) at 1,140.27. The most likely corrective structures to achieve the deep correction required for B waves within flats are single or multiple zigzags. These begin with a five, then a three in the opposite direction. So far a five down looks close to completion; when complete, it should then be followed by a three up.
Minor wave B, when it arrives, may be deep but may not move beyond the start of minor wave A above 1,294.96.
When minor wave A is complete and is confirmed so by a breach of the channel on the hourly chart, then the 0.382 and 0.618 Fibonacci ratios will be used as targets for minor wave B. Neither target can be favoured because B waves exhibit the greatest variety in form and behaviour; they may be shallow or very deep.
When minor waves A and B are complete, then a target may be calculated for minor wave C downwards to end the zigzag of intermediate wave (B), using the Fibonacci ratio between minor waves A and C. That cannot be done yet.
2 HOURLY CHART
Click chart to enlarge.
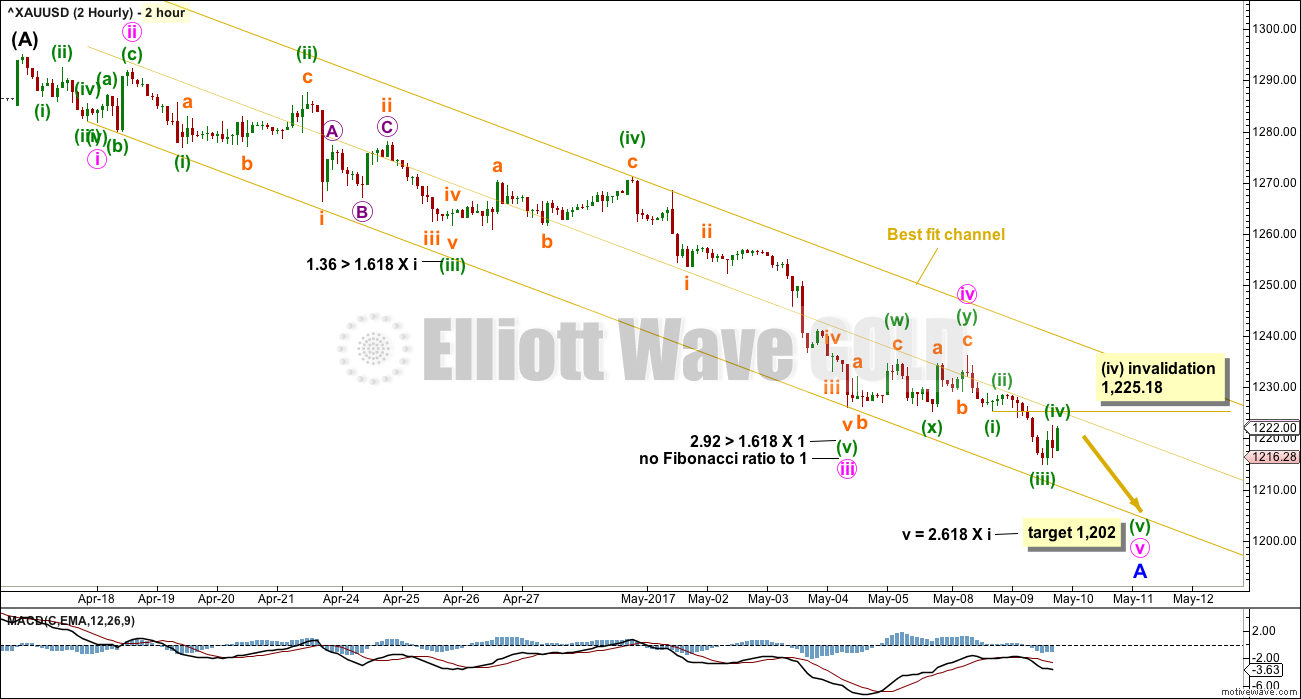
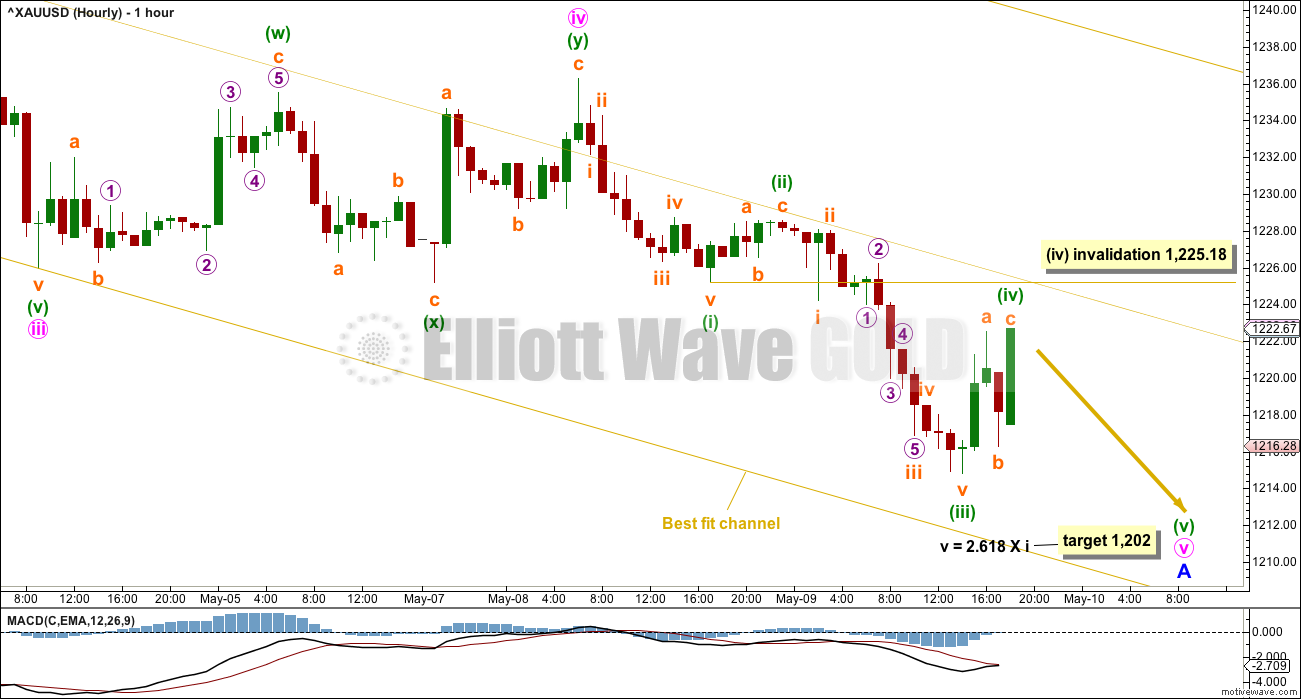
This downwards movement so far looks very much like an impulse. Fibonacci ratios at minute and minuette degrees are noted.
The best fit channel is very important. Add a mid line. Expect price to continue down while price remains within the lower half. When price breaks into the upper half, it would most likely be the end of minor wave A and the start of minor wave B. A breach of the upper edge of the channel would provide strong indication that minor wave A is over.
Only a final fifth wave down may now be required. Within minute wave v, the correction for minuette wave (iv) may not move into minuette wave (i) price territory above 1,225.18.
HOURLY CHART
Click chart to enlarge.
Minute wave v looks like it is unfolding as an impulse. Within minute wave v, the final fifth wave down looks like it needs to complete.
If price moves above 1,225.18 by any amount at any time frame prior to a new low, then labelling of minute waves iv and v would likely be wrong. A new high above 1,225.18 would invalidate this labelling of minute wave v as incomplete. That would indicate that a low may be in.
When price breaks into the upper half of the best fit channel, that would be the earliest indication that minor wave A is most likely over and minor wave B has most likely begun.
A clear breach of the upper edge of the best fit channel would provide substantial confidence that minor wave A is over.
At that stage, draw a Fibonacci retracement along the length of minor wave A. Use the 0.382 and 0.618 Fibonacci ratios as targets for minor wave B, favouring neither.
Minor wave B should last at least one week. It may be a quick sharp zigzag, or a more time consuming complicated combination or triangle. B waves exhibit the greatest variety in form and behaviour. They normally do not offer good trading opportunities, but a movement at minor degree may. If trying to trade this upcoming B wave upwards, members are advised to reduce the % of equity exposed and to be diligent about managing risk.
TECHNICAL ANALYSIS
WEEKLY CHART
Click chart to enlarge. Chart courtesy of StockCharts.com.
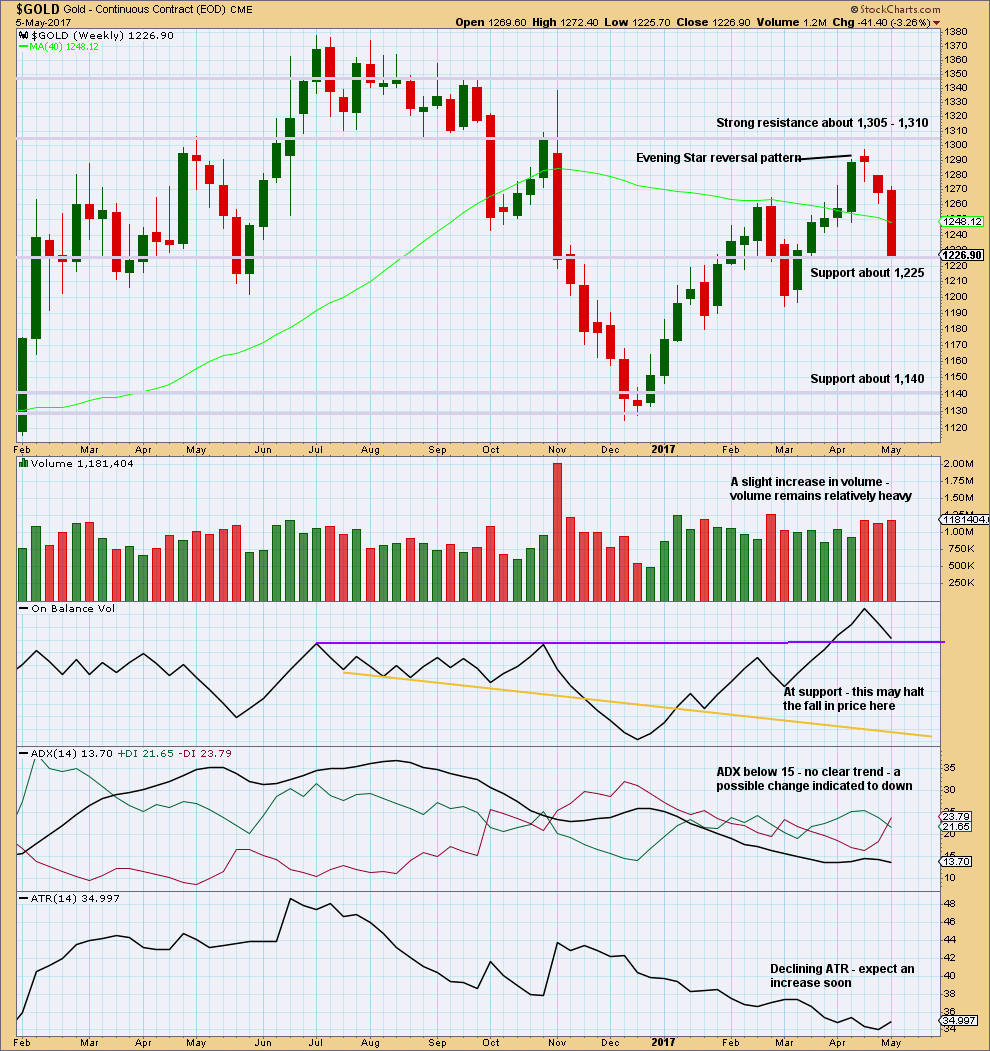
This weekly chart now looks bearish. Volume is bearish. The strong weekly candlestick looks very bearish.
Support for price and On Balance Volume may halt the fall in price temporarily, a bounce about here looks like a very reasonable expectation.
DAILY CHART
Click chart to enlarge. Chart courtesy of StockCharts.com.
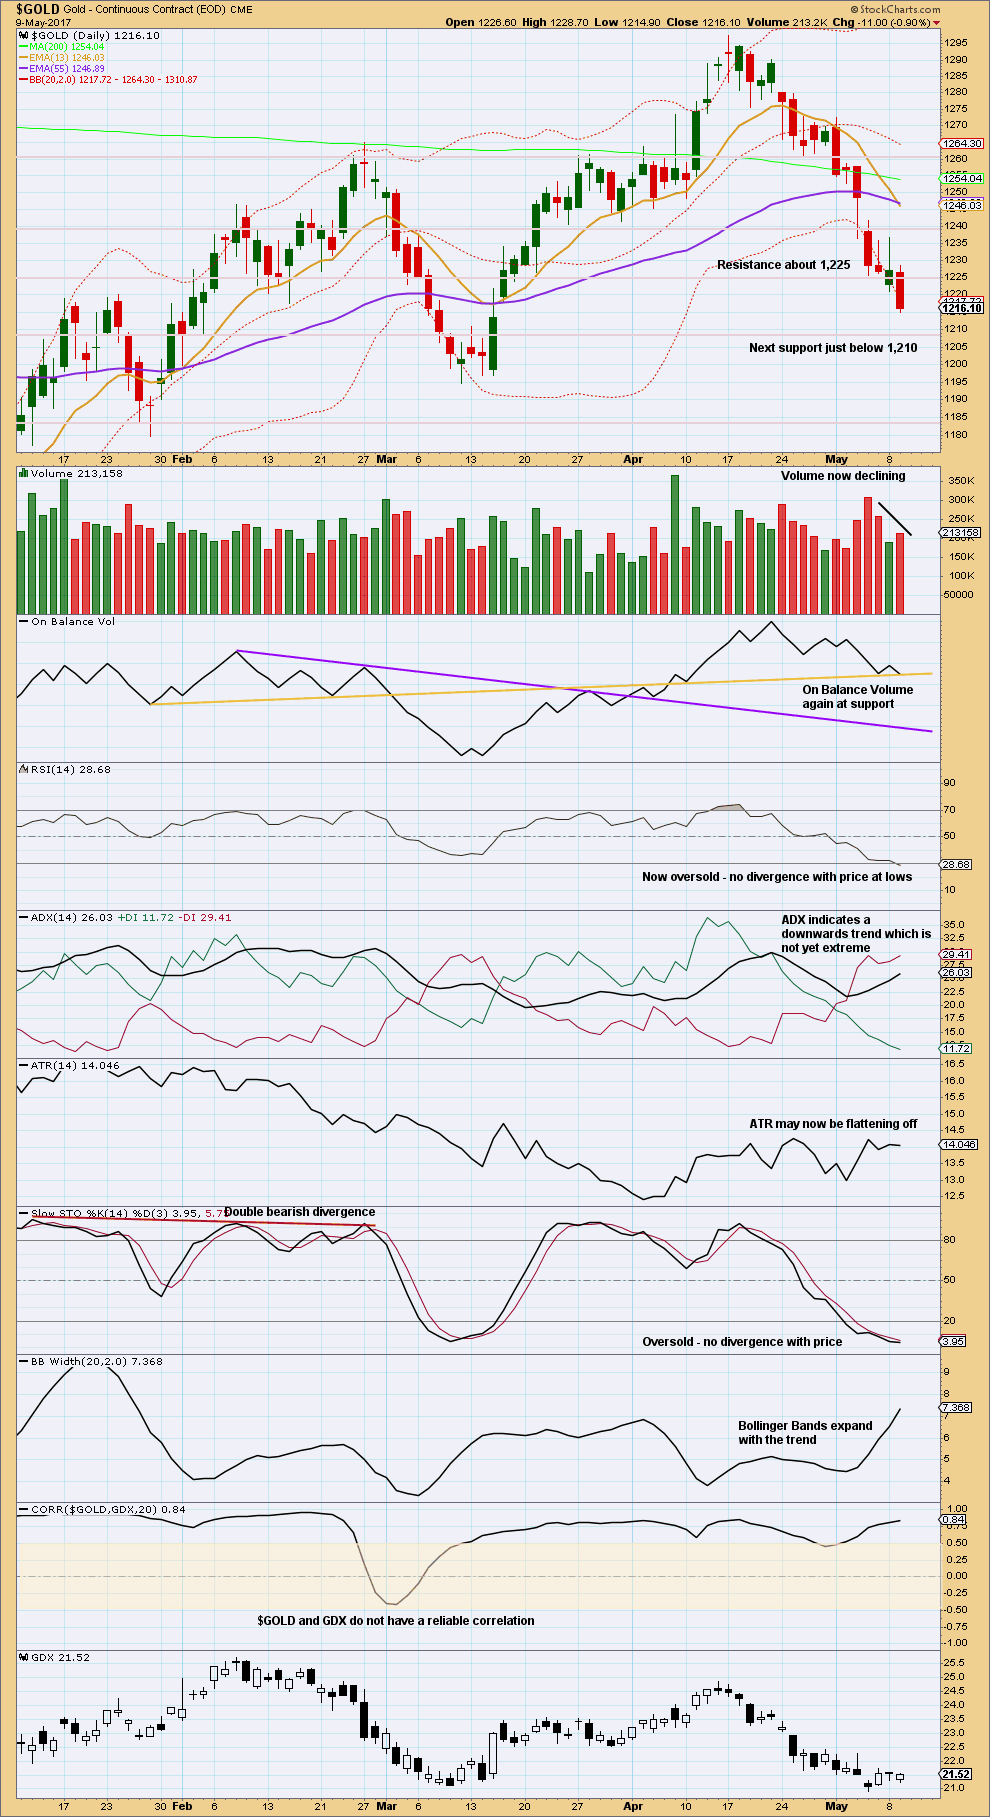
Volume is now declining as price falls further. On Balance Volume is again at support. RSI is now oversold.
While it is entirely possible that price may continue to fall here, it does look like a bounce may be coming sooner rather than later.
Next support is about 1,210. Thereafter, there is strong support just below 1,185.
GDX
DAILY CHART
Click chart to enlarge. Chart courtesy of StockCharts.com.
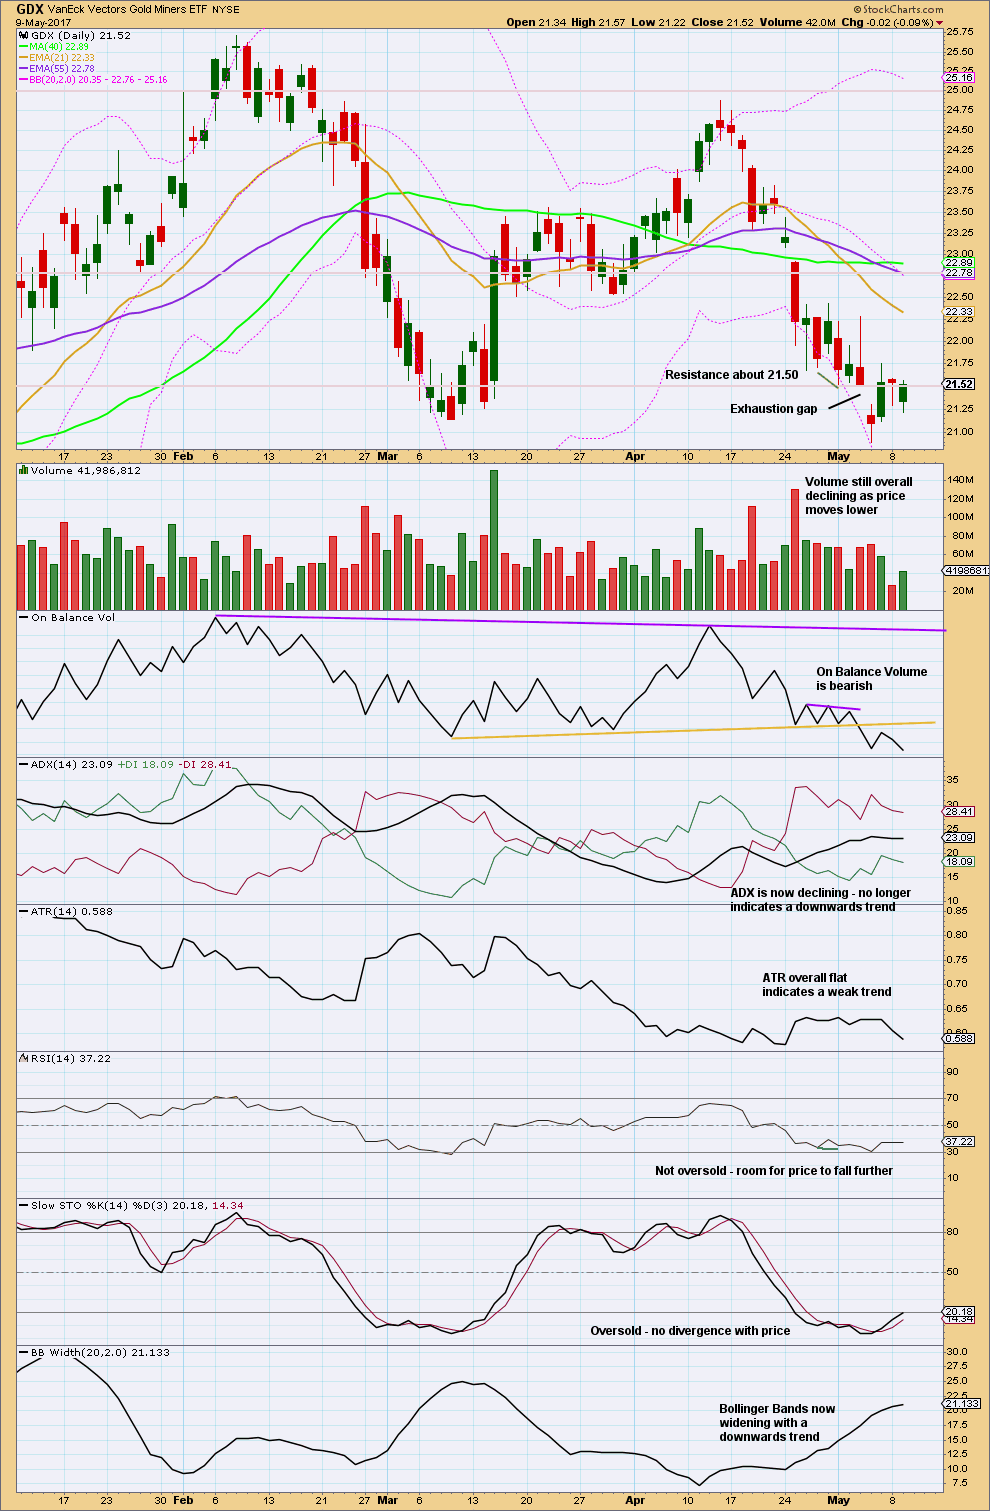
Resistance about 21.50 now looks like it is holding. If it gives way, then next resistance is about 22.75.
A consolidation is underway; price is moving sideways, volume is declining, ATR is declining, and ADX is declining.
This analysis is published @ 07:38 p.m. EST.
Alternate idea:
It’s also possible that minor A is done. But this only works if the first wave up is a leading diagonal. That reduces the probability of this idea a little. Leading diagonals aren’t rare, but they’re not really common either.
Price remains mostly within the lower half of the best fit channel. Until it at least breaks into the upper half, and preferably breaks above the upper edge, then we cannot have reasonable confidence that the wave down is over and the bounce has arrived.
If my understanding of wave count and target is correct than minor B target should be minimum 1286.
Thanks.
Not necessarily. It could be a very shallow correction.
The 0.382 Fibonacci ratio is at 1,245. The 0.618 Fibonacci ratio is at 1,264.
So for minor B to reach 1,286 it would be very deep indeed. It doesn’t have to be.
First chart updated:
It’s still possible that we may see one more low before minor A is done.
Inverted HnS of GDX
If the miners have a say about the bottom in gold, then it appears the bottom is in. With the gap up today, GDX looks like an island reversal. Bullish near term.
I do agree with you.
I did an EW analysis of NUGT and there are 2 possible counts. I have one that favours another low, agreeable with gold’s Minor C down. The other shows that the bottom is already in. This would be a case of the miners leading gold in recovery.
I agree too. They have been leading of late, so we should listen to them.
Gold has now risen to a high of 1225.56, above Lara’s invalidation point of 1225.18. She said, and I quote “If price moves above 1,225.18 by any amount at any time frame prior to a new low, then labelling of minute waves iv and v would likely be wrong. A new high above 1,225.18 would invalidate this labelling of minute wave v as incomplete. That would indicate that a low may be in (sic).” It could signify that Minor A would be deemed to be completed. Which means we are now in Minor B.
The change may be too early to tell with any certainty. Only at the 30-minute or lower timeframes could I detect this. In those instances, prices had risen above the cloud.
Ichimoku Hourly Analysis — data as at 1:15 am today
============================================
Gold price has convincingly moved below the bottom of the cloud. Although the blue tenkan-sen has peeked its head slightly above the red kijun-sen, this weak positive cross does not look inviting at this stage. It merely indicates a backtest of support turned resistance is underway. Without any further impetus, I do not foresee the now strong resistance of the cloud bottom giving way on the first try.
What this indicates is that price will be dropping today in minuette 5. The support levels are:
(1) 1218.76, which is 23.6% of the range 1195.22 to 1294.96;
(2) 1209.78, which is 14.6% of the range 1195.22 to 1294.96;
(3) 1202, Lara’s target for the drop in minuette 5; and
(4) 1200, round-number psychological support.
I don’t expect any drop below 1200 at the moment. I will provide an update should any major change occur. Happy trading.
Ichimoku Daily Analysis — data as at the close of May 9
==============================================
Gold price fell significantly yesterday to move below the bottom of the cloud. The daily candlestick shows that it is straddling the bottom, only just. At all shorter timeframes, price had fallen below the cloud convincingly. The rise in minuette 4 is most likely a back test of that support turned resistance.
All the support levels given by Ichimoku analysis have been broken. I think the market is heading lower at this point. I believe that any rally here, unless it gets past 1225, should be a selling opportunity. The 1225 level should be massively forbidding as it is now the first support turned resistance. An exhaustive candle after a bounce to that level would be a nice selling opportunity. It is not until we break above the 1235 resistance cluster level that I would be comfortable buying gold as it seems now to be very languid.
The downward pressure should continue as the safety trade appears to be in hibernation. It would take some geopolitical tension to stir things up a bit, just like the news, just before market close yesterday, of North Korea’s impending sixth nuclear test. Right now, though, traders are content to short gold as the bigger concerns appear to have gone away. The dollar seems well supported, especially considering the interest rate expectations coming out from the Federal Reserve. Unless we get some kind of nasty headline, my best guess is that gold is going to struggle.
Alan
Just requesting to update this daily chart.
Gold closed below the green cloud.
Alan I can post from Stock chart:
Gold Daily Ichimoku cloud:
Thanks Papudi.
I downloaded the graph early in the morning. They have not updated it yet. The time stamp on the graph is May 8.
The updated graph shows yesterday’s daily candle straddling the bottom of the cloud much more clearly.
An optimistic look at Silver for the mid-term once the current move down is finished. Looks possible. By Andrew McElroy
https://seekingalpha.com/article/4071287-silver-time-frame-27-medium-term-target?uprof=44&isDirectRoadblock=true
I am more worried about the broader markets than I am about the precious metals. I view the fall in price as an excellent opportunity to accumulate more physical metal and more shares of great companies. I know that is not the way most traders view it who are heavily positioned long, especially with leverage.
I have been wondering for the longest time when the broader markets are going to get some kind of mean reversion correction. They just simply refuse to decline by the slightest amount. Sometimes it starts to feel like mean reversion has been rescinded but we all know that is not the case. The duration of the recent market extremes has been nothing short of remarkable and since we know reversion will take place, to match the protracted deviation, we could either have an extended mean reversion time of low intensity (slow torturous decline) or we could have a shorter one of high intensity. That after all, are what crashes are all about. A lot of folk are talking confidently about they absolutely do not see this market retreating by more than 2 or three percent anytime soon. If they are right, it could be a long hot Summer! 🙂
So long as the market is under life-support, what with QEs, reduced interest rates, and Trumpmania since last November, the herd is lulled into a false mentality that nothing can go wrong. The big guys are piling cash into the market, buying up shares that are there for the taking; it does not matter what the company does — the case of Caterpillar yesterday is a striking example. The small guys feel that the big guys have a greater stake, and if they buy, why not follow suit? Entrenched, the mindless buying becomes a norm, sucking into its vortex even those who have no inkling how the market works. The mantra becomes one that if it works for everybody else, why should I not partake of the pie. Every dip becomes a buying opportunity, and the whole becomes self-perpetrating, feeding upon itself. The powers that be are happy; the wealthy becomes wealthier, and the governing authorities become more ensconced in their lofty positions, the rest gets a piece of the action. Utopia, or an inflating bubble ripe for the inevitable collapse?
Yep! I took a glance at futures and the were down this morning and was very surprised to see VIX red pre-market. Bullish sentiment was rising with a declining market. Talk about exuberance…!
If gold bounces here or soon, a Head and Shoulders pattern may be in the making
https://www.tradingview.com/x/ORB6BIl7/
Yep. I am starting to get a bit more bearish after taking a good look at some long term charts. I plan on keeping my long time select miners but will be definitely making plans to fully capitalize on further downside after the impending bounce.
Don’t see anything in it for the longs to win it; Gold price has already got rejected from under 1225 in the early going with 1235 still seen as curtailing; sell in May and go away? lol… a break below 1216 looks to be in the making and should setup 1208-1199 range; daily RSI tagging below 30 is a concern though….GL to all thanks to Lara!