The USD Index has been moving lower since January 2017.
ELLIOTT WAVE ANALYSIS
MONTHLY CHART
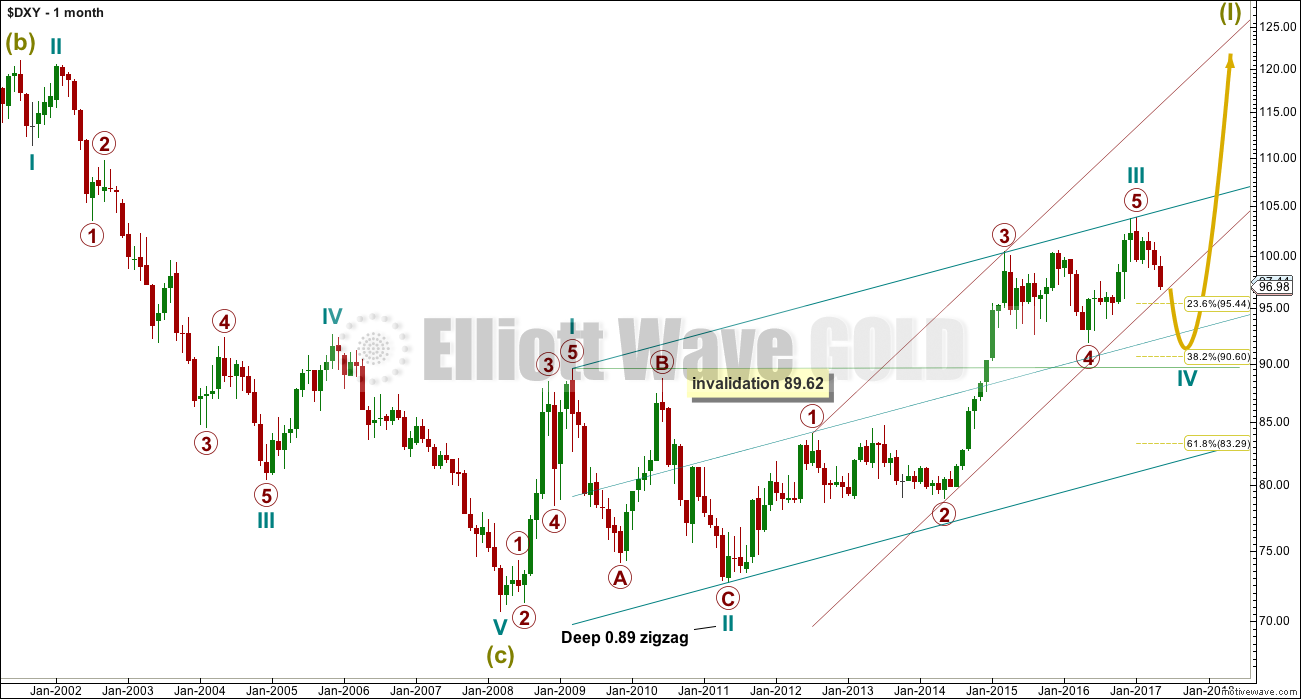
A Super Cycle degree impulse looks to be incomplete for Super Cycle wave (I).
Cycle waves I, II and now III look complete within Super Cycle wave (I) impulse. Cycle wave III is just 0.50 longer than 1.618 the length of cycle wave I.
Ratios within cycle wave III are: there is no Fibonacci ratio between primary waves 3 and 1, and primary wave 5 is just 0.5 shorter than equality in length with primary wave 1. Primary wave 3 is the longest extension and has the strongest slope.
Cycle wave II was a deep 0.89 zigzag lasting 26 months. Given the guideline of alternation, cycle wave IV may be expected to be a more shallow sideways correction which would likely be longer lasting. So far it has lasted just four months. It may be in its very early stages still.
WEEKLY CHART
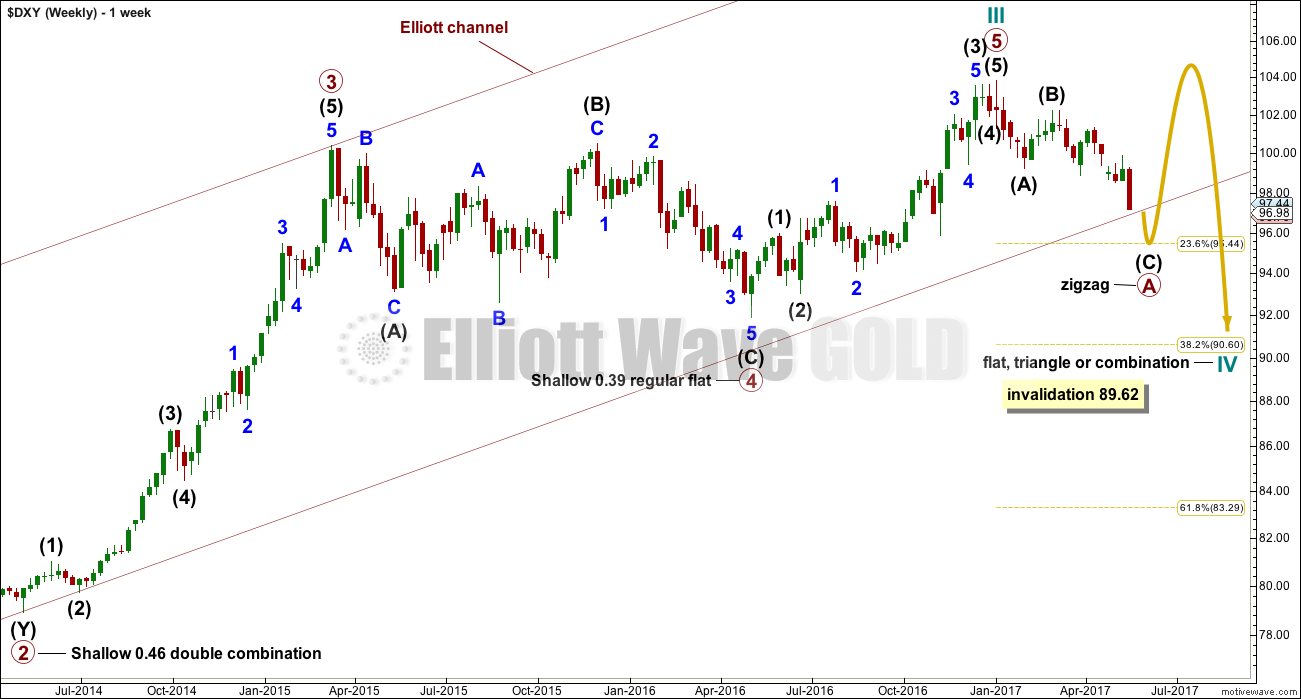
There is some alternation between the combination of primary wave 2 and the flat of primary wave 4.
When the channel is drawn on the monthly and weekly charts, it shows price has not yet broken below the lower edge.
When the channel is drawn on the daily chart, it shows price has just broken below the lower edge. This is the same for both semi log and arithmetic scales.
With a breach of the channel on the daily chart, it should be assumed to provide some confidence that cycle wave III is over and cycle wave IV has arrived.
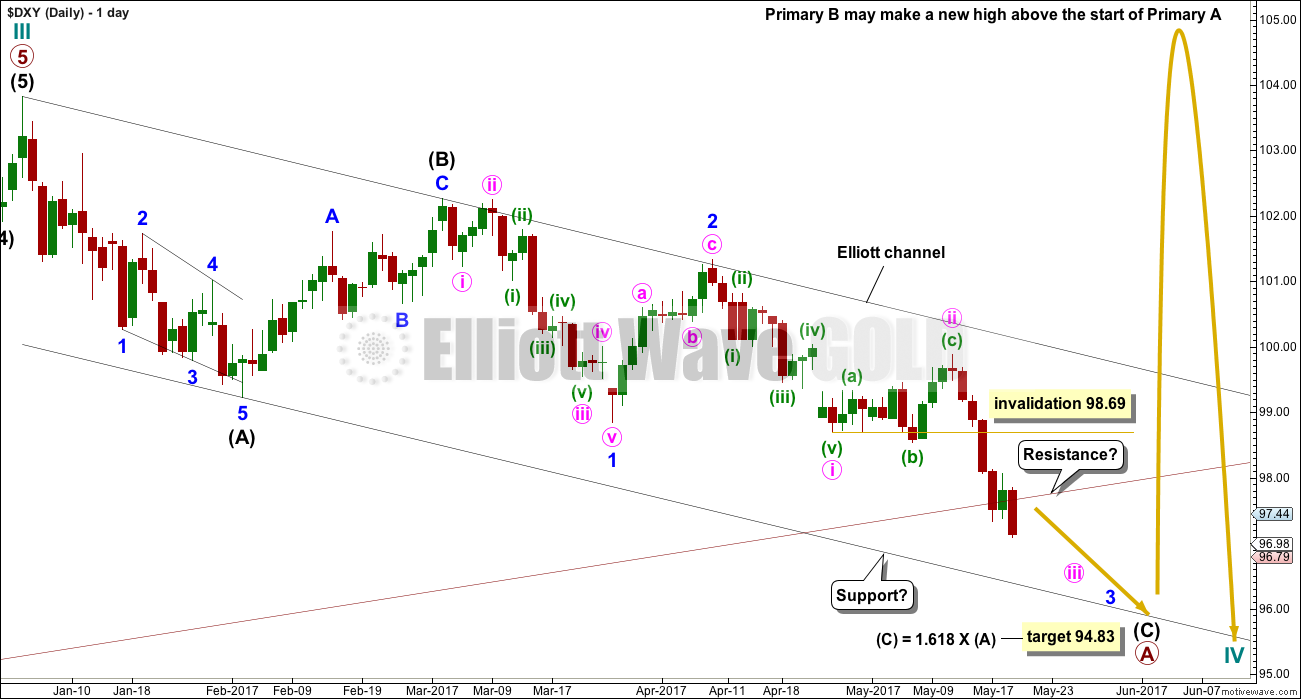
DAILY CHART
If cycle wave IV is unfolding as a flat, combination or triangle, then the first move down should unfold as a three. This may be a zigzag for primary wave A of a flat or triangle, or primary wave W of a double combination.
TECHNICAL ANALYSIS
MONTHLY CHART
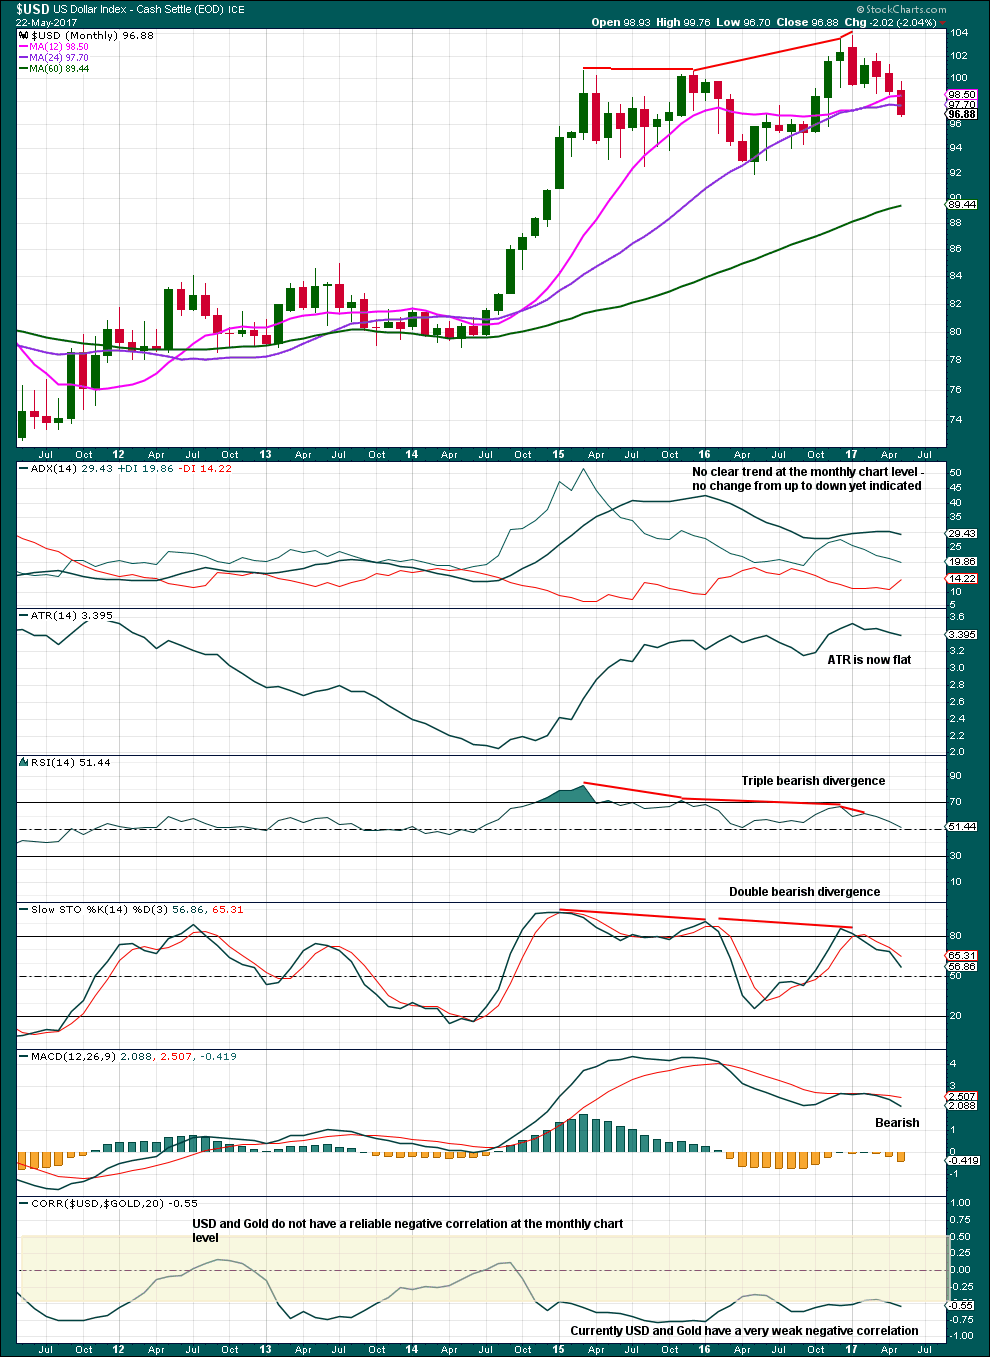
Click chart to enlarge. Chart courtesy of StockCharts.com.
This analysis supports the Elliott wave count at the monthly chart level.
Divergence between price and RSI is very bearish.
RSI and Stochastics are close to neutral. There is plenty of room for price to fall here.
ADX and ATR agree: the market is not currently trending at the monthly level.
It is very important to note that at the monthly chart level Gold and the USD Index do not have a reliable negative correlation. At this high time frame, they can spend months not correlated.
Each market should be and will be analysed separately. We cannot expect that analysis of one market showing movement expected in one direction means our analysis of the other market should show it to move in the opposite direction, because the math proves that is not the case often enough. To make this correlation assumption without looking at the math is dangerous to your trading account.
DAILY CHART
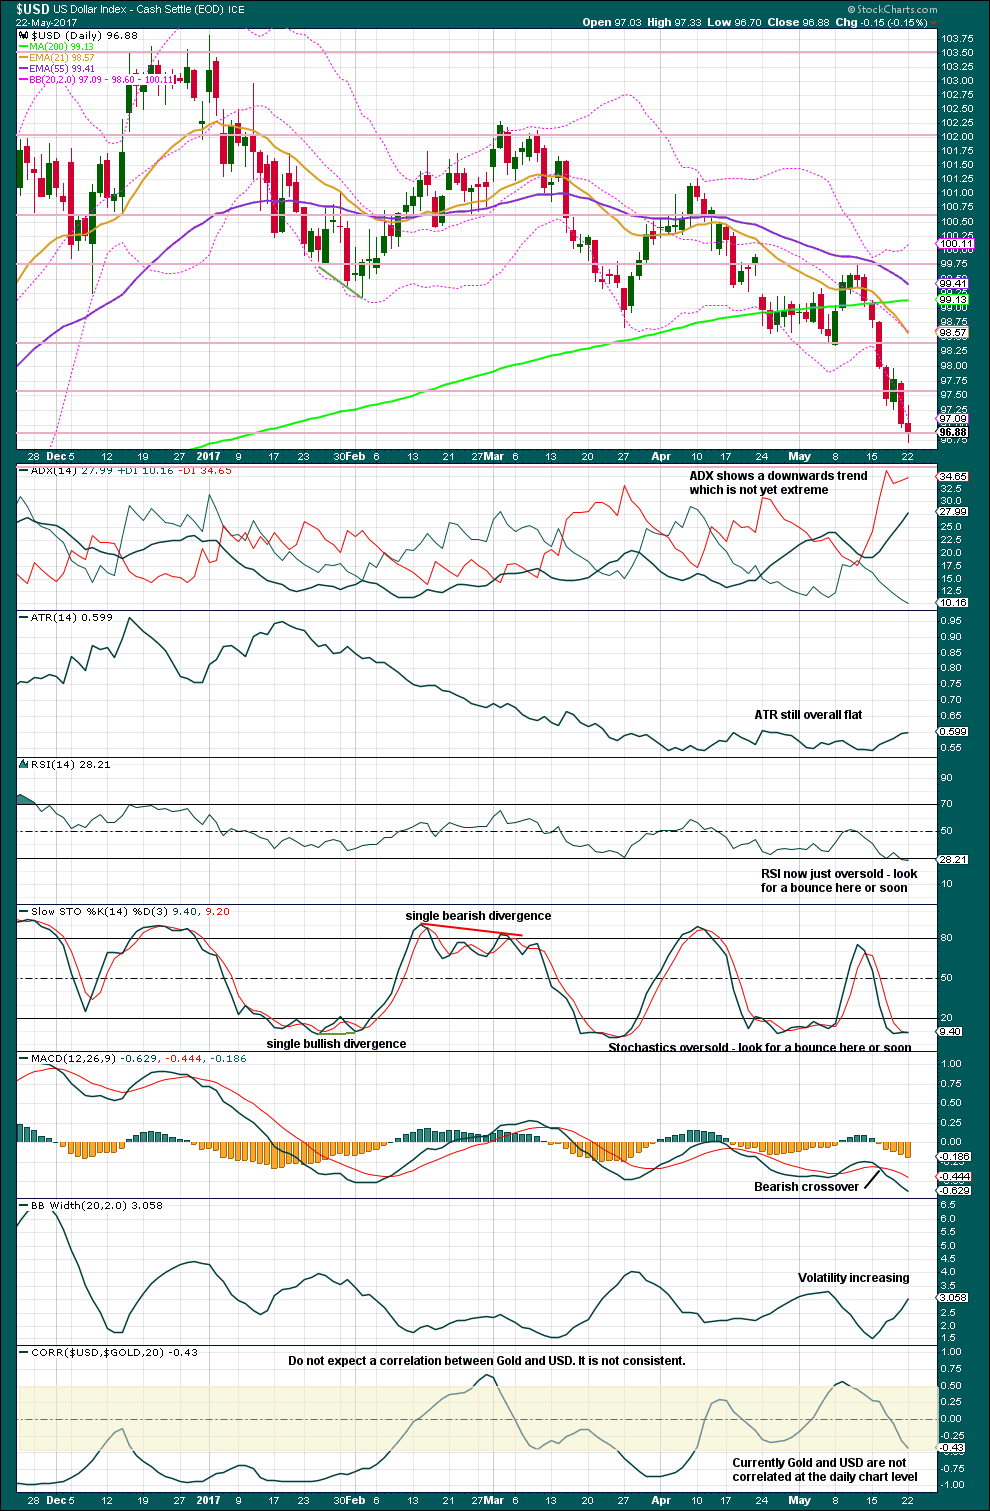
Click chart to enlarge. Chart courtesy of StockCharts.com.
While price made a new low for the 22nd of May, Stochastics did not. This single day divergence may be followed by a small bounce. RSI is oversold also, suggesting a small bounce here.
MACD is bearish, supporting the trend. Bollinger Bands are widening as price moves lower, so the trend has normal increasing volatility.
Both short and mid term moving averages have a negative slope and the short term average is below the mid term average. The long term 200 day average still has a positive slope, but price is below it.
It is looking increasingly like the USD is within a downwards trend that may continue for some time. This supports the Elliott wave count.
The trend has plenty of room to continue given that ADX is not yet extreme.
At the daily chart level, Gold and the USD Index do not have a reliable negative correlation.
The correlation coefficient must be above 0.5 (a positive correlation) or below -0.5 (a negative correlation) for any two sets of data to have a reliable correlation. Any two sets of data that have a correlation coefficient that spends any time between 0.5 and -0.5 does not mathematically have a reliable correlation. This area is shaded on the chart.
Currently, the correlation coefficient of Gold and the USD Index is -0.43. Currently, they do not have a negative correlation.
It is often assumed that these two markets will move in opposite directions. The math proves that assumption to be false.
This analysis is published @ 12:29 a.m. EST.

Thanks Lara. I think this $USD update fits much better with the options available for Gold at this time. Also, the short term target now aligns with the H&S target we’ve been looking at for awhile.
https://www.tradingview.com/x/nas3zhXc/
Excellent
*rubs hands together*