
Downwards movement was expected for Thursday. Price did move lower to complete a red daily candlestick, but it was an inside day with a bullish long lower wick.
Summary: A high may again be in place here or very soon indeed. When the new channel on the hourly chart is breached, then confidence may be had in this view. The target is now at 1,064 for the first weekly chart, and still 1,157 to 1,149 for the second weekly chart.
New updates to this analysis are in bold.
Last historic analysis with monthly charts is here, video is here.
Grand SuperCycle analysis is here.
MAIN ELLIOTT WAVE COUNT
For clarity I have decided at this time it may be best to publish on a daily basis weekly charts I, II and IV. Both weekly charts I and II expect a zigzag down to complete and the difference is in the expected depth. Weekly chart IV has a very low probability and will only be given serious consideration if price makes a new high above 1,294.96.
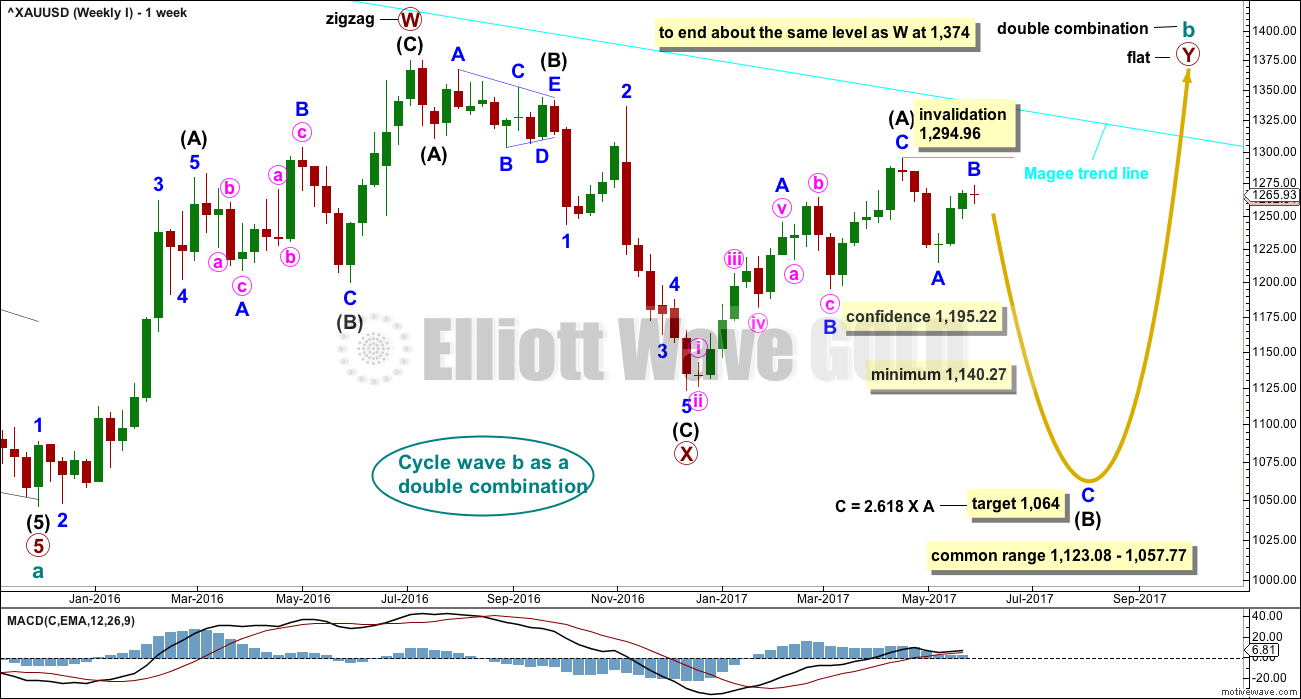
WEEKLY CHART I
Click chart to enlarge.
Combinations are very common structures. Cycle degree waves normally last one to several years, and B waves do tend to be more time consuming waves than all other waves. Given these tendencies the most likely scenario at this point may be that cycle wave b is an incomplete double combination.
The first structure in the double labelled primary wave W fits as a zigzag. This upwards movement will subdivide as either a three (zigzag) or a five (impulse). It does have a three wave look to it.
The double is joined by a deep three in the opposite direction labelled primary wave X, which is a 0.77 depth of primary wave W. X waves within double combinations are normally very deep; this one looks right.
The second structure in the combination may be either a triangle or a flat correction. Both of these structures have A waves which subdivide as threes.
At this stage, the upwards wave from the low in December 2016 does now look best and subdivide best as a completed zigzag. This may be intermediate wave (A) of a flat correction or a triangle. Because a triangle for primary wave Y would look essentially the same as the second weekly chart below, only a flat correction is considered here. The most common two structures in a double combination are a zigzag and a flat.
This wave count follows the most common scenario and has the best fit.
Within the flat correction of primary wave Y, intermediate wave (B) must retrace a minimum 0.9 length of intermediate wave (A) at 1,140.27. The most common length for intermediate wave (B) is from 1 to 1.38 times the length of intermediate wave (A), giving a common range from 1,123.08 to 1,057.77.
A target is now calculated for minor wave C to complete intermediate wave (B). This target would meet the minimum requirement for intermediate wave (B).Minor wave B has moved higher and the target is recalculated. At 1,064 minor wave C would exhibit a common Fibonacci ratio to minor wave A, and the minimum requirement for intermediate wave (B) would be met.
Intermediate wave (B) may subdivide as any corrective structure, but the most common structure for B waves within flats is a zigzag. At this stage, on the hourly chart it looks like a five down labelled minor wave A is complete, which would indicate intermediate wave (B) is a zigzag subdividing 5-3-5.
The daily and hourly charts will follow this weekly chart. That does not mean the other three weekly charts aren’t possible, they are, but the number of charts must be kept reasonable on a daily basis.
The Magee bear market trend line is added to the weekly charts. This cyan line is drawn from the all time high for Gold on the 6th of September, 2011, to the first major swing high within the following bear market on the 5th of October, 2012. This line should provide strong resistance. If that resistance holds, then the second weekly chart would be correct.
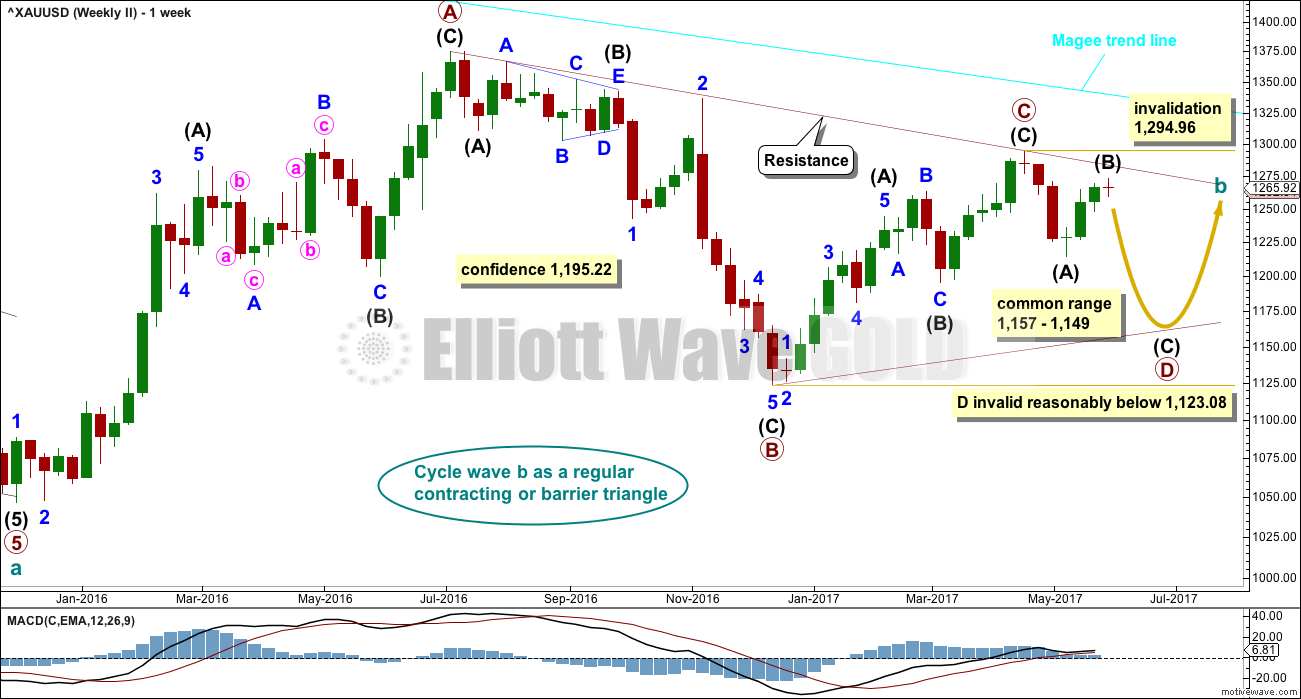
WEEKLY CHART II
Click chart to enlarge.
What if cycle wave b is a triangle? This is also entirely possible. Triangles are not as common as double combinations, but they are not uncommon.
Within the triangle, primary waves A, B and C are all single zigzags. One of the five subwaves of a triangle normally subdivides as a more complicated multiple, usually a double zigzag. This may be what is unfolding for primary wave D. It may also subdivide as a single zigzag.
Primary wave D of a regular contracting triangle may not move beyond the end of primary wave B below 1,123.08.
Primary wave D of a regular barrier triangle should end about the same level as primary wave B at 1,123.08, so that the B-D trend line is essentially flat. What this means in practice is that primary wave D may end slightly below 1,123.08 and the triangle would remain valid. This is the only Elliott wave rule which is not black and white.
Thereafter, primary wave E should unfold upwards and would most likely fall a little short of the A-C trend line. If not ending there, it may overshoot the A-C trend line. Primary wave E may not move beyond the end of primary wave C above 1,294.96.
Triangles normally adhere very well to their trend lines. Occasionally, price may overshoot the trend lines but when this happens it is not by much and is quickly reversed. The upper A-C trend line should offer very strong resistance at this stage if cycle wave b is unfolding as a triangle. This trend line is added to the daily chart below.
At this stage, the structure on the hourly chart is still the same for both this weekly wave count and the first weekly wave count: a zigzag downwards is unfolding. However, they now diverge in how far down the next wave is expected to go. This second weekly wave count expects a more shallow movement to not end reasonably below 1,123.08.
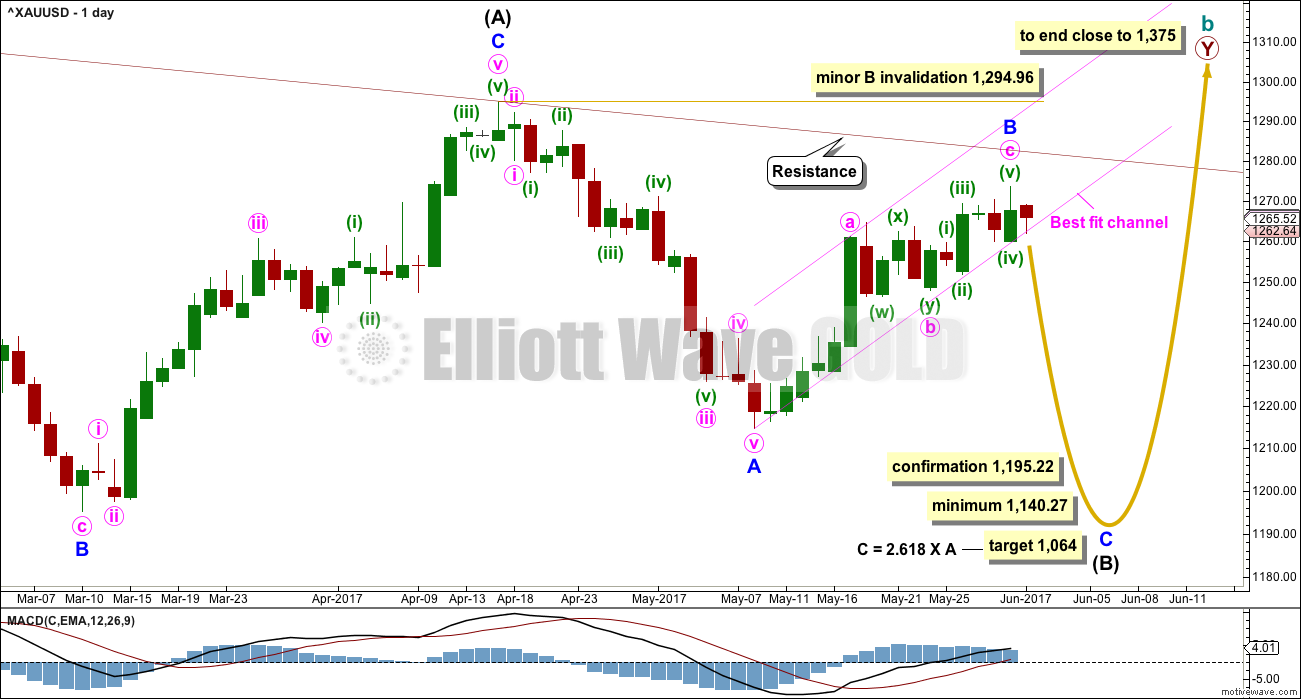
DAILY CHART
Click chart to enlarge.
This daily chart will suffice for both weekly charts above, although the labelling follows weekly chart I.
Both weekly charts expect a zigzag downwards. (It may also turn out to be a double zigzag. For now a single only will be charted but a double will be kept in mind). Weekly chart I expects a deep zigzag for intermediate wave (B) to a minimum at 1,140.27. Weekly chart II expects a zigzag down for primary wave D to not move below 1,123.08 and most likely fall well short of that point.
The daily chart follows the expectations for weekly chart I, but the structure for weekly chart II would be exactly the same at this stage.
Within the flat correction of primary wave Y, intermediate wave (B) must retrace a minimum 0.9 length of intermediate wave (A) at 1,140.27. The most likely corrective structures to achieve the deep correction required for B waves within flats are single or multiple zigzags. These begin with a five, then a three in the opposite direction.
Minor wave A is complete. Minor wave B may now be a complete zigzag.
Minor wave B may not move beyond the start of minor wave A above 1,294.96.
For weekly chart I the target would be at 1,064. This would see intermediate wave (B) reach the minimum requirement and end within the common range for B waves of flat corrections. Minor wave A lasted 16 sessions, minor wave B if it is over at the last high also lasted 16 sessions. If minor wave C is to be 2.618 the length of minor wave A, then it would also be longer in duration. The target may be reached in a Fibonacci 21 or 34 sessions.
For weekly chart II the target would be 1,157 to 1,149. This target may be met in two to three weeks.
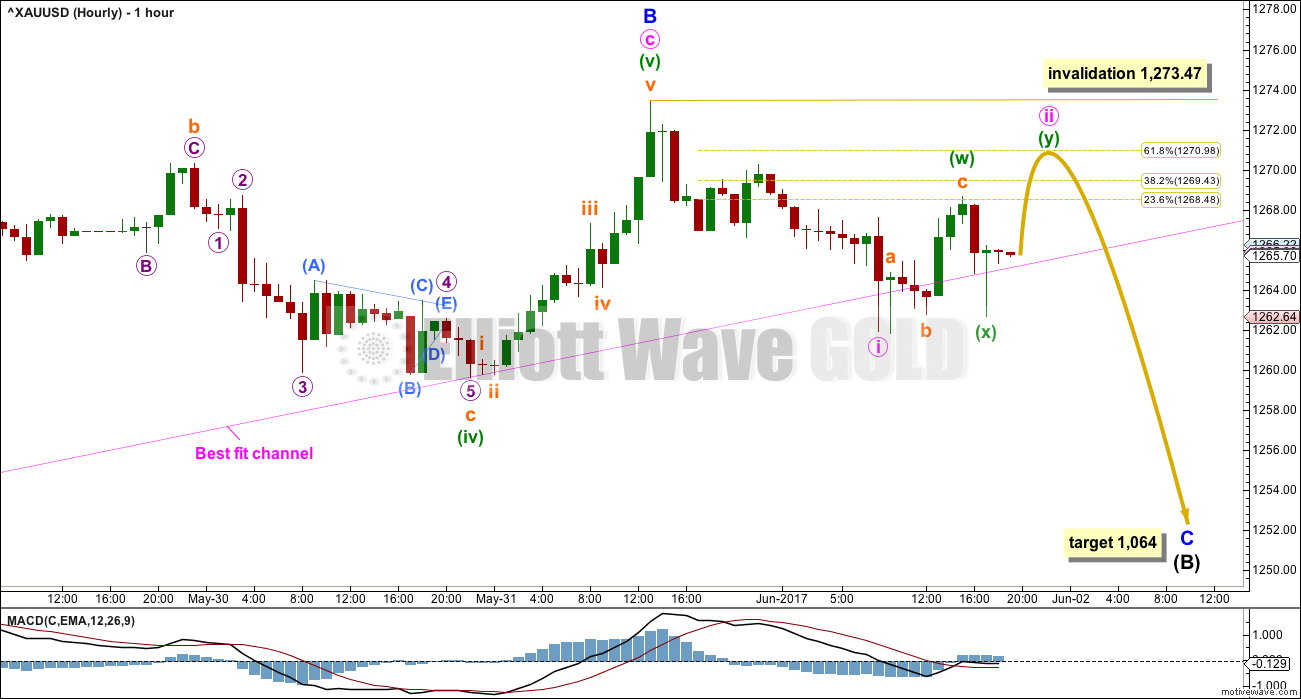
MAIN HOURLY CHART
Click chart to enlarge.
The first hourly chart looks at the possibility that minor wave B is a complete zigzag.
On the five minute chart, the wave down here labelled minute wave i will fit as a five wave impulse. The fourth wave correction within the impulse is very brief and shallow, closer to the end, whereas its counterpart second wave correction took more time to unfold. This gives the impulse a three wave look on the hourly chart level.
If a five down was complete at today’s low, then a three up should follow. The first second wave correction within a new wave for Gold is very commonly very deep. Minute wave ii may be incomplete at the high for Thursday; this may be only the first zigzag in a double or wave A of an expanded flat correction. Minute wave ii may end closer to the 0.618 Fibonacci ratio of minute wave i at 1,271.
The best fit channel is not yet breached by clear downwards movement. Price returned back to within the channel immediately after a small breach. This channel must be properly breached for confidence in this main hourly wave count.
ALTERNATE HOURLY CHART
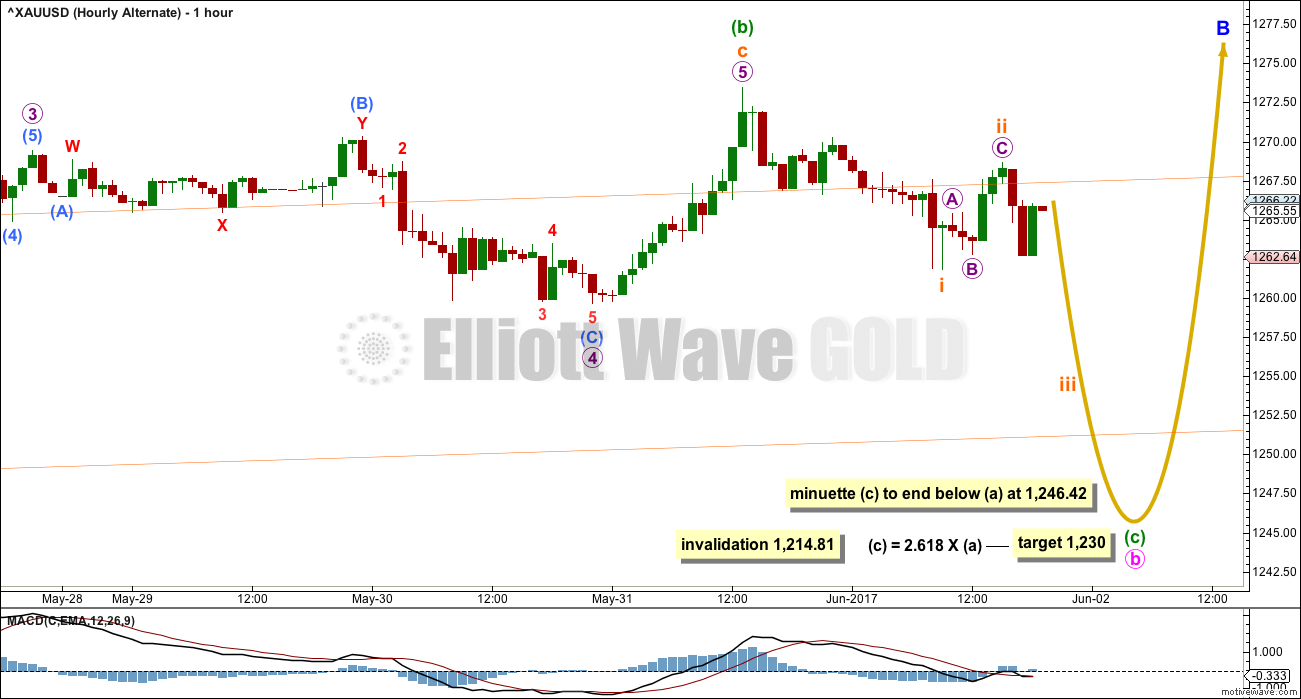
Click chart to enlarge.
This alternate wave count looks at the possibility that minor wave B is not yet complete, and that within it minute wave b will continue sideways in an ever increasing range as an expanded flat correction.
When minute wave b is complete, then a target for minute wave c upwards to complete the zigzag of minor wave B would be calculated.
At this stage, both hourly wave counts still expect more downwards movement.
WEEKLY CHART IV
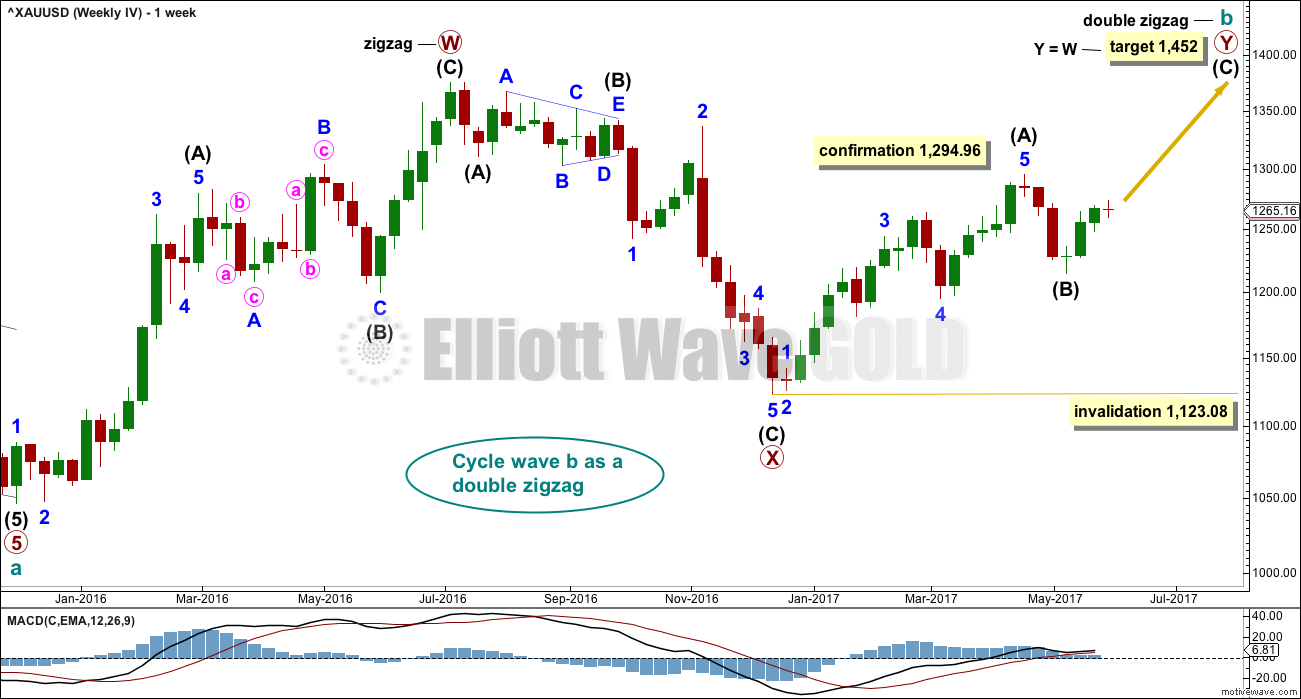
Click chart to enlarge.
What if the bull market beginning in December 2015 remains intact? Price has essentially been moving sideways since that date, so all possibilities should be considered.
The Morning Doji Star at the low labelled intermediate wave (B) will not be considered as a reversal pattern here because it comes in what is essentially a sideways movement. It does not come after a downwards wave, so there is nothing to reverse.
This wave count requires confirmation above 1,294.96. That would invalidate the first three weekly charts (the third is seen in historic analysis only).
It is possible that cycle wave b is continuing higher as a double zigzag. However, double zigzags normally have brief and shallow X waves. The purpose of the second zigzag in a double (and the third when there is one) is to deepen the correction when price does not move deep enough in the first (or second) zigzag. Thus double (and triple) zigzags normally have a strong and clear slope against the prior trend. To achieve this look their X waves normally are brief and shallow.
In this case, primary wave X is neither brief nor shallow. It is a 0.77 depth of primary wave W and lasted 0.74 the duration of primary wave W. Overall, this does not have a typical look of a double zigzag so far.
This wave count also must see the rise up to the high labelled intermediate wave (A) as a five wave impulse, not a three wave zigzag. This looks a little forced, so it reduces the probability of this wave count.
This wave count should only be used if confirmed with a new high above 1,294.96. Low probability does not mean no probability, but should always be given less weight until proven.
TECHNICAL ANALYSIS
WEEKLY CHART
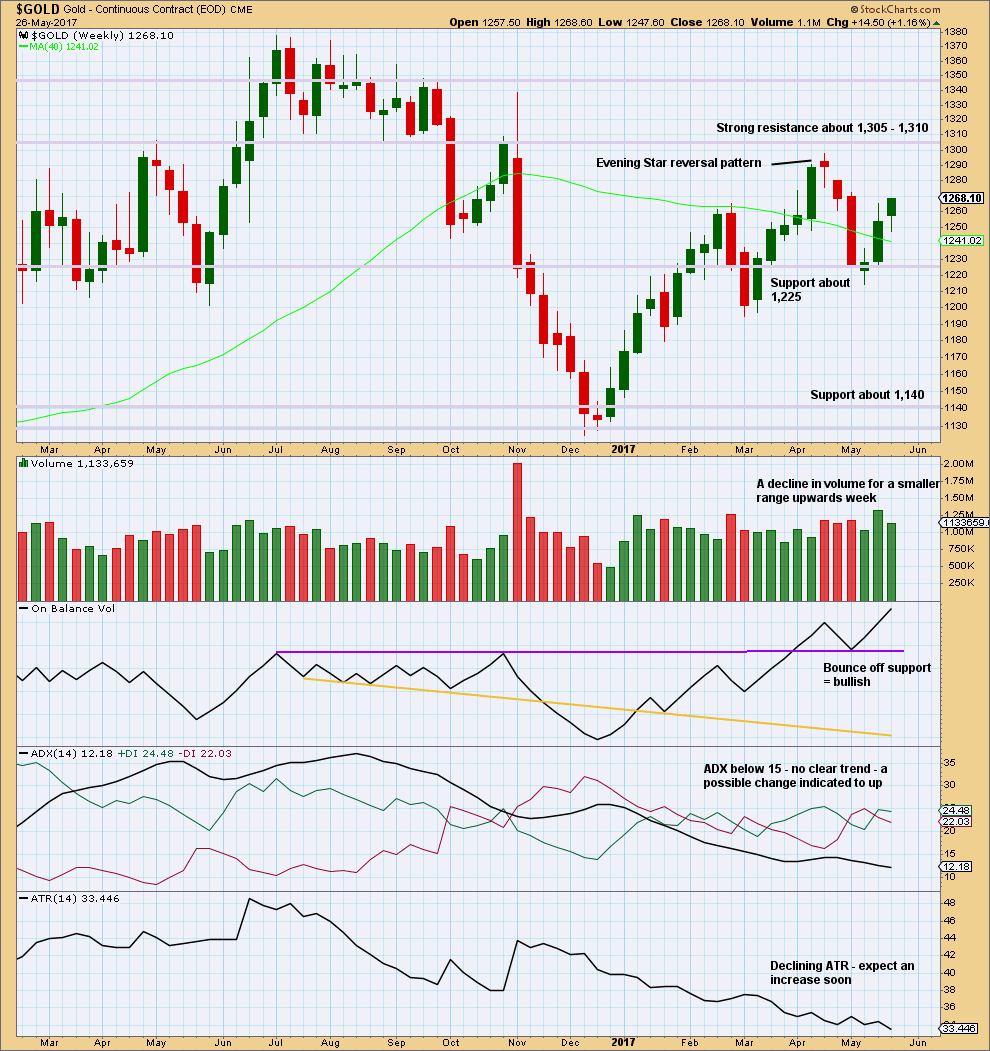
Click chart to enlarge. Chart courtesy of StockCharts.com.
The decline in volume is bearish, but it does not mean upwards movement must stop here. Price can continue higher on declining volume for another few weeks before a trend change as it did in February of this year.
On Balance Volume remains bullish. The long lower wick on this weekly candlestick is bullish.
ATR is bearish.
Overall, this chart is slightly bullish.
DAILY CHART
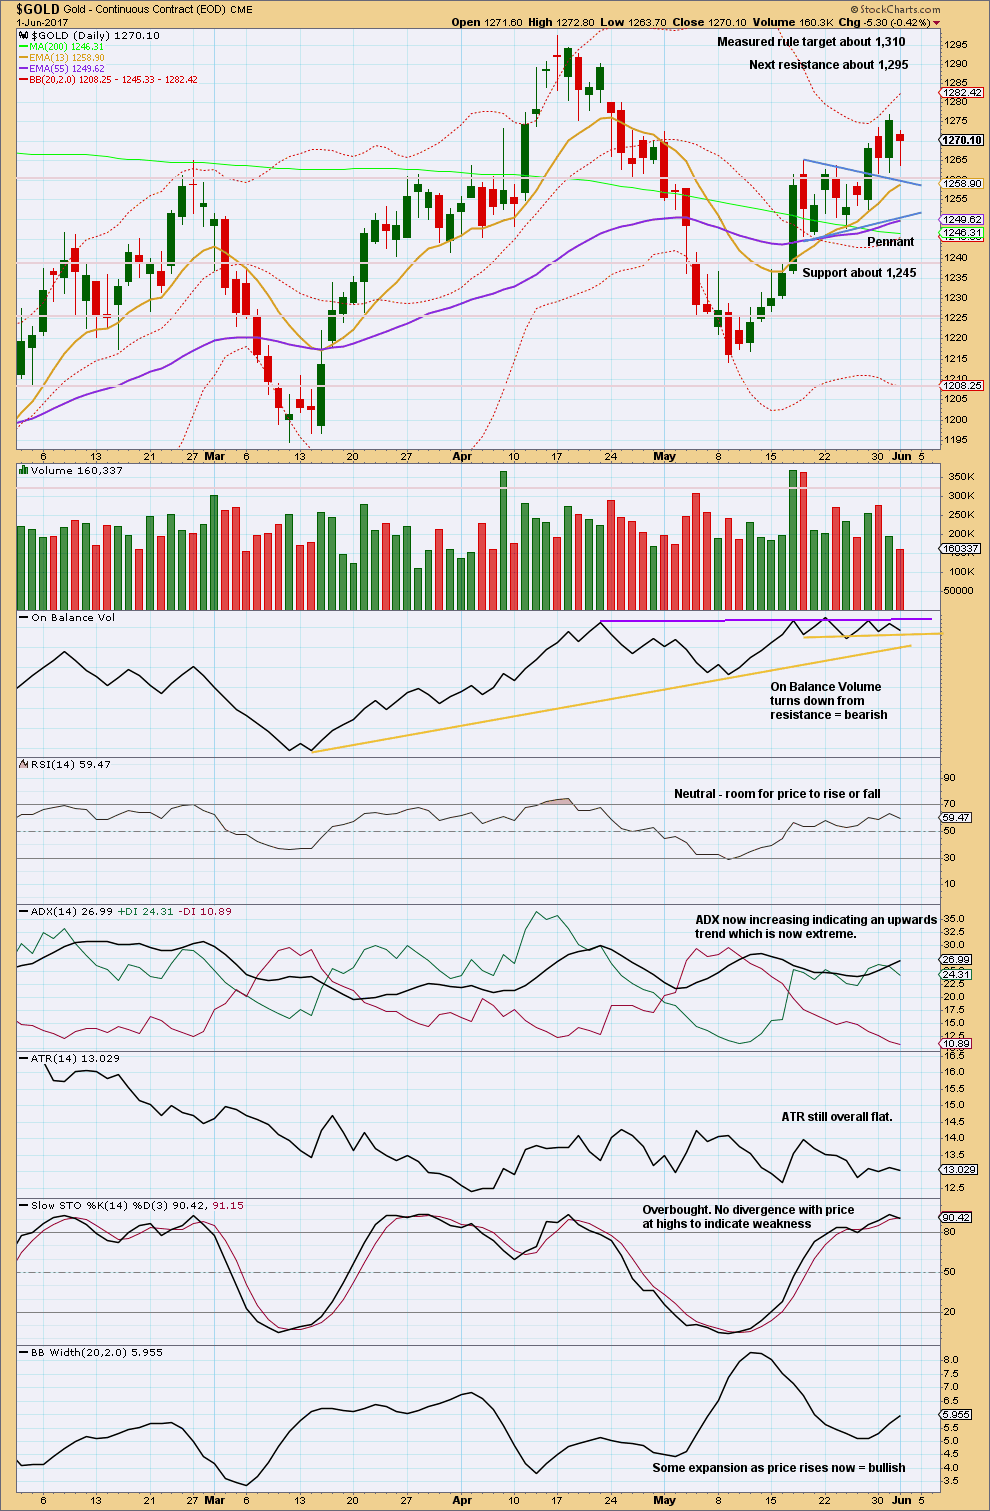
Click chart to enlarge. Chart courtesy of StockCharts.com.
The pennant pattern suggests an upwards breakout (which happened) to be followed by more upwards movement to the target at 1,310.
But during the pennant pattern, it was two downwards days which had strongest volume. This suggests more support for downwards movement than upwards. This is bearish.
On Balance Volume trend lines are slightly adjusted again as it continues to trace out a small sideways range. A breakout by On Balance Volume may precede the next direction for price.
The long lower wick of Thursday’s candlestick is bullish. The lack of support during the session for downwards movement from volume is also bullish.
ADX is bearish.
GDX
DAILY CHART
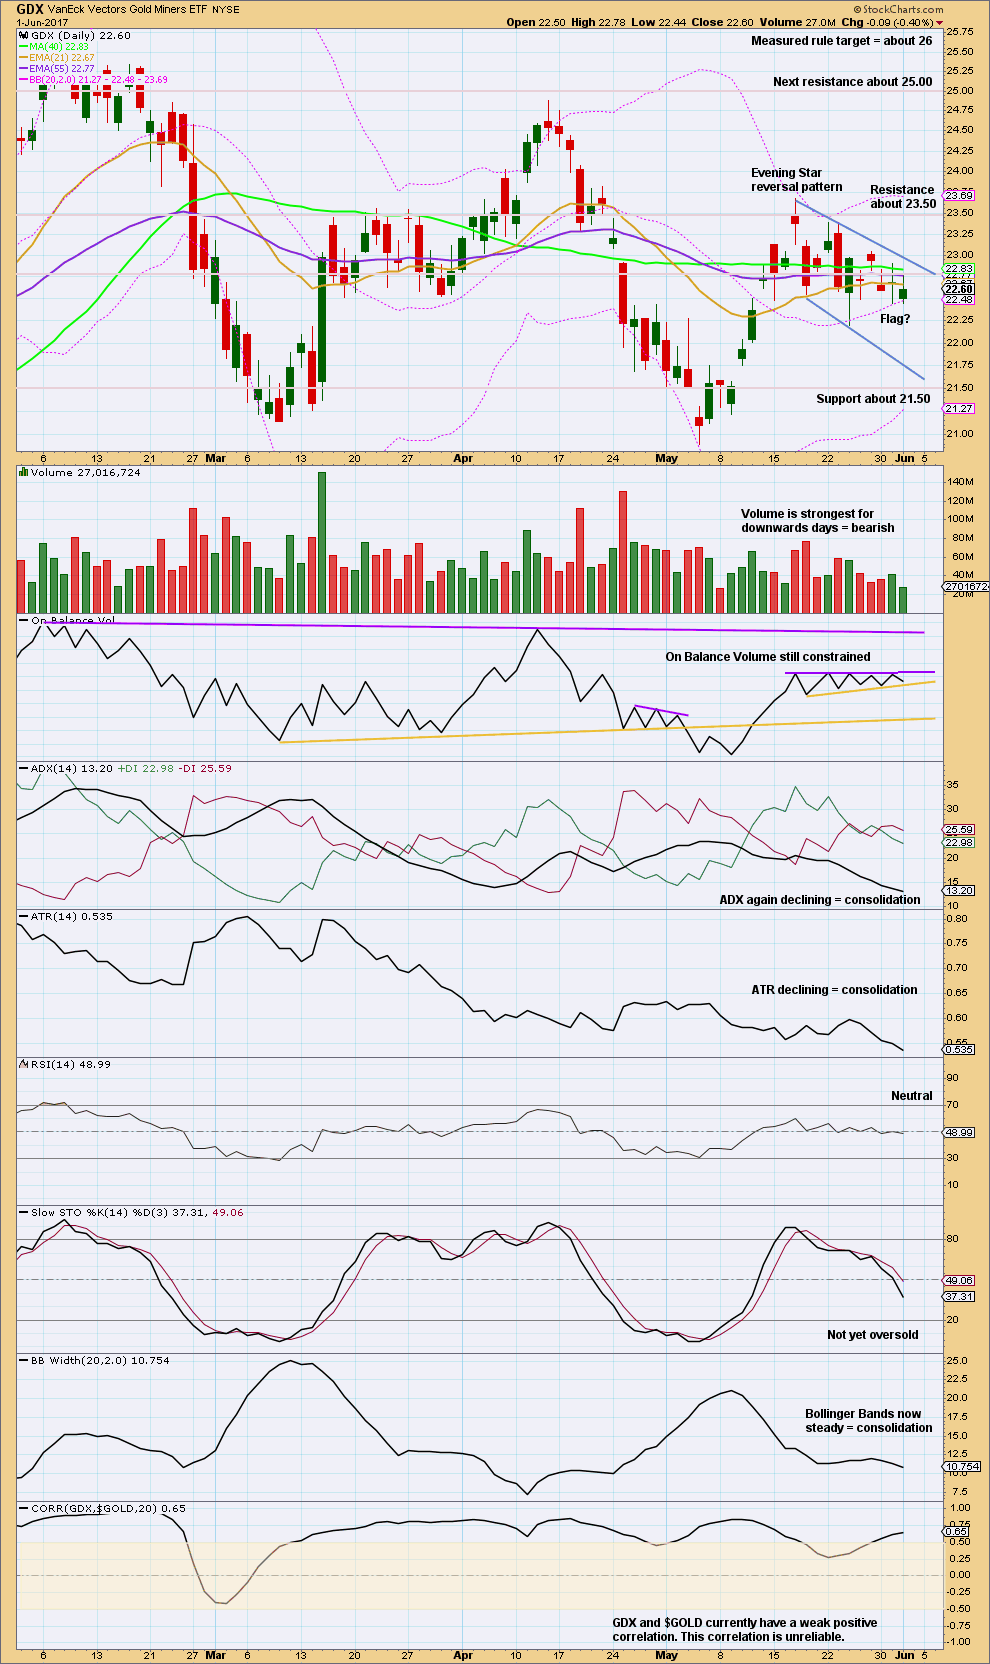
Click chart to enlarge. Chart courtesy of StockCharts.com.
On Balance Volume remains constrained also for GDX.
Both Gold and GDX saw smaller range inside days with lighter volume.
Expect tomorrow to offer strong movement as Non Farm Payrolls are released. The expected direction for a price shock tomorrow is down.
This analysis is published @ 08:51 p.m. EST.
GDX flag breakout and back test?
https://www.tradingview.com/x/MC3Pshlb/
Before I read your comments below, this is what I have so far for the main hourly chart.
It looks like price may come up to test that maroon trend line again. I can’t get it drawn correctly on the hourly chart on an arithmetic scale, so we’ll just have to watch it on the daily on a semi log scale.
I don’t have a target because if minute c = minute a, that would move price just above the invalidation point.
I think the maroon trend line on the daily chart is a better guide to where this upwards move may end.
And this move up had me caught by surprise too 🙁
I saw the channel breached last night and opened a short position, 3% of equity. This morning I have an unhealthy loss 🙁
If price comes up to touch the maroon trend line I’ll have to hold my nose and have another go.
I got ambushed too. I was planning on exiting my spread at the open for a nice profit and then we got that spike. I rolled the spread into next week. This is my second roll of the position as a result of a sudden and unexpected upward move. Banksters never sleep! 🙂
I passed up a few opportunities to close the spread at a profit so it seems as if holding directional trades in this market is still fraught with danger. These whipsaws are really annoying but that is what we have at the moment.
Cot Data GOLD: 5/30/17
Futures only
Long short spread
merchants/producers 21,570 177,812
swap dealers 60,524 87,501 21,657
managed money 175,304 51,171 19,242
other reportables 75,238 32,281 16,307
Do you know what the change is from last week? That’s the important bit.
Nemont mining, Nem, abx and aem aren’t buying this move in gold. Options expiration so should be a few strange occurrences but this has been going on a while….hmmmm
I’d like to see GDX get up to about 24.20, but gold will probably need to head toward 1,300 for that to happen. I think this GDX count would fit well with the triangle count shown below for gold. There are other options though….uggghhhh
https://www.tradingview.com/x/XV7CyrCV/
Hi Alan, Dreamer, Papudi & Others: Gold price has really got all of us wondering what’s next lol… Realistically, if one steps back a little, it appears that Gold price has been scraping the lower end quite systematically: 1214/1217/1227/ 1230s/1240s/1250s/now 1260s whilst slowly putting in higher highs. At CMP 1277 it appears that Gold price is picking up wind in its sails from about 1275 and looking unlikely to dip below 1271-69 to forge on ahead for a break above 1279 targeting 1286-95 range. Hourly RSI may be a tad overbought at 75+ but 4-hourly and daily RSI have enough in it to carry Gold price higher… Lets see what happens; it was my sense on weekly outlook basis for Gold price to be bottomy for a buy the dips. Currently with a high probability of a rate hike in June may keep Gold somewhat subdued but one never knows; there is always expect the unexpected factor lol… GL all & have a great weekend!
Thanks Syed, your thoughts are always good to see. You’re right about the trend, but gold’s going to need a sledge hammer to break through resistance!
lol I think the other way around: Probably needs a sledge hammer to break below 1259/58-56 and a host of moving averages support below there in 1240s….
Good point. We did just get a golden cross 9 days ago… History shows that to be bullish and it doesn’t appear to whipsaw very often.
Or it could remain below resistance and above support = a triangle.
Thanks Syed. Always love your thoughts.
The GDXJ rebalance is scheduled to be complete on June 16th. Maybe it will stabilize and then start going up then?
http://themacrotourist.com//macro/gdxjs-epic-rebalance
Provided the move down in gold, if it occurs is over. Gdx isn’t doing much better. If gold hits a low around that timeframe I think it will be a great buy.
Silver outperforming gold, which is good, but miners still underperforming. Not a good sign so far…
As Lara will attest, there are so many options right now it is difficult to nail it down. Tough for traders.
I still like this option that I shared last week. It fits well with seasonality as it would turn down in the next few days, then start going up strongly, possibly around the time of the June Fed meeting.
https://www.tradingview.com/x/7ZN6Of4P/
First turning point for gold is the 2016 downtrend line. If it breaks that, then 1,300ish. Above that is major resistance around 1,330 where the Magee Bear trendline comes in play.
June seasonality is very bearish for gold. Hard to get too bullish at this point until there is a breakout of overhead resistance. Many different seasonality charts available online. Here is one from Equity Clock.
Interesting times indeed. Gold up, markets up, bonds up.
Gold 2 hour inverse HnS breakout.
It may turn down here??
https://www.tradingview.com/x/wEOG4eCx/
Papudi. I love this. Backtest of neckline and away we go (up). Target around 1354? (That is Minute 3 of my bull count).
Alan
Gold 4 hour chart cloud provided great support. AND if u notice gold has remain above green cloud since it crossed above from red cloud on May 17 with green candle.
Papudi. That is absolutely correct. You might have noticed that I surmised in the 4-hour analysis, at 4:45 am this morning, that “We could see a bounce off the upper cloud boundary”. The good news now is that the tenkan-sen is shadowing the kijun-sen, and could rise above it soon; it was lower this morning hence my pessimism.
many must have missed my post below about bullish chart pattern on daily_ Harami yesterday was inside day. Gold was sitting on top of cloud or just below. It cant get any better.
We will see if gold goes above 1280 that will be BO of NL or it may have already happen. But I like Lara’s def of BO. One candle above and not touching. That may be next week???
Ichimoku Gold Update
Data as at 10:15 am ET June 2
=========================
Gold price spiked to as high as 1273.95 after the release of the NFP Report. On the daily Ichimoku chart, it can be observed that price is right smack at the highest point on the cloud. The upper cloud contour is sloping downwards as of this point forward. Since the tenkan-sen remains above the kijun-sen, I would expect price to hug the upper cloud contour in the near future. This points to a gradual price drop as opposed to a sharp reversal.
So far, price has risen to 1271.32. The Main Count is hanging there by a whisker. The Alternate Count has to be reworked. It is hopelessly out of whack at the moment. I would think that both counts would predict a drop from this point or very near it.
But, if price does continue to rise and challenge 1294.96 as its next project, then it becomes very interesting. The bull may just be fed steroids.
I’ll analyse this after my dinner.
These kinds of out of the blue spikes are generally short lived.
This move up may stick for a bit since some may think the jobs # miss means the Fed may not raise in June.
Need to see if gold can break the downtrend line around 1,280ish. If it can, that opens up a move to 1,300+
Dreamer. I agree with you there. Verne, sorry; generally is not synonymous with always. The job number miss is very significant, at 138K vs expected 184K, together with a scaling back of April and March data.
As of now, price is already at 1276.00. The Main Count is already invalidated; it might be reinstalled with the high as Minor B. But, this price movement fits perfectly well with my “revised” Weekly IV count. I have the high, so far 1276, as subminuette 1 of minuette 1 of Minute 3 of Minor 3 of Intermediate C. Let’s hope this count works. It’s target is 1452.
Yep, was a disappointing jobs number especially after adp. The flip argument is we are down to 4.3 percent unemployment and may be at maximum employment. Maybe there are just no people to fill the jobs….especially hi skilled positions. The .2 percent inflation rate might substantiate that. If we are at an inflationary inflection point the fed would certainly be forced to raise rates and possibly even more than a quarter percent.
At the moment, just before the NFP report, I have the Main Count going for a rise to around 1269 and the Alternate going for a drop to around 1253. Let’s see which one happens.
Wow, I was watching to see if Main would invalidate. And it has. What a move so far.
Good things happen I guess. Hard to see Gold price back below 1268-65 now….?
Brilliant forecast, Syed. That is my exactly my expectation for a drop from the high (circa 1280) before turning up again.
https://www.kimblechartingsolutions.com/2017/06/gold-indicator-nears-first-buy-signal-6-years/
Ichimoku Gold 4-Hourly Analysis
Data as at 4:45 am ET June 2
===========================
On a daily basis, gold’s advance was rejected at the upper boundary of the cloud, again finding a bit of support at the 1260 level as it did on Wednesday. Gold seems to be rangebound between the double top around 1270 and the double bottom at 1260. The tenkan-sen still lies above the kijun-sen from a bullish crossover 5 days ago. A significant amount of bullishness remains in the market, but all this could change with the US Non-Farms payroll report.
The 4-hour cloud shows prices falling below both the tenkan-sen and the kijun-sen. Importantly, the tenkan-sen lies below the kijun-sen, paving the way for lower prices. We could see a bounce off the upper cloud boundary but overall I do not see the pullback being over yet. My expectation is for a drop below 1260, with the first stop being 1256 which is the 61.8% retrace for the last big move from 1195.22 (March 10) to 1294.96 (April 17). If that fails to hold, then a test of the lower cloud boundary at 1245.30 is in play. Incidentally, this coincides with the 50% retrace at 1245.09. Again, how price behaves at the lower cloud boundary is instrumental in determining the next move. A drop below that and a waterfall event gathers momentum. A strong rebound off that will send the market looking to test the high at 1294.96.
On daily basis gold had harami candlestik chart pattern called inside day after a green/white long candle.
That is bullish in near term.
The bulls aren’t giving up yet. The 50MA comes in at 1,256.70 and don’t forget we just got the golden cross 8 days ago, both providing support.
RSI and MACD still have room to move up, although STOC is oversold, but can stay that way for some time. Will be interesting to see the NFP affect.
It is a concern that miners have been underperforming gold. 🤔
Stock Market strength isn’t helping gold either…
I suspect both PMs and the markets are on the verge of strong reversals. Gold has been staunchly defying selling pressure, and a sustained market rally from these low levels in the VIX would be unusual. I am exiting short positions in Gold and long positions in the market at the open and switching trades.