
Upwards movement was unexpected and invalidated the hourly Elliott wave count.
Summary: Some sideways movement to remain above 1,269.45 and then another short upwards movement to touch the maroon trend line is expected next week. If the trend line is touched, it should offer very strong resistance; expect a sharp downwards reaction there.
New updates to this analysis are in bold.
Last historic analysis with monthly charts is here, video is here.
Grand SuperCycle analysis is here.
MAIN ELLIOTT WAVE COUNT
For clarity I have decided at this time it may be best to publish on a daily basis weekly charts I, II and IV. Both weekly charts I and II expect a zigzag down to complete and the difference is in the expected depth. Weekly chart IV has a very low probability and will only be given serious consideration if price makes a new high above 1,294.96.
WEEKLY CHART I
Click chart to enlarge.
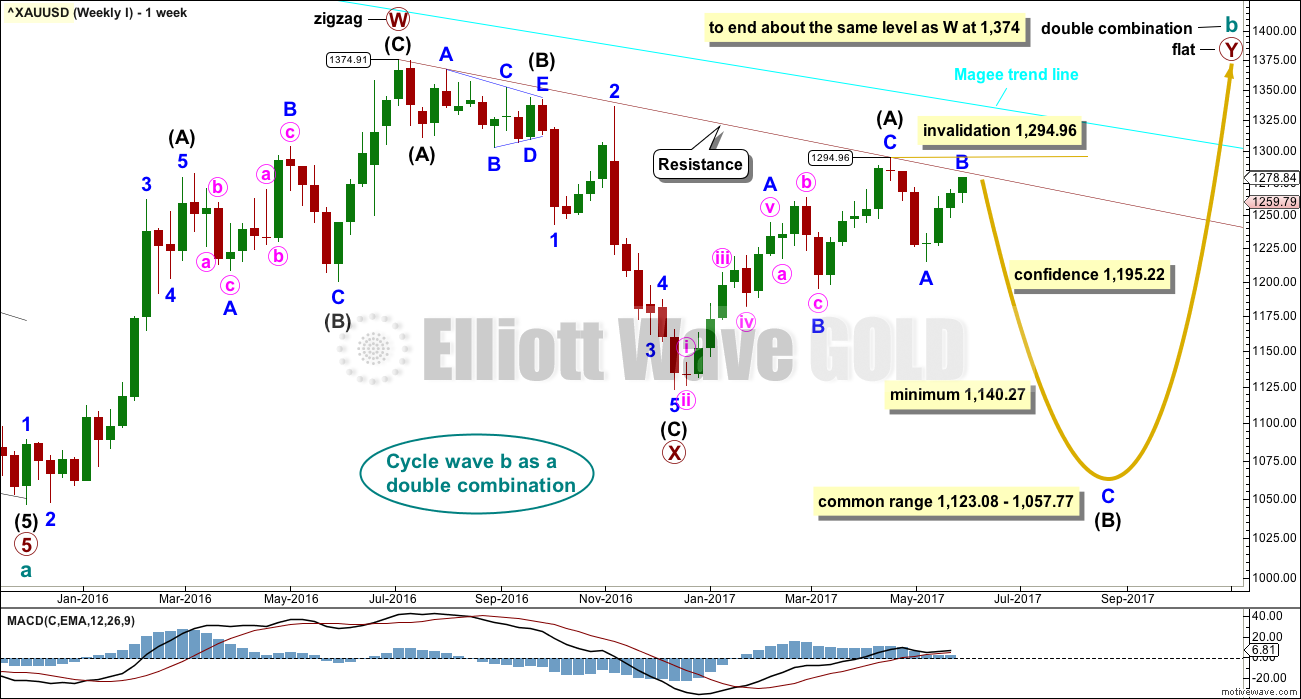
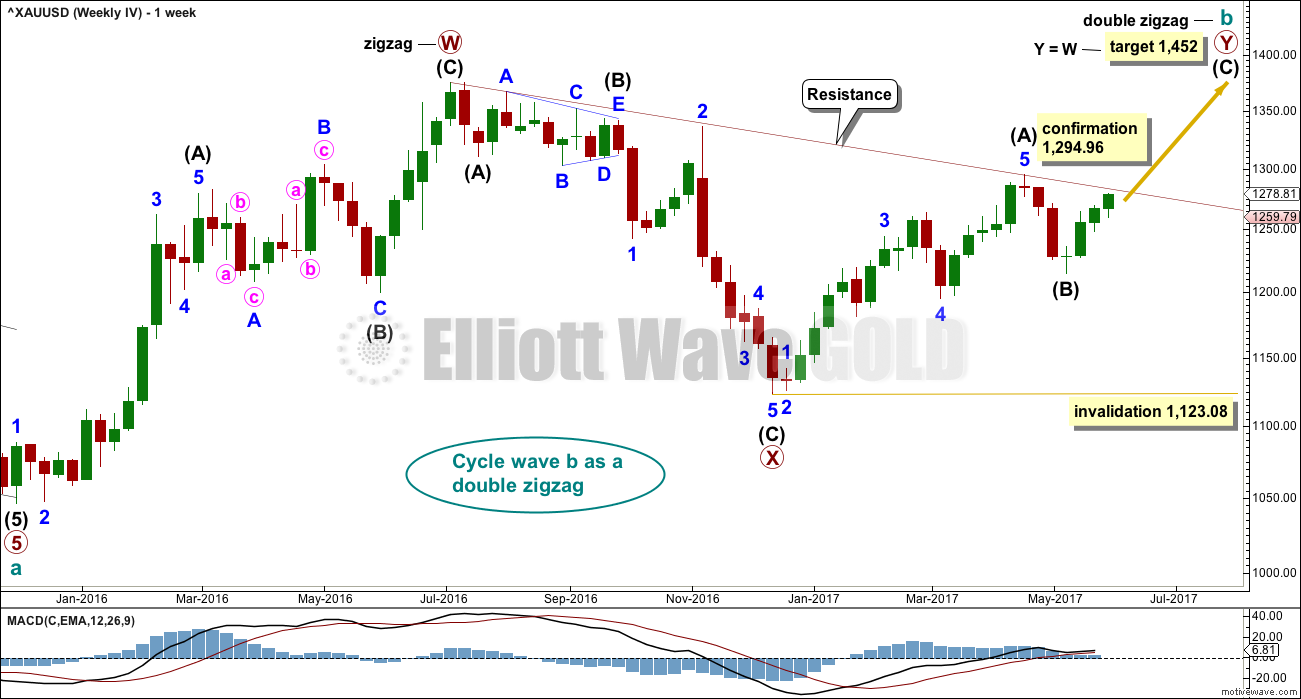
Combinations are very common structures. Cycle degree waves normally last one to several years, and B waves do tend to be more time consuming waves than all other waves. Given these tendencies the most likely scenario at this point may be that cycle wave b is an incomplete double combination.
The first structure in the double labelled primary wave W fits as a zigzag. This upwards movement will subdivide as either a three (zigzag) or a five (impulse). It does have a three wave look to it.
The double is joined by a deep three in the opposite direction labelled primary wave X, which is a 0.77 depth of primary wave W. X waves within double combinations are normally very deep; this one looks right.
The second structure in the combination may be either a triangle or a flat correction. Both of these structures have A waves which subdivide as threes.
At this stage, the upwards wave from the low in December 2016 to the high in April 2017 does now look best and subdivide best as a completed zigzag. This may be intermediate wave (A) of a flat correction or a triangle. Because a triangle for primary wave Y would look essentially the same as the second weekly chart below, only a flat correction is considered here. The most common two structures in a double combination are a zigzag and a flat.
This wave count follows the most common scenario and has the best fit.
Within the flat correction of primary wave Y, intermediate wave (B) must retrace a minimum 0.9 length of intermediate wave (A) at 1,140.27. The most common length for intermediate wave (B) is from 1 to 1.38 times the length of intermediate wave (A), giving a common range from 1,123.08 to 1,057.77.
Intermediate wave (B) may subdivide as any corrective structure, but the most common structure for B waves within flats is a zigzag. At this stage, on the hourly chart it looks like a five down labelled minor wave A is complete, which would indicate intermediate wave (B) is a zigzag subdividing 5-3-5.
The daily and hourly charts will follow this weekly chart. That does not mean the other three weekly charts aren’t possible, they are, but the number of charts must be kept reasonable on a daily basis.
The Magee bear market trend line is added to the weekly charts. This cyan line is drawn from the all time high for Gold on the 6th of September, 2011, to the first major swing high within the following bear market on the 5th of October, 2012. This line should provide strong resistance. If that resistance holds, then the second weekly chart would be correct.
Anchor points for the maroon trend line are now added to this weekly chart. Draw it from the high in early July 2016 to the high in April 2017. This trend line is not too steep, has been tested six times, and is long held. It offers very strong technical significance. It is expected now that upwards movement early next week will come up again to test resistance at this line. Copy it over to daily charts.
WEEKLY CHART II
Click chart to enlarge.
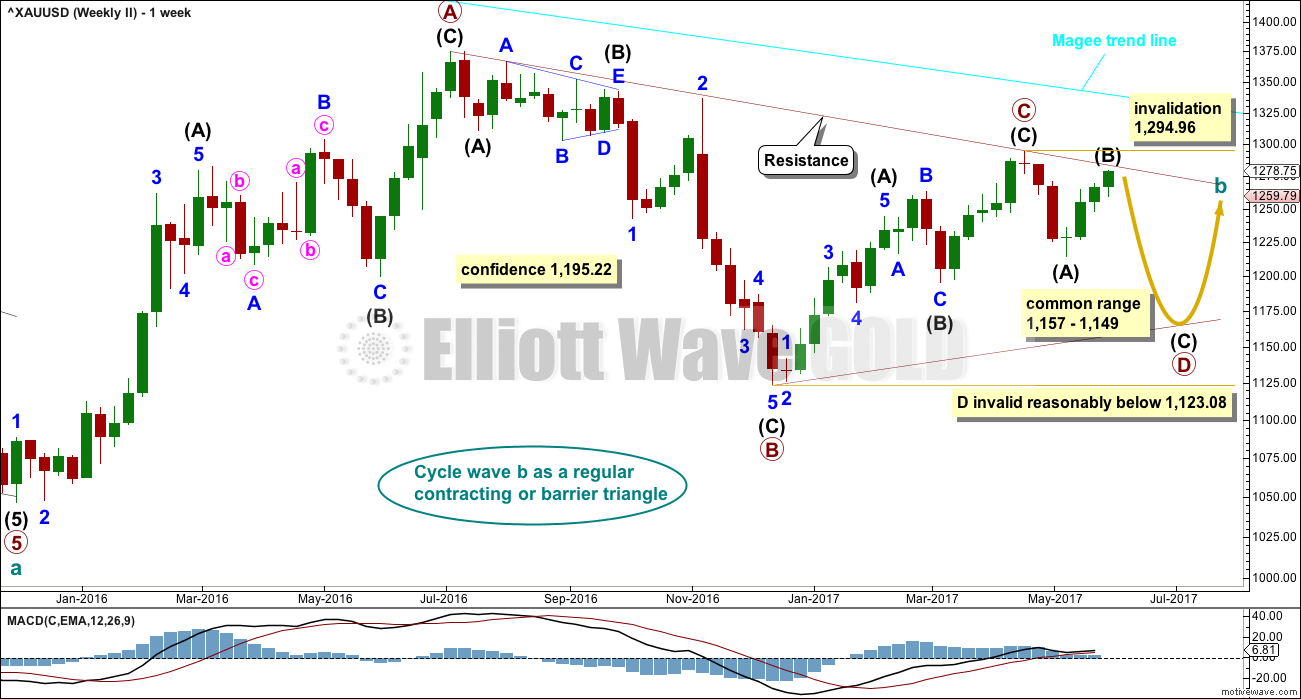
What if cycle wave b is a triangle? This is also entirely possible. Triangles are not as common as double combinations, but they are not uncommon.
Within the triangle, primary waves A, B and C are all single zigzags. One of the five subwaves of a triangle normally subdivides as a more complicated multiple, usually a double zigzag. This may be what is unfolding for primary wave D. It may also subdivide as a single zigzag.
Primary wave D of a regular contracting triangle may not move beyond the end of primary wave B below 1,123.08.
Primary wave D of a regular barrier triangle should end about the same level as primary wave B at 1,123.08, so that the B-D trend line is essentially flat. What this means in practice is that primary wave D may end slightly below 1,123.08 and the triangle would remain valid. This is the only Elliott wave rule which is not black and white.
Thereafter, primary wave E should unfold upwards and would most likely fall a little short of the A-C trend line. If not ending there, it may overshoot the A-C trend line. Primary wave E may not move beyond the end of primary wave C above 1,294.96.
Triangles normally adhere very well to their trend lines. Occasionally, price may overshoot the trend lines but when this happens it is not by much and is quickly reversed. The upper A-C trend line should offer very strong resistance at this stage if cycle wave b is unfolding as a triangle. This trend line is added to the daily chart below.
At this stage, the structure on the hourly chart is still the same for both this weekly wave count and the first weekly wave count: a zigzag downwards is unfolding. However, they now diverge in how far down the next wave is expected to go. This second weekly wave count expects a more shallow movement to not end reasonably below 1,123.08.
DAILY CHART
Click chart to enlarge.
This daily chart will suffice for both weekly charts above, although the labelling follows weekly chart I.
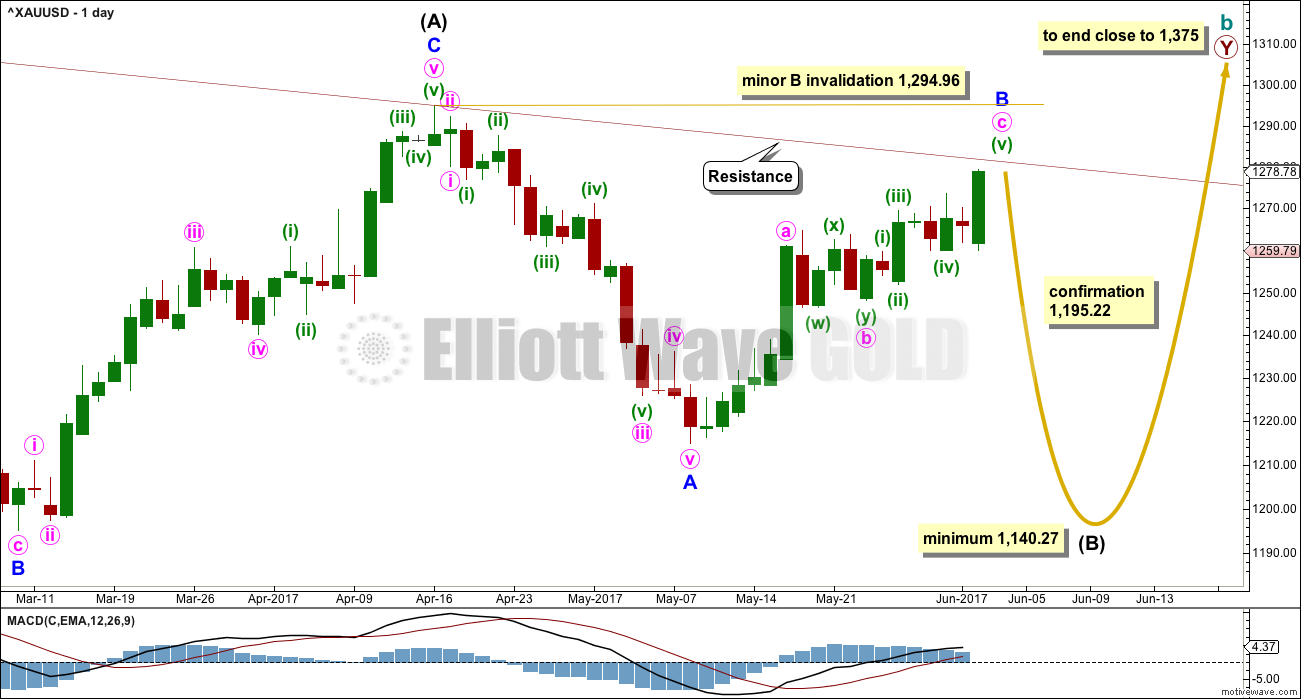
Both weekly charts expect a zigzag downwards from the high on the 17th of April, 2017, at 1,294.96. (It may also turn out to be a double zigzag. For now a single only will be charted but a double will be kept in mind). Weekly chart I expects a deep zigzag for intermediate wave (B) to a minimum at 1,140.27. Weekly chart II expects a zigzag down for primary wave D to not move below 1,123.08 and most likely fall well short of that point.
The daily chart follows the expectations for weekly chart I, but the structure for weekly chart II would be exactly the same at this stage.
Within the flat correction of primary wave Y, intermediate wave (B) must retrace a minimum 0.9 length of intermediate wave (A) at 1,140.27. The most likely corrective structures to achieve the deep correction required for B waves within flats are single or multiple zigzags. These begin with a five, then a three in the opposite direction.
Minor wave A is complete. Minor wave B has again moved higher; the structure is now incomplete. It may move a little higher early next week and may end if price again comes to touch the maroon trend line, which is copied over from weekly charts.
Minor wave B may not move beyond the start of minor wave A above 1,294.96.
A target may again be calculated for intermediate wave (B) to end when minor wave B is complete. That cannot be done today. It may be able to again be done early next week.
MAIN HOURLY CHART
Click chart to enlarge.
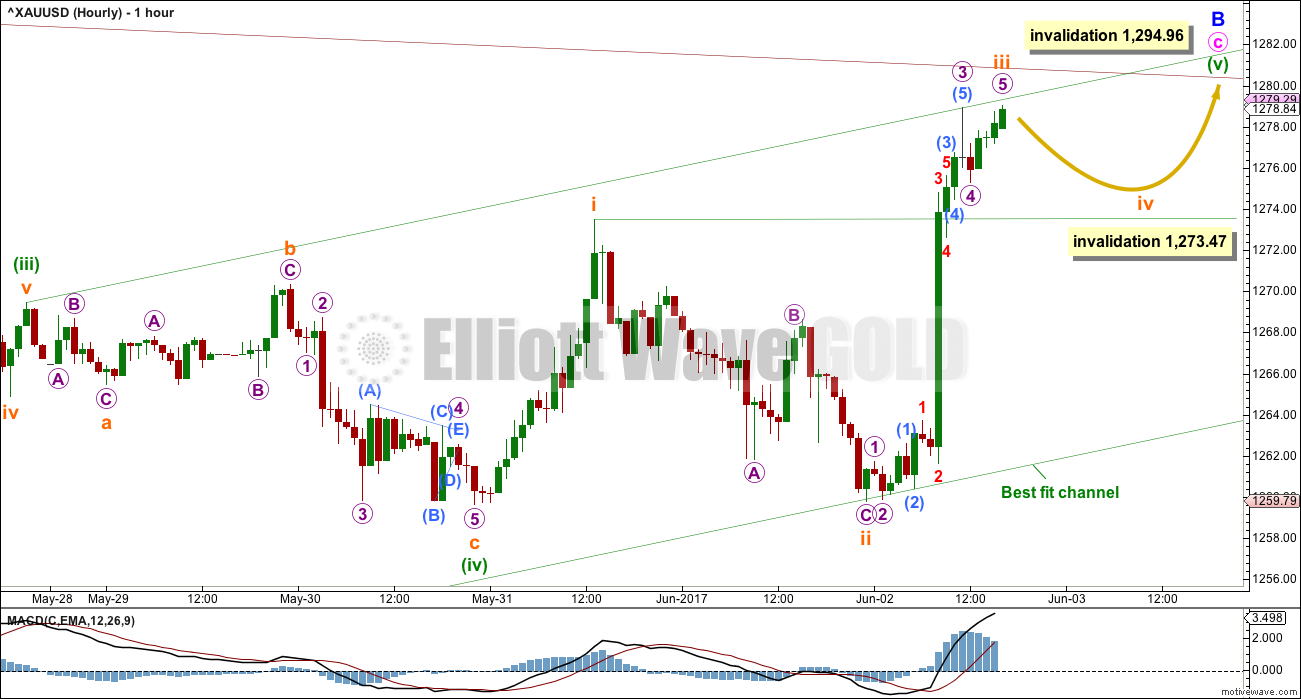
Minor wave B is a zigzag. If within it minute wave b was a double combination ending at the low of 1,248.01 on the 24th of May, then minute wave c is unfolding as a five wave impulse and today is incomplete.
Within minute wave c, minuette waves (i), (ii), (iii) and (iv) may be complete. Minuette wave (v) may be unfolding as an extension. Minuette wave (v) has passed equality in length with minuette wave (iii), so it may not exhibit a Fibonacci ratio to either of minuette waves (i) or (iii).
Within minuette wave (v) so far, subminuette waves i, ii and iii may be complete. Subminuette wave iv may not move into subminuette wave i price territory below 1,273.47.
If this main hourly wave count is invalidated with a new low below 1,273.47, then use the alternate below.
Minuette wave (v) may come to end when price touches the maroon trend line, which is copied over here to the hourly chart.
ALTERNATE HOURLY CHART
Click chart to enlarge.
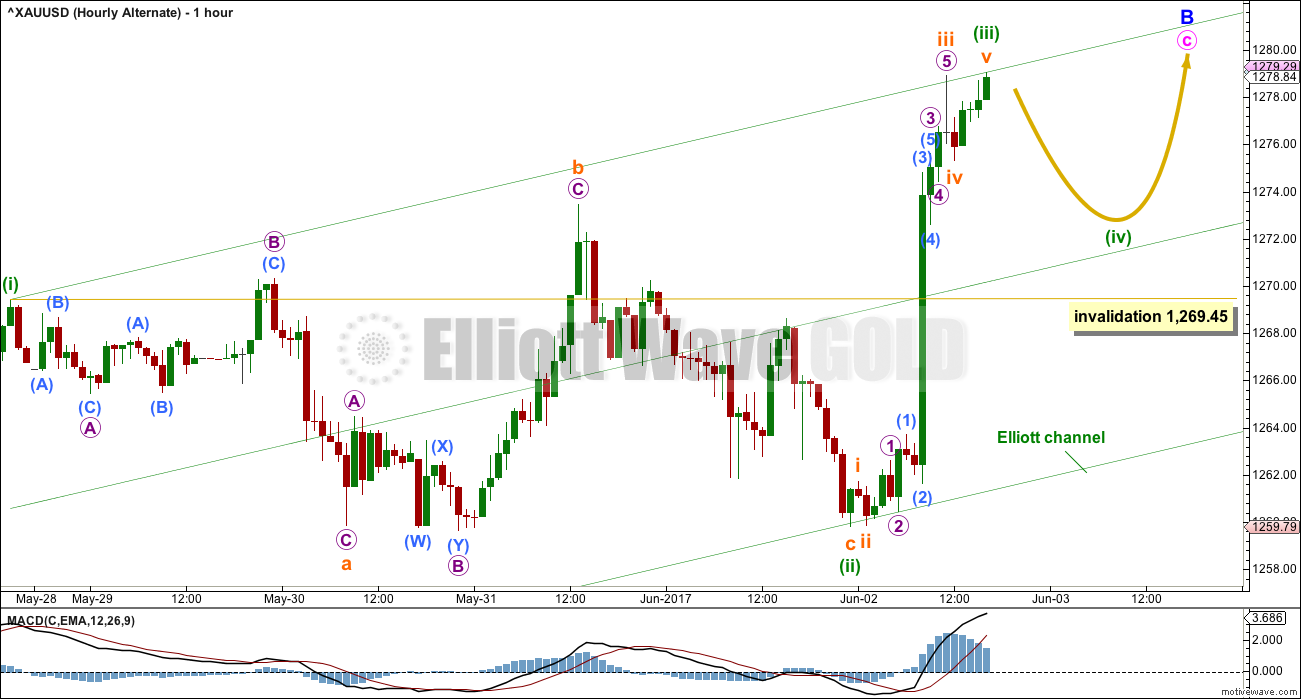
This hourly chart reverts to seeing minute wave b as a triangle.
Minor wave B is a zigzag. If within it minute wave b was a triangle ending at the low of 1,251.82 on the 25th of May, then minute wave c is unfolding as an impulse and today it incomplete.
Within minute wave c, minuette waves (i), (ii) and now (iii) may be complete. Minuette wave (iv) may not move into minuette wave (i) price territory below 1,269.45.
Minuette wave (ii) fits as an expanded flat correction, and within it subminuette wave c ends only slightly below the end of subminuette wave a. A truncation is avoided.
This wave count has a better fit than the main wave count in terms of subdivisions. Both wave counts expect a sideways movement for a small fourth wave correction to unfold early next week. It may show up on the daily chart as one or more red candlesticks or doji. Thereafter, both wave counts expect a final fifth wave up to end when price comes to touch the maroon trend line again.
Only the invalidation points differ.
If next week sees a new low below 1,269.45, that shall provide some price confirmation of a trend change.
WEEKLY CHART IV
Click chart to enlarge.
What if the bull market beginning in December 2015 remains intact? Price has essentially been moving sideways since that date, so all possibilities should be considered.
This wave count requires confirmation above 1,294.96. That would invalidate the first three weekly charts (the third is seen in historic analysis only).
It is possible that cycle wave b is continuing higher as a double zigzag. However, double zigzags normally have brief and shallow X waves. The purpose of the second zigzag in a double (and the third when there is one) is to deepen the correction when price does not move deep enough in the first (or second) zigzag. Thus double (and triple) zigzags normally have a strong and clear slope against the prior trend. To achieve this look their X waves normally are brief and shallow.
In this case, primary wave X is neither brief nor shallow. It is a 0.77 depth of primary wave W and lasted 0.74 the duration of primary wave W. Overall, this does not have a typical look of a double zigzag so far.
This wave count also must see the rise up to the high labelled intermediate wave (A) as a five wave impulse, not a three wave zigzag. This looks a little forced, so it reduces the probability of this wave count.
This wave count should only be used if confirmed with a new high above 1,294.96. Low probability does not mean no probability, but should always be given less weight until proven.
TECHNICAL ANALYSIS
WEEKLY CHART
Click chart to enlarge. Chart courtesy of StockCharts.com.
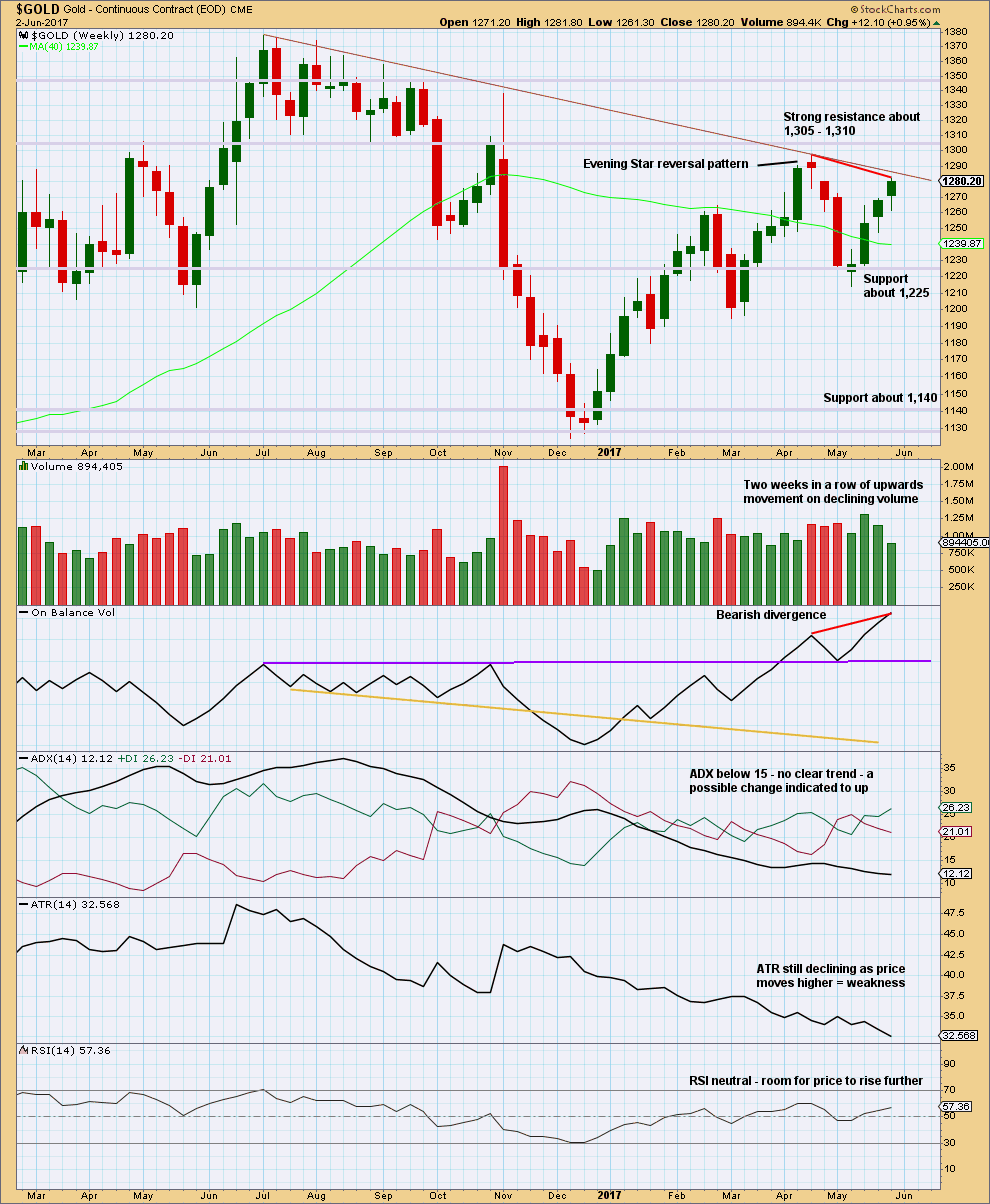
This week completes an Advance Block candlestick pattern. This is a three candlestick pattern; three green candlesticks with the second and third candlesticks showing signs of weakening. However, this pattern does not come within a mature upwards trend, so the warning is weak and further weakened by the longer lower wicks on the last two candlesticks, which are bullish.
Declining volume along with declining range is bearish.
Strong divergence between price and On Balance Volume is bearish.
There is still room for price to rise further, but the short lived upwards trend at this time looks weak.
The maroon trend line is added to this weekly chart, using the same anchor points as the Elliott wave charts.
DAILY CHART
Click chart to enlarge. Chart courtesy of StockCharts.com.
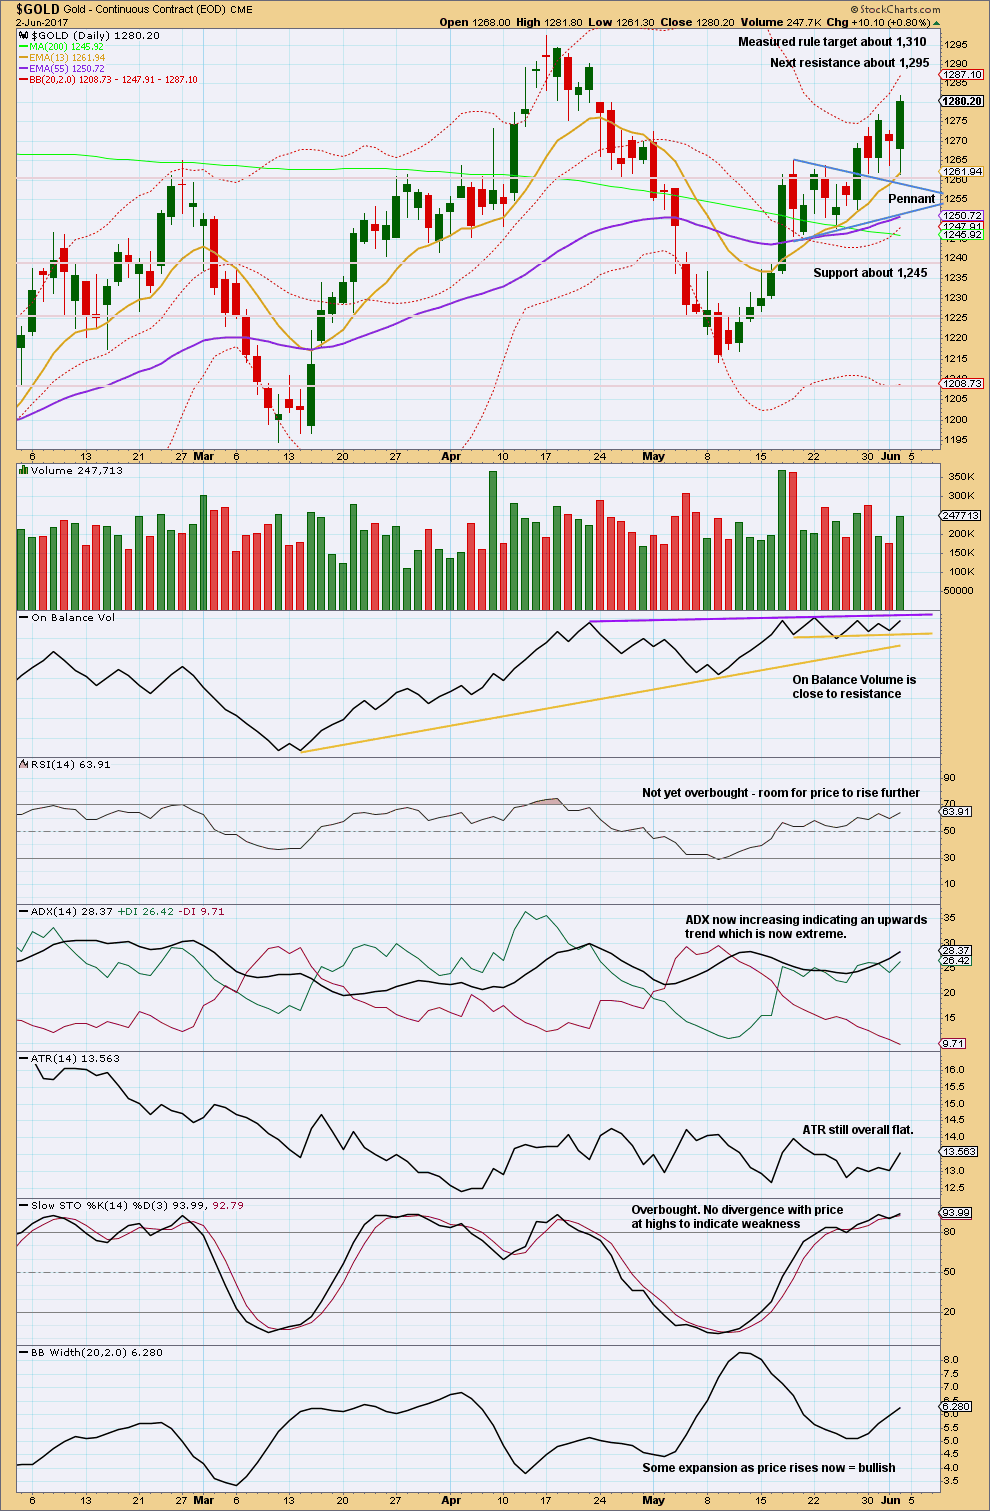
The pennant pattern suggests an upwards breakout (which happened) to be followed by more upwards movement to the target at 1,310.
Friday’s strong upwards session came with some increase in volume. Volume is still lighter than prior recent downwards days though.
The long lower wick on Friday’s candlestick is bullish.
On Balance Volume is close to resistance. There is some leeway in exactly how the purple resistance line may be drawn. It is adjusted very slightly today to be as conservative as possible. This trend line along with the trend line for price on the daily and weekly Elliott wave charts may serve to show when and where upwards movement ends next week.
With ADX now extreme, it should be expected the upwards trend could end soon.
GDX
DAILY CHART
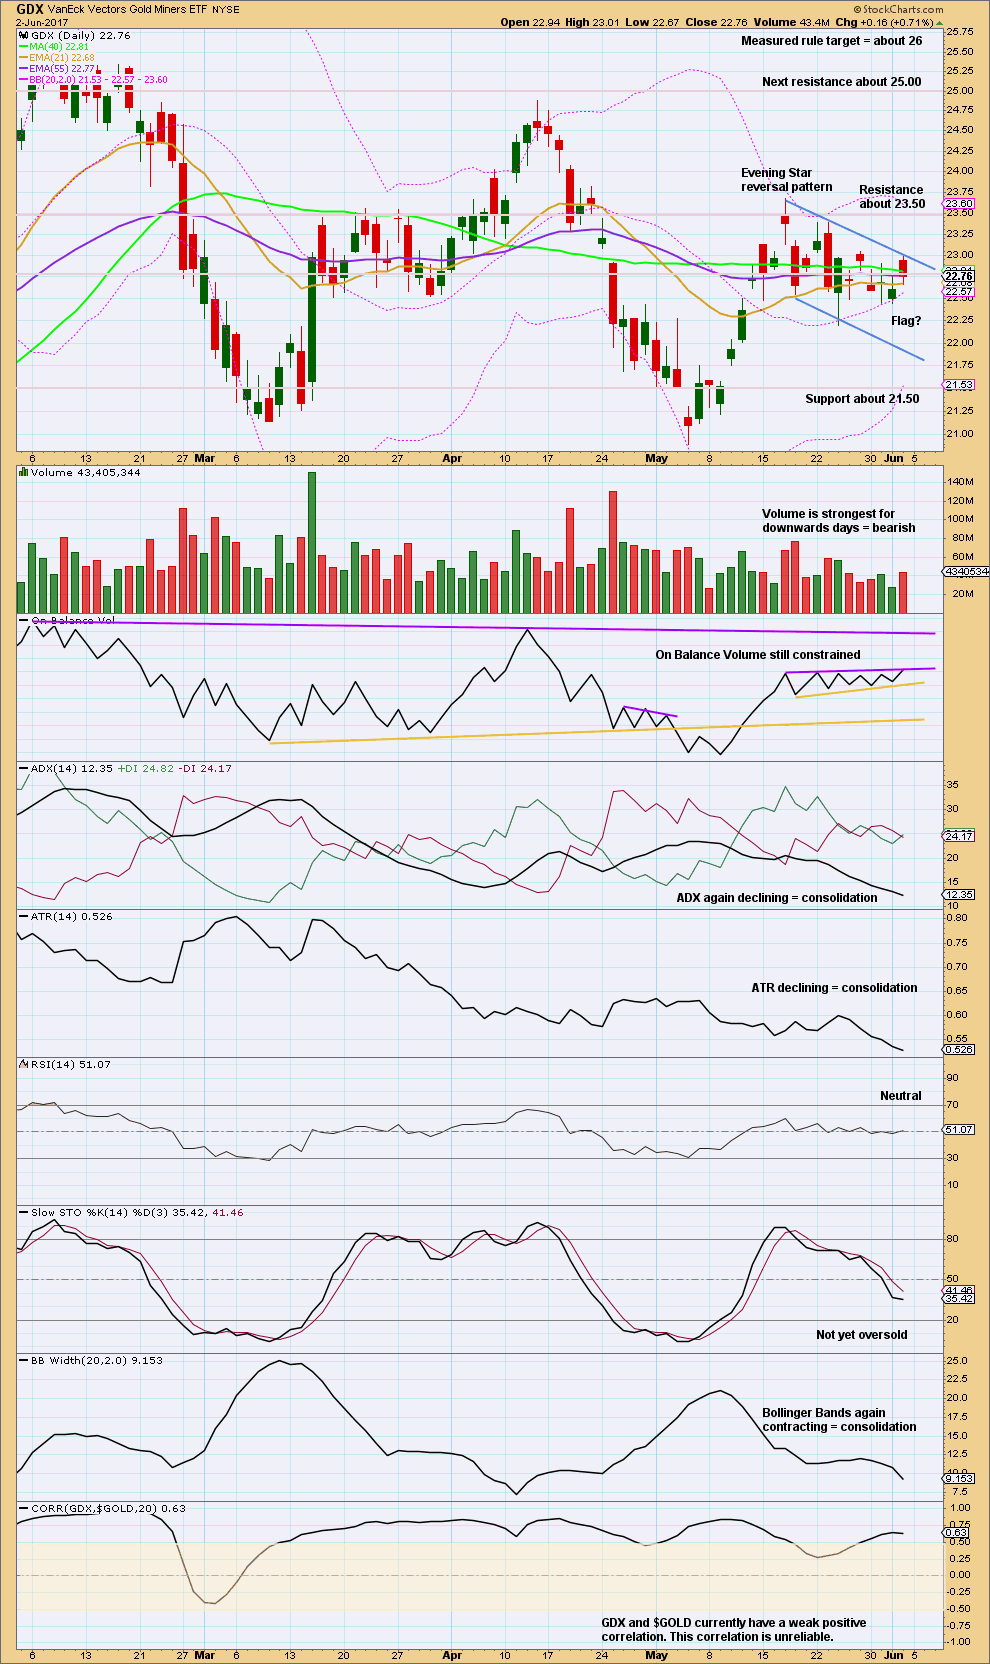
Click chart to enlarge. Chart courtesy of StockCharts.com.
GDX led the way for the last two turns in price. At the end of this week, it may again be signalling what is to come next.
While Gold had an upwards week, GDX has essentially moved sideways and cannot break out of its flag pattern. Price today closed within the pattern. The trend lines for the possible flag pattern are slightly adjusted.
There has not yet been a breakout by On Balance Volume. Again, there is a little leeway in exactly how the purple resistance line may be drawn. It is adjusted very slightly today to be as conservative as possible.
GDX is clearly still consolidating. During the consolidation, it is two downwards days which have strongest volume suggesting a downwards breakout is more likely than upwards.
This analysis is published @ 07:39 p.m. EST.
Today was the first time in a while GDXJ outperformed gold and GDX in a green gold day as well as closing strong. It’s a little thing but it peaks my curiosity. Did anyone see the JPY/USD move tonight? Could that be something as well?
I’m swapping the hourly charts over and I’m going to label minute b as a triangle on the daily chart.
It makes zero difference to the short nor mid term outlook, but it has a better look.
I expect a small fourth wave has completed or may continue as a double flat or double combination.
Then a final fifth wave.
If the target is wrong it may be too high. It expects an overshoot of the maroon trend line. That’s okay, but if it’s breached by a full daily candlestick above it then the main count switches over to the very bullish count. That’s the line in the sand between bear and bull.
Ichimoku Gold Update
Data as at 6:05 am ET June 5
========================
Gold price has broken out above the cloud in the Daily Chart (not shown). At the 1-hour time frame, the tenkan-sen had climbed much higher compared to the kijun-sen, a sign of increasing bullish appetite. Notice also that the cloud is turning from red to green around market opening hours, indicating that investors are given the licence to chase the previous high of 1294.96 recorded on April 17. Given the strong run-up since last Friday, I do think that prices would need a little breather before continuing the race. The price rise so far today is a continuation of micro 5 of subminuette 3. A shallow respite in subminuette 4 is expected to possibly the 1275 level, resistance turned support. A bounce from there would lead to renewed vigour for the final lap of subminuette 5. This ought to be the script for the rest of the day.
Whether prices can break 1294.96, I would think a larger correction is then in order. If not invalidated (by a break above), the Main and Alternate Counts stipulate a waterfall to at least 1140. On the other hand, the bullish Weekly IV sees a much more gentle drop to the 1260 area, using it as a launching pad for the long-delayed rocket. The worst it could go is a test of 1256 which is the 38.2% retrace for the last big move from 1195.22 (March 10) to 1294.96 (April 17). My strategy then would be to nibble in short at the high, and then to load the truck should 1256 be found wanting; if otherwise, I would jump ship to join the astronauts. But, that’s just a preview of the story after today.
Another look at a possible 1,500 target
Dreamer. I really love this guy. Let’s hope he (or she) really is as the namesake implies: the golden touch. It is much more easier to profit in a bullish environment than in a bearish one because of all the geopolitical concerns and investor fear of the stock market bubble as well as concerns for the future of the US dollar. All it takes is the first inklings of a thermonuclear war with North Korea or a concerted effort at an embargo of the US due to increasing hatred for the shenanigans of one wacky President.
Yep, that 1,500 🎯 makes some sense based on TA and EW, although I’m not going to get too excited until the Magee Bear Market trendline is properly broken…
Alan: “shenanigans of one wacky President” please keep your political opinions to yourself. This board is supposed to be about gold.
John – Do you realize how valuable Alan’s input is to this site. My goodness, his information is invaluable.
Clearly, you’re a Trump supporter and that is perfectly acceptable. However, you have to agree that Trump’s actions impact gold so technically speaking, gold and Trump are related.
The political landscape, whether it’s Comey’s testimony, Trump, Brexit, all play a role in impacting the price of the gold.
I believe that Alan was simply trying to point out this delicate landscape and in no way trying to change people’s views.
I agree. Lara has actually given permission to express political views so long as it is done politely and with respect for those who may be on the opposite side. I think it is a very sad day when we all become so thin-skinned that we take immediate umbrage at any and everything somebody says that we disagree with. Come on folks, lighten up a little.
I happen to be a Trump supporter and that comment hardly registered. The man is indeed a bit wacky! 🙂
Yes, discussion on all topics, including politics, is fine.
We’re all adults here.
We can discuss whatever we like so long as it’s done respectfully and very politely. Speak here as you would to your beloved Grandmother. With the utmost respect.
This membership of Gold is truly global. Those of us outside the USA may have a very different view of Trump as our POV and information we receive is very different.
Thanks Stephen for interceding. I greatly appreciate it.
John, if I had offended sentiments I do apologise unreservedly. I have no political bias nor have I any hatred for the man. On the contrary, I think that he is doing a great job for America. It’s just that he is ahead of his time, and many people simply cannot catch up. Added to the mix of rancour by women who feel slandered as well as sympathisers of various causes he has been dead against, and you have a recipe for disgruntled masses. But, as traders we should rise above these feelings and do what we are in for: trade.
I think I echo the feelings of many people trading in gold, as well as their frustrations. Whenever the picture becomes clearer, some controversial news about Trump would come by and create some chaos. This is not a one-off affair, and many of the things he said or did have been unique, and are unbelievably highly unpredictable. Well, he may be a genius. Mortals like me do not see that far nor distinctly. That’s why he’s the President and I’m the peasant. I sympathise with Lara. She has switched her Main Count almost daily in the last couple of weeks. For all you know she may suddenly wake up one day to find that the Main Counts are all invalidated. The market has just switched to bull. Volatility is a great no-no to traders, especially those who do not scalp. Abrupt changes can instantaneously transform a profitable leveraged position to one that sinks underwater. Even unleveraged accounts are not spared. It’s just that we are asking for a more conducive trading environment. That’s one reason I feel committed to post what I see happening in the market, and hopefully all of us can extricate ourselves from the whipsaws in the market.
Alan, Thanks for the clarification and apology. I had a short fuse before the Kathy Griffin thing. Now, I’m not going to take it anymore. Sorry for calling you out, this is a poisonous political environment right now.
John. No issue there.
I myself detest Kathy Griffin. I was appalled by her Emmy acceptance speech in 2007. She was sacrilegious in her profane utterance desecrating the Lord. I wonder why no action was taken against her. The obnoxious character she showed doesn’t deserve any award. Now, 10 years later, she richly deserve her just desserts.
Alan, you are a gentleman and a scholar! 🙂 🙂
Verne. Thank you. You are too kind. I don’t really deserve that accolade.
Lara: “Minuette wave (v) may come to end when price touches the maroon trend line, which is copied over here to the hourly chart.”
Gold is close to or above the maroon trend line. If fold is following this count it should turn here soon.
A critical juncture for gold/silver/ mining sector.
Yep. Price is so close… almost right at that trend line.
I am following inv HnS on daily/weekly and 4 hour period.
Gold is trading at NL of daily inv HnS after BO from 4 hour inv HnS within the bigger HnS.
https://www.tradingview.com/x/B0q0a53O/
Gold and silver appears to be very bullish???
Lara, I’m curious why your daily and hourly charts are ignoring what appears to be a “B” wave triangle. I realize that it doesn’t affect the overall count for Weekly Chart I & II, but It could actually even lower the probability of the more bullish Weekly Chart IV count since it would be in a 2nd wave position. Thoughts / reasoning? Thanks
The second hourly chart does look at minute B as a triangle rather than a combination. But I’ve not zoomed out enough to see that.
I think I will be relabelling it on the daily chart as a triangle, because I agree with you, it looks rather obvious doesn’t it.
👍
End of Week Analysis
Data as at the close of June 2
=========================
Gold markets fell during the week initially but found good support at the 1260 level to turn around and form a bullish hammer candlestick pattern. It rallied strongly after the release of a less than stellar jobs report on Friday. Breaking out of the staunch 1270-1275 resistance area, it is raring to have a go at the 1294.96 high of April 17. Grinding slowly into the market close, it seems that investors were not eager to take profits off the rally, preferring to hang on to their positions over the weekend. That itself is a sign of confidence in the ongoing bullish onslaught.
The Daily Ichimoku Chart shows gold straddling the top cloud boundary. The tenkan-sen sits above the kijun-sen from a bullish reversal 5 days ago. There is no indication of a let up: the market remains bullish. A clean break above the cloud would instil confidence that the bull market has returned, but we are not exactly there yet. Going forward, we should still see bullish pressure at least early next week. The market continues to have a lot of volatility built in due to uncertainty, particularly the June rate hike which is now expected to be tempered in the wake of the disappointing NFP. There are also geopolitical concerns such as the British voting on June 8 as well as the simmering North Korea tensions. All said, the market looks likely to continue to try to grind higher until such time when it runs out of steam and falls back to relieve some pressure.
The 1270-1275 region would be resistance turned support, hindering a stronger pullback. I would expect the bullish fervour to launch gold prices toward 1294.96. It may not be able to break that strong resistance at the first go, but with persistence it might. With every price rise, the head-and-shoulders pattern becomes less likely, and if it becomes voided with a rise above the “head” at 1297.40, the bulls will come out charging.
Again, I have to post the chart as a comment to circumvent the duplicate file problem.
No issues posting charts here. Things that make you go crazy 😵
A VIEW: With bullish momentum in Gold prices’ favor, got to agree that an upside move to look out for targeting 1292-95-98 range (with possibly 1306 in extension); however expecting Gold price to top during the week with a pullback to look out for on Monday! Lets see how this plays out. On the other hand, if a series of Homing Pigeons during Gold price decline to 1214 are in play then Gold price would be heading for the tree tops lol… Oh well, go to take each day as it comes 🙂 GL all.
Alan: “the disappointing NFP”
Prez is celebrating and taking credit for booming economy.
Please I do not want to hijack this forum for Political views. No further comments.
The same problem of “duplicate post” persists. I’ll see if the system can reset tomorrow before posting again.
Haven’t shown this optimistic chart in awhile. Note that Gold and Silver are on the verge of a breakout. Next week should be interesting.
https://www.tradingview.com/x/fF4e01Ge/
A few smart people are thinking the FED is going to “blink” on rates. If that happens, those support and resistance levels will be no more methinks….
Daneric’s Gold count big picture
Daily
What is the target for (B)? Appears 1450 to 1500.
Same as Lara’ s bullish count.
He’s had the target for some time now. It’s the “thin” trading range where the middle of the 3rd wave down is. If we break the bear trendline, that target may have a chance.