
Price moved sideways and then higher, which was what was expected from the Elliott wave count.
Summary: A trend change is expected here; price is at very strong resistance. The target for the next wave down is either 1,157 to 1,149, or 1,140 or below.
If the next session prints a full daily candlestick above and not touching the maroon trend line, be prepared to switch quickly from bear to bull and enter long.
Always use a stop. For shorts it may be above the last swing high at 1,294.96. Do not invest more than 1-5% of equity on any one trade.
New updates to this analysis are in bold.
Last historic analysis with monthly charts is here, video is here.
Grand SuperCycle analysis is here.
MAIN ELLIOTT WAVE COUNT
For clarity I have decided at this time it may be best to publish on a daily basis weekly charts I, II and IV. Both weekly charts I and II expect a zigzag down to complete and the difference is in the expected depth. Weekly chart IV has a very low probability and will only be given serious consideration if price makes a new high above 1,294.96.
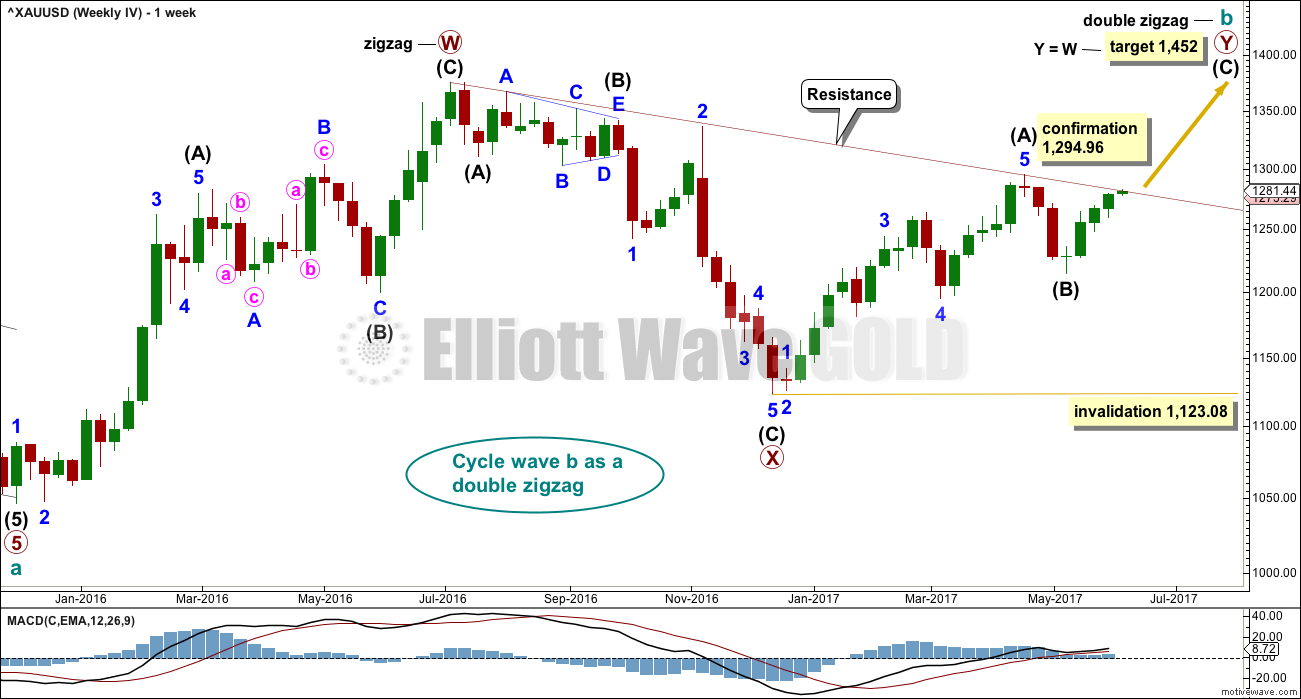
WEEKLY CHART I
Click chart to enlarge.
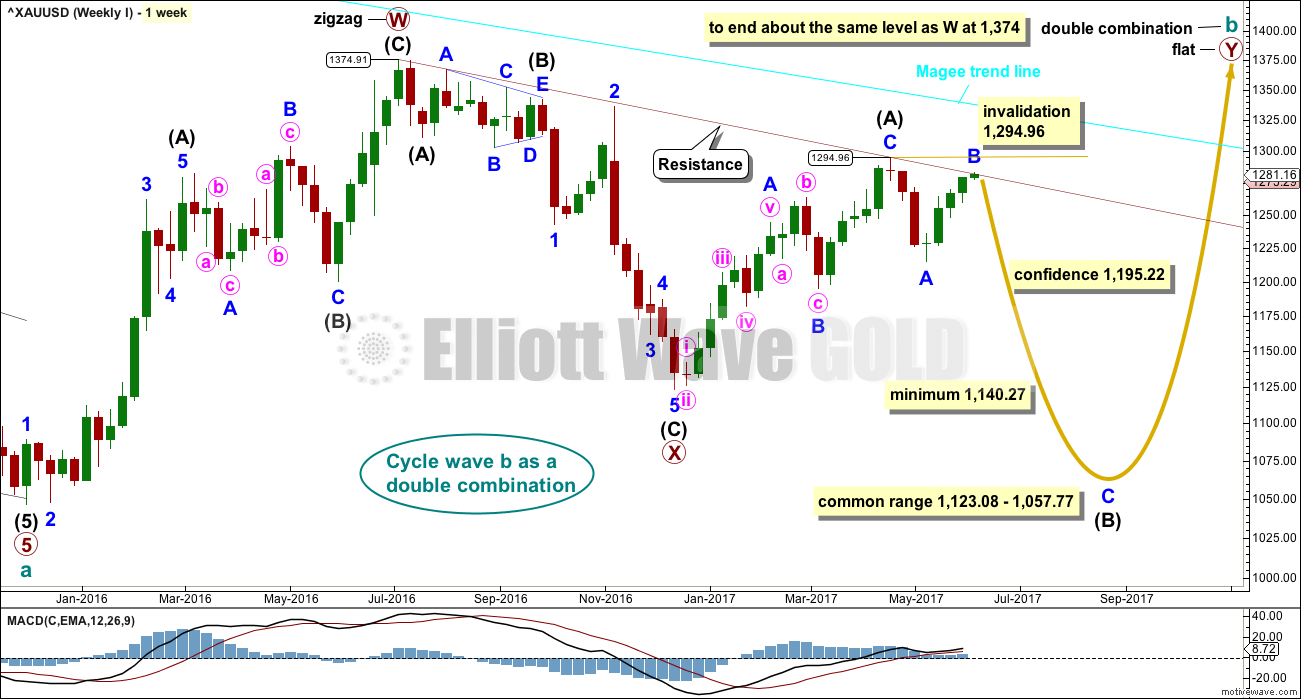
Combinations are very common structures. Cycle degree waves normally last one to several years, and B waves do tend to be more time consuming waves than all other waves. Given these tendencies the most likely scenario at this point may be that cycle wave b is an incomplete double combination.
The first structure in the double labelled primary wave W fits as a zigzag. This upwards movement will subdivide as either a three (zigzag) or a five (impulse). It does have a three wave look to it.
The double is joined by a deep three in the opposite direction labelled primary wave X, which is a 0.77 depth of primary wave W. X waves within double combinations are normally very deep; this one looks right.
The second structure in the combination may be either a triangle or a flat correction. Both of these structures have A waves which subdivide as threes.
At this stage, the upwards wave from the low in December 2016 to the high in April 2017 does now look best and subdivide best as a completed zigzag. This may be intermediate wave (A) of a flat correction or a triangle. Because a triangle for primary wave Y would look essentially the same as the second weekly chart below, only a flat correction is considered here. The most common two structures in a double combination are a zigzag and a flat.
This wave count follows the most common scenario and has the best fit.
Within the flat correction of primary wave Y, intermediate wave (B) must retrace a minimum 0.9 length of intermediate wave (A) at 1,140.27. The most common length for intermediate wave (B) is from 1 to 1.38 times the length of intermediate wave (A), giving a common range from 1,123.08 to 1,057.77.
Intermediate wave (B) may subdivide as any corrective structure, but the most common structure for B waves within flats is a zigzag. At this stage, on the hourly chart it looks like a five down labelled minor wave A is complete, which would indicate intermediate wave (B) is a zigzag subdividing 5-3-5.
The daily and hourly charts will follow this weekly chart. That does not mean the other three weekly charts aren’t possible, they are, but the number of charts must be kept reasonable on a daily basis.
The Magee bear market trend line is added to the weekly charts. This cyan line is drawn from the all time high for Gold on the 6th of September, 2011, to the first major swing high within the following bear market on the 5th of October, 2012. This line should provide strong resistance. If that resistance holds, then the second weekly chart would be correct.
Anchor points for the maroon trend line are now added to this weekly chart. Draw it from the high in early July 2016 to the high in April 2017. This trend line is not too steep, has been tested six times, and is long held. It offers very strong technical significance. It is expected now that upwards movement is very likely to end here as price is now right at this line. Copy it over to daily charts.
WEEKLY CHART II
Click chart to enlarge.
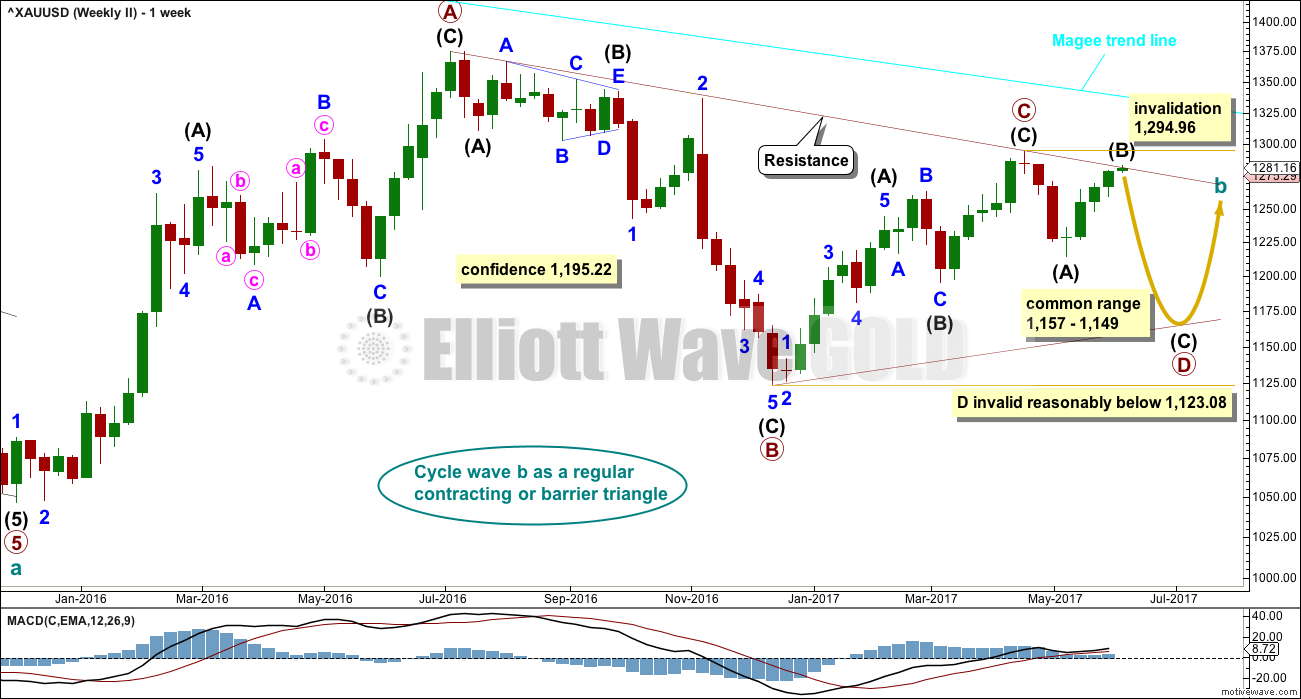
What if cycle wave b is a triangle? This is also entirely possible. Triangles are not as common as double combinations, but they are not uncommon.
Within the triangle, primary waves A, B and C are all single zigzags. One of the five subwaves of a triangle normally subdivides as a more complicated multiple, usually a double zigzag. This may be what is unfolding for primary wave D. It may also subdivide as a single zigzag.
Primary wave D of a regular contracting triangle may not move beyond the end of primary wave B below 1,123.08.
Primary wave D of a regular barrier triangle should end about the same level as primary wave B at 1,123.08, so that the B-D trend line is essentially flat. What this means in practice is that primary wave D may end slightly below 1,123.08 and the triangle would remain valid. This is the only Elliott wave rule which is not black and white.
Thereafter, primary wave E should unfold upwards and would most likely fall a little short of the A-C trend line. If not ending there, it may overshoot the A-C trend line. Primary wave E may not move beyond the end of primary wave C above 1,294.96.
Triangles normally adhere very well to their trend lines. Occasionally, price may overshoot the trend lines but when this happens it is not by much and is quickly reversed. The upper A-C trend line should offer very strong resistance at this stage if cycle wave b is unfolding as a triangle. This trend line is added to the daily chart below.
At this stage, the structure on the hourly chart is still the same for both this weekly wave count and the first weekly wave count: a zigzag downwards is unfolding. However, they now diverge in how far down the next wave is expected to go. This second weekly wave count expects a more shallow movement to not end reasonably below 1,123.08.
DAILY CHART
Click chart to enlarge.
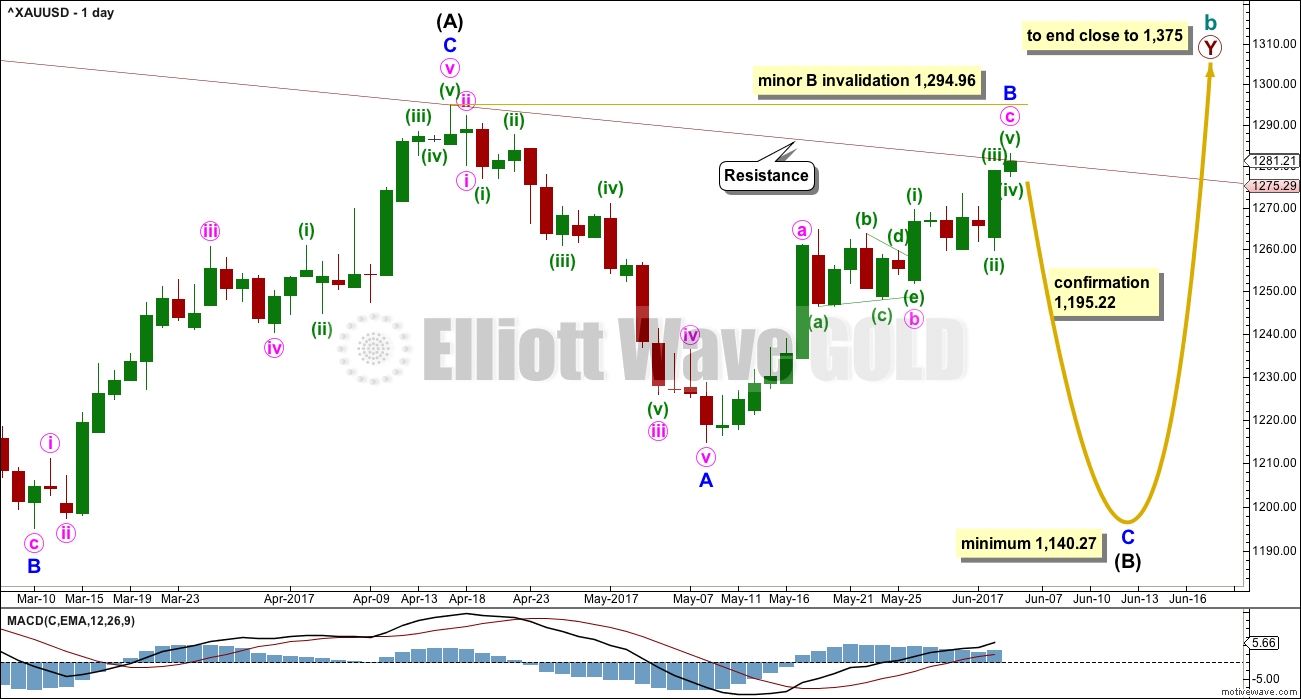
This daily chart will suffice for both weekly charts above, although the labelling follows weekly chart I.
Both weekly charts expect a zigzag downwards from the high on the 17th of April, 2017, at 1,294.96. (It may also turn out to be a double zigzag. For now a single only will be charted but a double will be kept in mind). Weekly chart I expects a deep zigzag for intermediate wave (B) to a minimum at 1,140.27. Weekly chart II expects a zigzag down for primary wave D to not move below 1,123.08 and most likely fall well short of that point.
The daily chart follows the expectations for weekly chart I, but the structure for weekly chart II would be exactly the same at this stage.
Within the flat correction of primary wave Y, intermediate wave (B) must retrace a minimum 0.9 length of intermediate wave (A) at 1,140.27. The most likely corrective structures to achieve the deep correction required for B waves within flats are single or multiple zigzags. These begin with a five, then a three in the opposite direction.
Minor wave A is complete. Minor wave B may be over here or very soon indeed. If either of the first two weekly wave counts are correct, then tomorrow must see a downwards day. If price breaks above the maroon trend line with a full daily candlestick above and not touching the line, then the fourth weekly chart will become the main wave count.
Minor wave B may not move beyond the start of minor wave A above 1,294.96.
The structure within minor wave B will be labelled as a triangle for minute wave b; this has a very good fit and the best look at the daily chart level. Because the two hourly charts published in last analysis both expected the same movement next, only one will be published today.
2 HOURLY CHART
Click chart to enlarge.
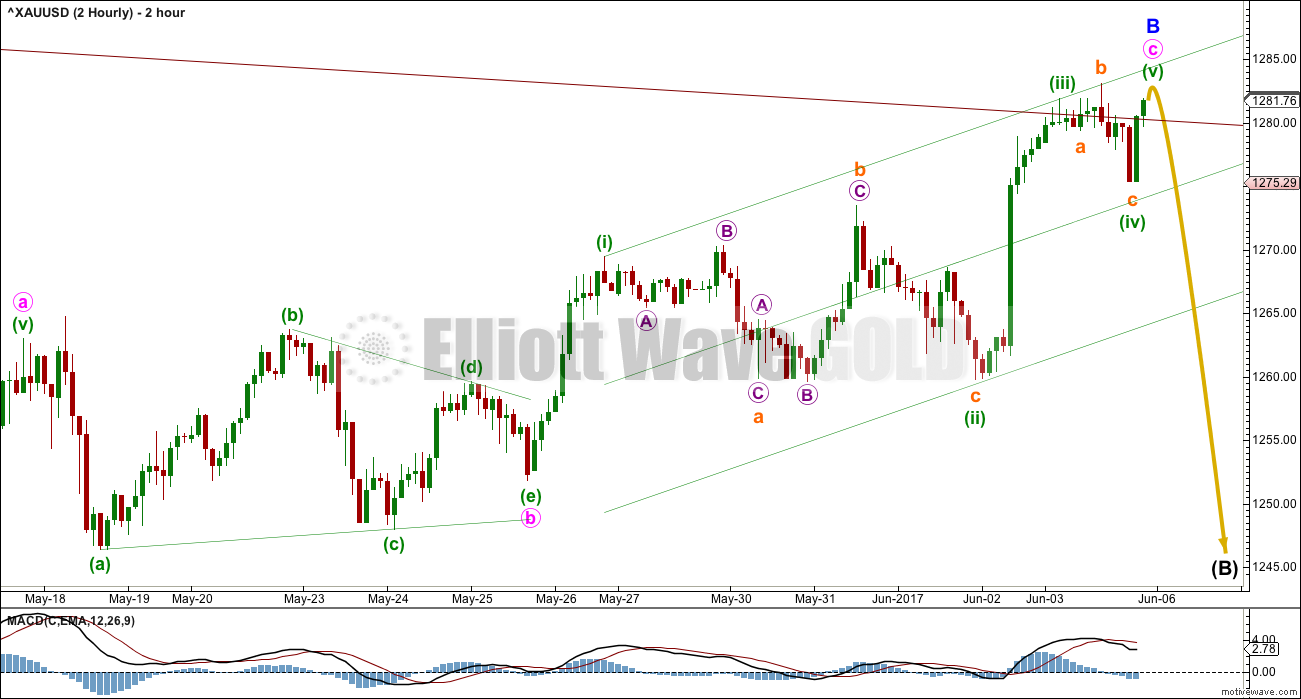
This two hour chart shows all of minor wave B from the end of minute wave a onwards.
Minute wave b fits perfectly as a running contracting triangle. Minute wave b would reach 0.618 the length of minute wave a at 1,282. Price is almost right at this target. Copy the green Elliott channel over to the hourly chart.
HOURLY CHART
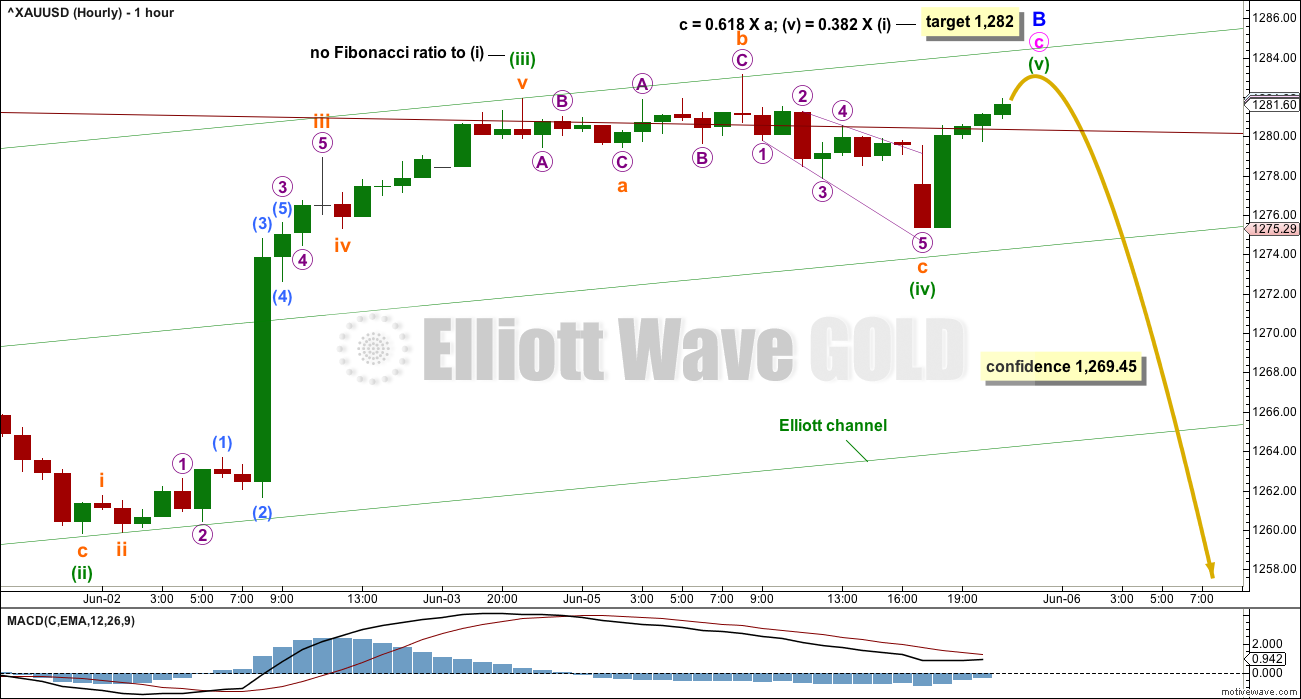
Click chart to enlarge.
At 1,282 there would be a Fibonacci ratio at two degrees and minuette wave (v) would move just slightly above the end of minuette wave (iii), avoiding a truncation.
A new low now below 1,269.45 could not be a fourth wave correction within minute wave c, as then price would be back in first wave territory. A new low below 1,269.45 would add some confidence in a trend change.
A breach of the lower edge of the green Elliott channel would add further confidence in a trend change.
WEEKLY CHART IV
Click chart to enlarge.
What if the bull market beginning in December 2015 remains intact? Price has essentially been moving sideways since that date, so all possibilities should be considered.
This wave count requires confirmation above 1,294.96. That would invalidate the first three weekly charts (the third is seen in historic analysis only).
It is possible that cycle wave b is continuing higher as a double zigzag. However, double zigzags normally have brief and shallow X waves. The purpose of the second zigzag in a double (and the third when there is one) is to deepen the correction when price does not move deep enough in the first (or second) zigzag. Thus double (and triple) zigzags normally have a strong and clear slope against the prior trend. To achieve this look their X waves normally are brief and shallow.
In this case, primary wave X is neither brief nor shallow. It is a 0.77 depth of primary wave W and lasted 0.74 the duration of primary wave W. Overall, this does not have a typical look of a double zigzag so far.
This wave count also must see the rise up to the high labelled intermediate wave (A) as a five wave impulse, not a three wave zigzag. This looks a little forced, so it reduces the probability of this wave count.
This wave count should only be used if confirmed with a new high above 1,294.96. Low probability does not mean no probability, but should always be given less weight until proven.
Prior to price confirmation, reasonable confidence may be had in this wave count if a full daily candlestick is printed above and not touching the maroon trend line.
TECHNICAL ANALYSIS
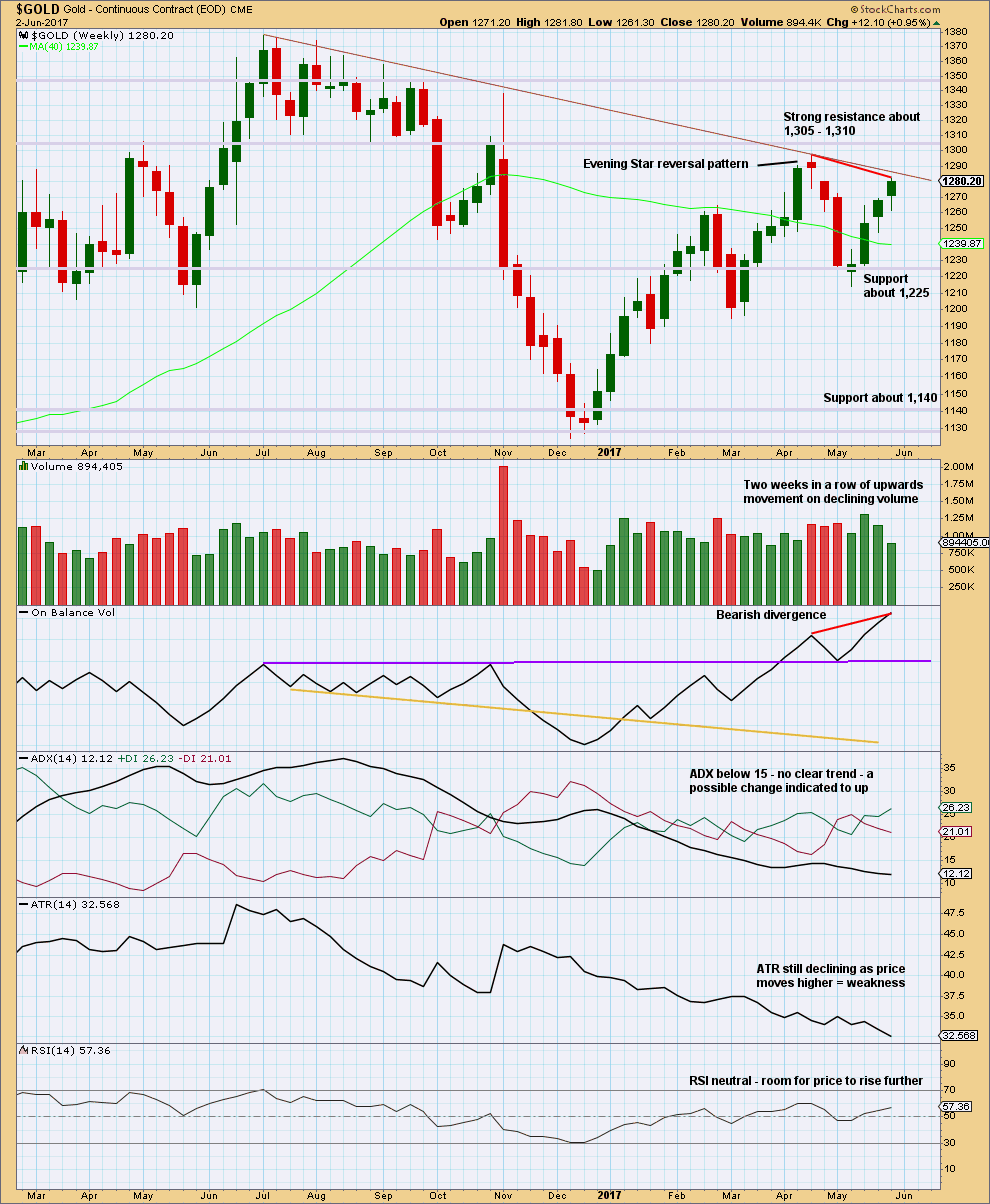
WEEKLY CHART
Click chart to enlarge. Chart courtesy of StockCharts.com.
Last week completes an Advance Block candlestick pattern. This is a three candlestick pattern; three green candlesticks with the second and third candlesticks showing signs of weakening. However, this pattern does not come within a mature upwards trend, so the warning is weak and further weakened by the longer lower wicks on the last two candlesticks, which are bullish.
Declining volume along with declining range is bearish.
Strong divergence between price and On Balance Volume is bearish.
There is still room for price to rise further, but the short lived upwards trend at this time looks weak.
The maroon trend line is added to this weekly chart, using the same anchor points as the Elliott wave charts.
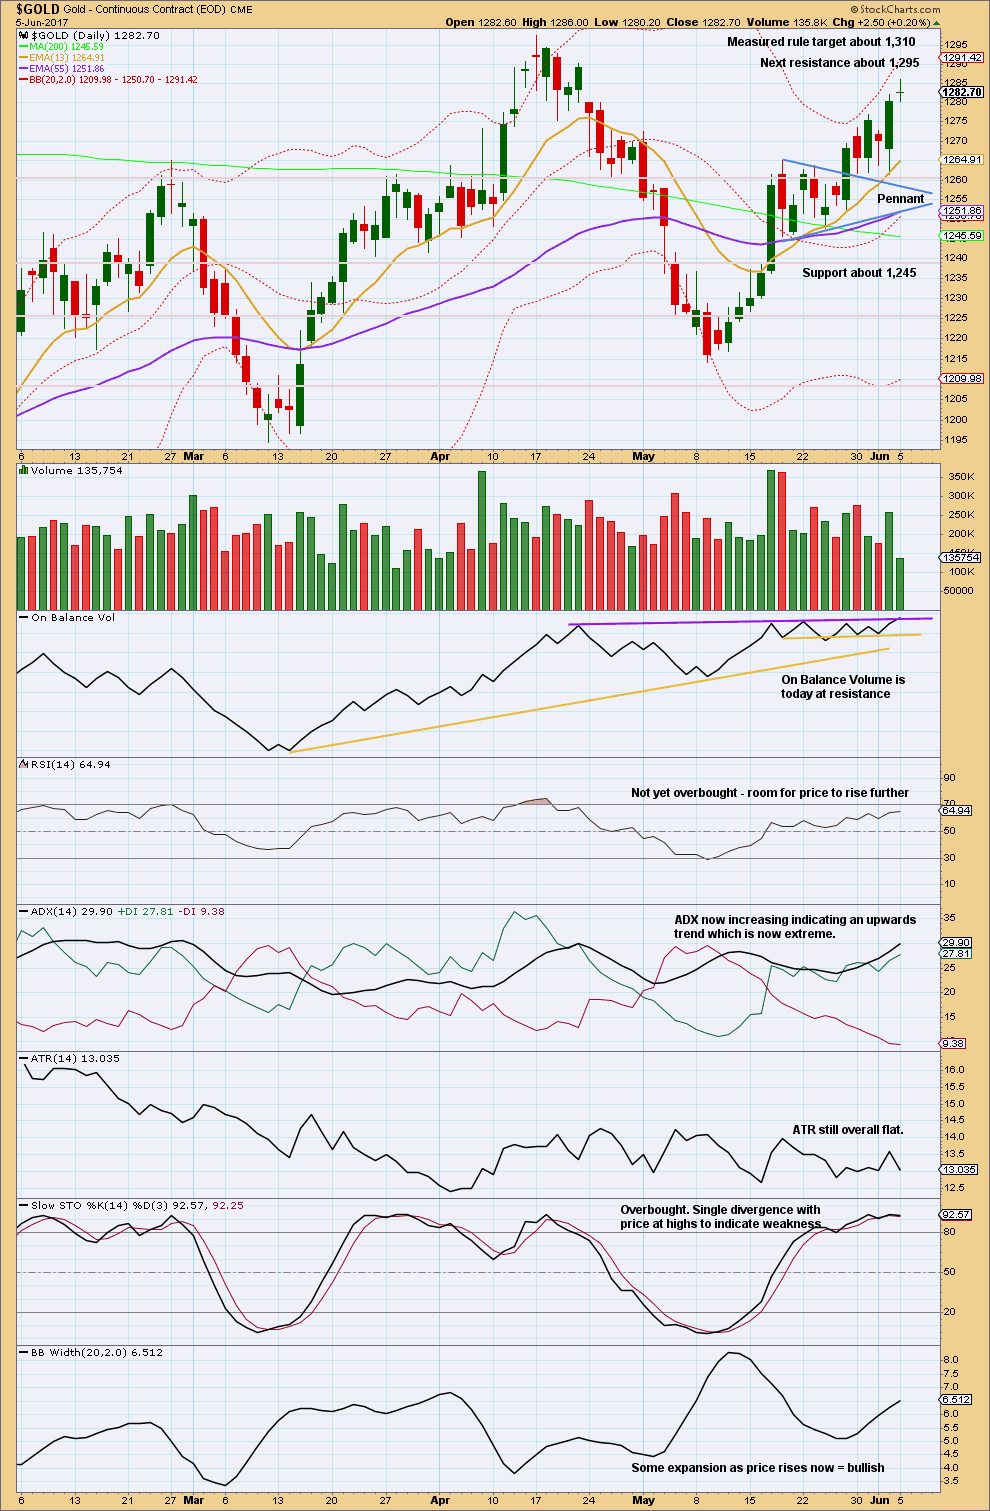
DAILY CHART
Click chart to enlarge. Chart courtesy of StockCharts.com.
The pennant pattern suggests an upwards breakout (which happened) to be followed by more upwards movement to the target at 1,310.
Monday’s small doji represents a balance between bulls and bears, indecision. With much lighter volume for the session and upwards movement, there was not support from volume during this session. This is bearish. It looks like the bulls are running out of steam.
This does not mean price must turn here. It just means it looks fairly likely.
On Balance Volume is right at resistance. There is a little leeway in exactly how the purple line may be drawn. The purple line needs to be clearly broken for it to be read as a bullish signal. This suggests a red daily candlestick tomorrow is fairly likely.
ADX is extreme; this is usually followed by a trend change fairly quickly for Gold. ATR is flat; the trend lacks range which indicates weakness.
Stochastics may remain overbought for reasonable periods of time and divergence may develop further.
The only bullish signal here is widening Bollinger Bands with the upwards trend.
GDX
DAILY CHART
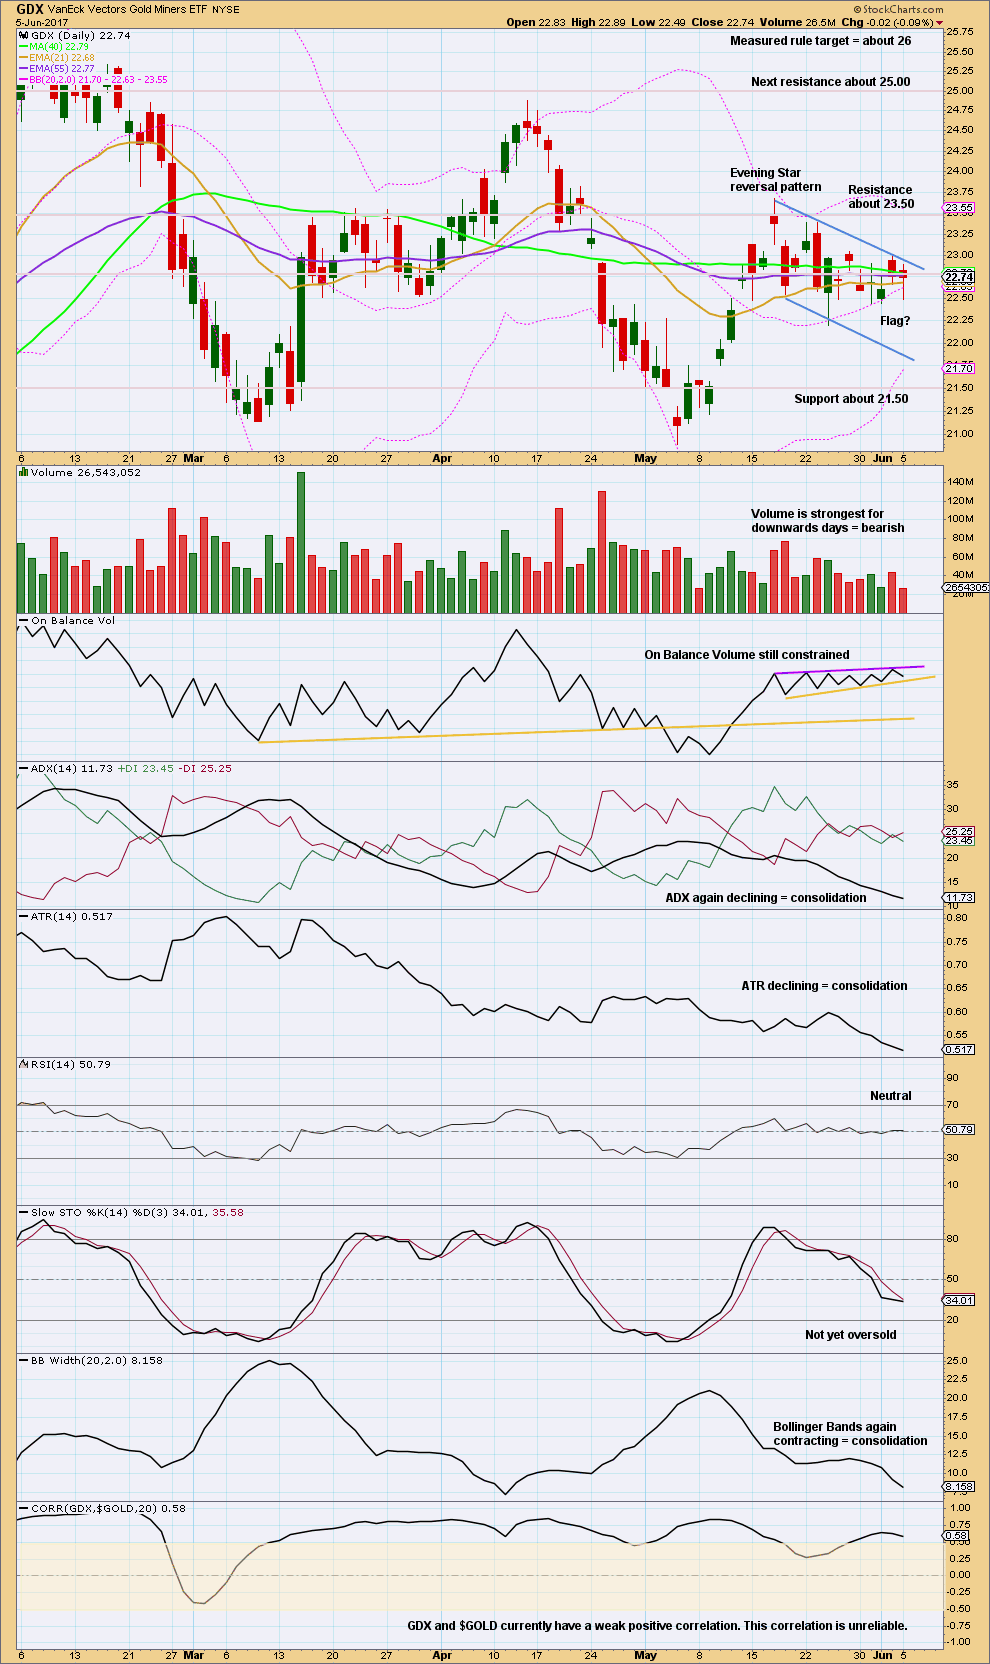
Click chart to enlarge. Chart courtesy of StockCharts.com.
GDX led the way for the last two turns in price. At the end of last week, it may again be signalling what is to come next.
While Gold had an upwards week, GDX has essentially moved sideways and cannot break out of its flag pattern. Price today again closed within the pattern.
There has not yet been a breakout by On Balance Volume. Again, there is a little leeway in exactly how the purple resistance line may be drawn. It is adjusted very slightly to be as conservative as possible.
GDX is clearly still consolidating. During the consolidation, it is two downwards days which have strongest volume suggesting a downwards breakout is more likely than upwards.
This analysis is published @ 10:37 p.m. EST.
I’ll have two wave counts today. I’ll use one daily chart and one hourly chart for both. Both need to see a five up complete, for this weekly chart it would be intermediate (C). For the triangle idea posted below it would be minor A of intermediate (Y).
I still don’t like this weekly chart as much as the triangle. Cycle b still doesn’t look right as a double zigzag, and intermediate (A) still looks like a three not a five.
Lara. What if you align this graph with the one shown in the triangle?
Let me explain.
Intermediate A could be where Minor A is in the triangle, the point 1263.64. Then, Intermediate A will be a clear five and not a possible three.
Intermediate B could be where Minor B is in the triangle, the point 1195.22.
For Intermediate C, Minor 1 could be where Intermediate W is in the triangle, the point 1294.96.
Minor 2 could be where Intermediate X is in the triangle, the point 1214.81.
In this way, you can use one chart to follow both scenarios. The triangle will end when a five up completes. That would be Minor 3 for Weekly IV. Weekly IV then needs two more waves to complete.
Like this?
I’m following your idea, yes.
I still have the same problems with it. Minor 2 should have found support at the lower edge of the black channel. The fact that it hasn’t really does reduce probability of this idea quite substantially.
And then there’s the problem still within cycle b as a double zigzag; primary X is too deep.
Sorry to burst everybody’s bubble, but a triangle could still be valid.
One of the five sub-waves needs to be a more complicated multiple, and it could be primary C. Primary C can’t move above primary A, the upper invalidation point is black and white.
Short to a bit more mid term, on the way up. If this is a second zigzag though we’ll have to look out for the B wave coming up soon, a pullback.
Then C upwards. We can all profit from that, and for the very bullish weekly chart that would be the possible middle of a third wave.
Either way, a triangle or a third wave, up for now.
Here is the latest from last Tuesday’s positions about 30 dollars lower than now. Will the commercials change there mind, go long and lighten up on shorts or will they go heavy short, dump there longs and let the speculators hold the bag? Specs went long quite a bit and with a 30 dollar move up they are bound to be jumping on the bandwagon and shooting for the stars. Will this be the time they breakthrough and cause the commercials great pain? We will see soon enough.
Dermot – see the below link. Plenty of room for speculators to load up longs and commercials to short more. Compare with 2016 top
http://snalaska.com/cot/current/charts/GC.png
Thanks Eli.
Commercials did not go short this past week but they did remove more longs than shorts. I’m guessing they got out of there winning longs and lightened up on there shorts. They may decide to switch to Long this Friday but I wouldn’t be surprised to see them go moderately short here. They are a stubborn group and tend to stick with there positions and add to them even if they go against them. We do have some traction in the gold stocks and you can’t argue with the fact that gold is moving up. I agree with Lara’s take based on the charts and volume so far. I would have thought a down move would be forthcoming. Today things may switch but there is still room for caution.
Ichimoku Gold Update
Data as at 12:10 pm ET June 6
=========================
Gold price has risen beyond the previous high at 1294.96, invalidating all three Lara’s Weekly Counts. The much-awaited Weekly IV is in play, a multi-month bullish trend. I guess it makes all of us patient folks much much happier.
I was too pessimistic in my Daily post, thinking that prices could not surmount the 1294.96 barrier, but boy was I (happily) wrong. The 1-Hour Ichimoku Chart showed there is no let-up to the price rally as yet. The tenkan-sen is still hovering above the kijun-sen. I am now waiting for a pullback, as discussed in the Daily post, before going in long. Support areas are now:
1291.83, tenkan-sen
1286.87, kijun-sen
Around 1280, Cloud support
1275-1270, strong support
1260 stronger support, worst case scenario.
Happy trading, folks.
Lot of Fib traders are looking at $1320 at the next level.
Alan, thanks for your regular updates. Fabulous! At this stage at CMP 1294-95, looks unlikely for Gold price to drop to or below 1291-89 before targeting an upside break of 1296 for 1304-05+ range. I would however be cautious with high RSI levels and price teasing to test and break above the upper bands (daily/weekly). Raising stops to 1289 lol…. Have a fine day all. Lets see what Gold price has in store for us for Wednesday.
Stuck in another short guess I will hold out to see how the day ends. Not looking good unless world peace is proclaimed. Maybe next time lara
Not a hope.
North Korea tensions are not over yet.
Qatar feud is heating up.
Another attack at Notre Dame, Paris, only a while ago; the attacker shouted “It’s for Syria”.
Comey, British voting, ECB meeting on the cards.
This is a delicious witches’ brew.
I think Geo political issues are very short lived but China buying treasuries, the curve flattening, soft data, weak dollar, and extremely overbought equity markets to me are the true juice. Moreover after very weak miner action the miners are very oversold relative to gold
I agree . Those financial indicators are driving the price. I see them on my charts.
“Houston, we have lift off.”
I can’t believe I am so clairvoyant: read my response to John yesterday. Poor Lara, another (really big) change.
Yes. For weekly chart IV, what do you think about Intermediate wave B continuing as an expanded flat or triangle?
Those are distinct possibilities. At the moment, I’ll just treat it as completed at the low of 1214.81 on May 9, awaiting for developments to point the way.
At the moment, I think Lara’s target of 1452 may be too low. I have:
(1) 1492.91 where Int C = 1.618 * Int A
(2) 1527.52, the next nearest support turned resistance beyond 1452, reached in May 2012.
By the way, 1529.28 is where Primary Y = 1.236 * Primary W.
Did you see my post below at 4:34 am?
It was declared earlier.
Per PMBULL.com, gold hit 1295.048 which invalidates several of Lara’s charts above.
Dreamer’s waves for GDX look very promising.
Thanks, as always, for posting.
The high on Barchart so far is 1,294.76, a little short of invalidation. Need to see if price can make another run up.
PM Bull is a good site because it has live data, but best to use Barchart to verify Lara’s invalidation points.
Whoopsie! Thanks so much for the clarification, Dreamer! You’re dead right… used the wrong site.
With Comey testifying on Thursday, it’s hard to see gold retreating until at least then. However, the RSI at 80 on the 4 hour and daily is high.
Gold is making another strong push to eclipse the mark now…. let’s rally so GDX can really take off.
Please accept my apologies for the slight delay in posting this. I had an errand to run.
Ichimoku Gold Daily Analysis
Data as at 7:10 am ET June 6
=========================
Gold prices broke out of the short-term range defined by the double bottom at 1260 and the double top at 1270. It continued to trade in a bullish trend as prices lie above both the tenkan-sen and the kijun-sen. Also, the tenkan-sen remains above the kijun-sen from a bullish crossover 7 days ago. It seems that investors are adamant in testing the last high at 1294.96. This is an area of strong resistance and I would expect a pullback to occur from there. Strong support resides at 1275. If broken the correction starts, and next support will be at 1260. For today, I do not foresee prices breaking below this.
If prices do break above 1294.96, I would not be in a hurry to buy yet, but would wait for a pullback, demanded by the EW count, before joining the then established bull trend. This price action will attract buyers as the market has plenty of reason to think that the precious metal sector will continue due to geopolitical concerns. After all, we are simply one headline away from another impulsive moved to the upside. On top of that, the US dollar has been falling, and that of course works for the value of gold, and therefore could become yet another catalyst for the market to go higher. The bears would then have thrown in the towel as the longstanding shackles of the head-and-shoulders formation will be voided, and a longer-term probable inverse H&S that started way back in 2013 would be invoked. You may refer to this in Clive Maund’s latest gold market update.
https://www.clivemaund.com/article.php?id=68.
Imo lucky if we see a break below 1286 for 1281. . . Let’s see
At 1289 Gold has lift off in a 3rd of 3rd wave up. My post from early May or there after can not be referenced here. Lara’s bullish count has been in play all this time.
I will wait till weekend to repost the chart.
Gold is following 2007 to 2008 3rd of 3rd wave count so it appears.
Target is 1450 per Lara.
Maybe. I can still see a triangle option.
https://www.kimblechartingsolutions.com/2017/06/gold-indicator-nears-first-buy-signal-6-years/
Kimble post (re-posted). Gold indicator nears first buy signal in 6 years.
Their link within the post connects to a history chart showing the 2011 Bear start. Interesting connection between CHF and gold.
Here’s the daily detail for the GDX weekly count shown below
https://www.tradingview.com/x/zwPIHl0j/
Thank you for sharing your charts.
You’re welcome 😊
Very nice Dreamer. That wave count looks very good indeed, it fits very nicely with the EW triangle for Gold I’ve posted above.
My money literally will be on this.
Lets look now for Gold price to hit the Magee trend line.
A triangle for Intermediate wave B looks to be complete. A sharp move up to about 24.20 is expected for GDX for Intermediate wave C.
The Intermediate wave B triangle for this wave up and the triangle for Gold in the middle of it’s recent leg up further supports the idea that a big move up in GDX and Gold is not ready to start yet. That’s because a triangle can’t be in a 2nd wave position that an imminently more bullish count would require.
If GDX reverses down near 24.20, this count will be looking really good.
https://www.tradingview.com/x/gd5kI6yB/
Dreamer, noticed the link is attached to an XAU chart. Just a little thing really. I very much appreciate your work here. It helps alot!
Oops. This should be the correct link:
https://www.tradingview.com/x/yJhvQs4n/
While gold seems to be a little stronger than Lara expected, as long as 1,295ish holds, both Lara’s triangle as shown in Weekly chart II and this triangle variation look good.
Both GDX and Gold have what appears to be EW triangles in the B wave position for this recent leg up. That likely means that Gold and GDX are not ready for a big upwards breakout just yet. It further reinforces the idea that triangles are forming.
https://www.tradingview.com/x/gd5kI6yB/
The triangle can still be valid. Primary C could be a double zigzag.
I opened a short earlier today and just closed for a very small loss. This little bit of upwards movement and now sideways doesn’t look quite right…. on lower time frames it looks like a small pennant or flag, and the maroon trend line is well overshot.
Standing aside and waiting another one or two days to see what happens next. Willing to switch to very bullish if tomorrow is up, and to jump back in short if tomorrow is down.
Hoping we close above the maroon trendline tomorrow. My feed shows session opened at 1278.74 (below line) so don’t see how tomorrow could be the ” full daily candlestick above and not touching”. On the edge of my seat! 🙂
It has.