
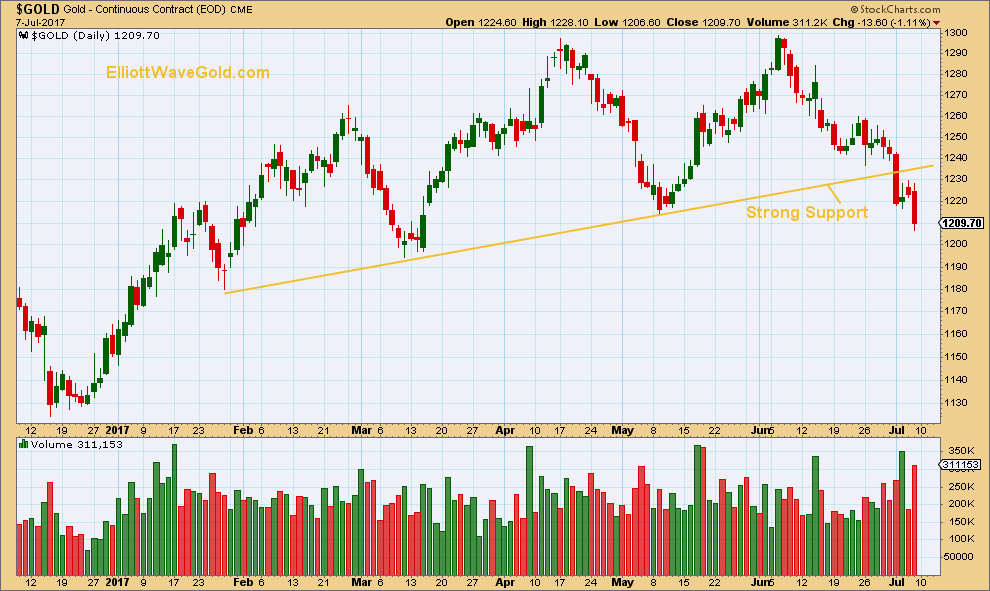
On June 27th I published a daily chart of Gold with a simple trend line. In that post I posed the question: “How Gold behaves at this trend line in the next few days will be a strong indicator. Does the bull run continue or is it over?”
Click chart to enlarge.
The trend line was breached very clearly. The breach was followed by a typical correction up to resistance. Now price is moving down and away from the trend line.
Adding in simple volume gives this signal more depth. If a breach is supported by volume, then more weight may be given to its significance. The breach of July 3rd did come with increased volume, and volume increased further for the next downwards day of July 5th. After a small bounce to test resistance, further downwards movement for the 7th of July shows again strong support from volume.
Sometimes simple really is best.
This analysis is published @ 11:59 p.m. EST.
It’s been a great breakout. Very happy; great work!