
Last published Bitcoin analysis had inadequate targets.
All charts are on a semi-log scale.
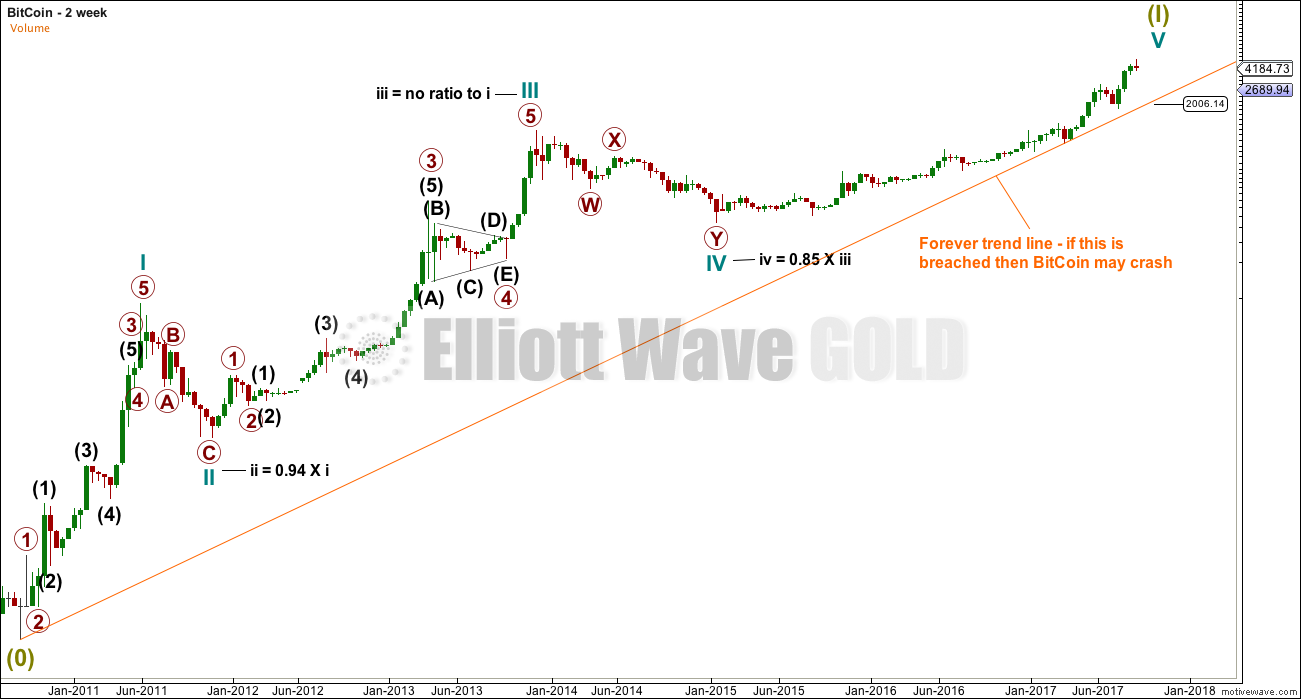
FORTNIGHTLY CHART
Click chart to enlarge.
The data for this wave count begins from June 2010.
What looks like a five wave impulse may be completing. With no Fibonacci ratio between cycle waves III and I, it may be more likely that cycle wave V will exhibit a Fibonacci ratio to either of III or I.
This movement does not fit well at all into a channel.
I have taken some time to look at the waves which now in hindsight are obviously complete, particularly the waves within cycle wave III. I have noticed some tendencies of this market:
– Bitcoin behaves like an extreme commodity. Its impulses have a curved look with slower second waves, quick fourth waves, and strong sharp fifth wave extensions. This tendency shows up in bullish and bearish waves.
– Third waves are much longer than first waves, and fifth waves are longer still. Again, this is an extreme version of typical commodity behaviour.
– The middle of its third waves may exhibit Fibonacci ratios within them, but overall it does not regularly exhibit good Fibonacci ratios. This would make target calculation particularly difficult.
– Candlestick reversal patterns are common at the end of Bitcoin’s strong fifth waves. These are engulfing patterns or star patterns with very long wicks on the final candlestick.
– Early second wave corrections are extremely deep, close to 0.8 and often deeper than 0.9 the depth of the prior first wave.
The “forever” trend line should be used to indicate when the top may be in for BitCoin. If this line is breached, the probability of a crash will increase (it will not be certain, only highly likely).
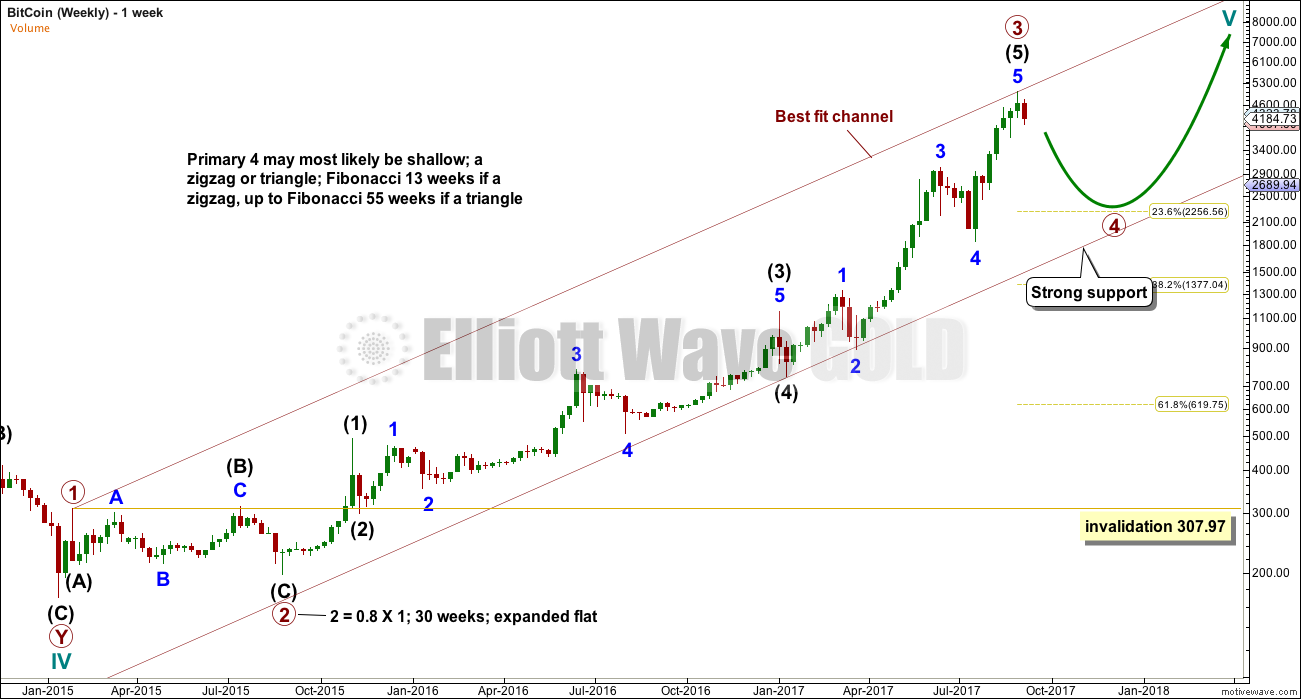
WEEKLY CHART
Click chart to enlarge.
The weekly chart looks at the possible structure of cycle wave V, the final fifth wave.
There are multiple ways to label this upwards movement. This is only one.
It looks like BitCoin may be due for a primary degree correction. Given that its fourth waves tend to be quicker than its counterpart second waves, primary wave 4 may only be a Fibonacci 13 or 21 weeks.
However, it may be longer lasting if it subdivides as a triangle, possibly even up to a Fibonacci 55 weeks.
If this analysis is wrong, it may be in expecting primary wave 4 to reach down to the 0.236 Fibonacci ratio. Primary wave 4 may not be that deep and may end mid way within the channel.
This analysis is published @ 03:33 a.m. EST.
[Note: Analysis is public today for promotional purposes. Member comments and discussion will remain private.]