
Yesterday’s strong upwards movement has been reversed. A new low below 1,296.23 indicated the alternate hourly Elliott wave count should be used.
Summary: The bigger picture reverts to seeing a pullback continue here to about 1,261. It may be as low as 1,170 – 1,158.
However, the very short term picture today is unclear. Although today reversed yesterday’s gains, volume does not support today’s downwards fall in price. It is suspicious.
It is possible that an expanded flat may be unfolding. For the short term, a sideways consolidation may be incomplete.
Watch On Balance Volume carefully for a signal. It will come within a very few days.
Always trade with stops and invest only 1-5% of equity on any one trade.
New updates to this analysis are in bold.
Last monthly charts for the main wave count are here, another monthly alternate is here, and video is here.
Grand SuperCycle analysis is here.
The wave counts will be labelled first and second. Classic technical analysis will be used to determine which wave count looks to be more likely.
FIRST ELLIOTT WAVE COUNT
WEEKLY CHART
Click chart to enlarge.
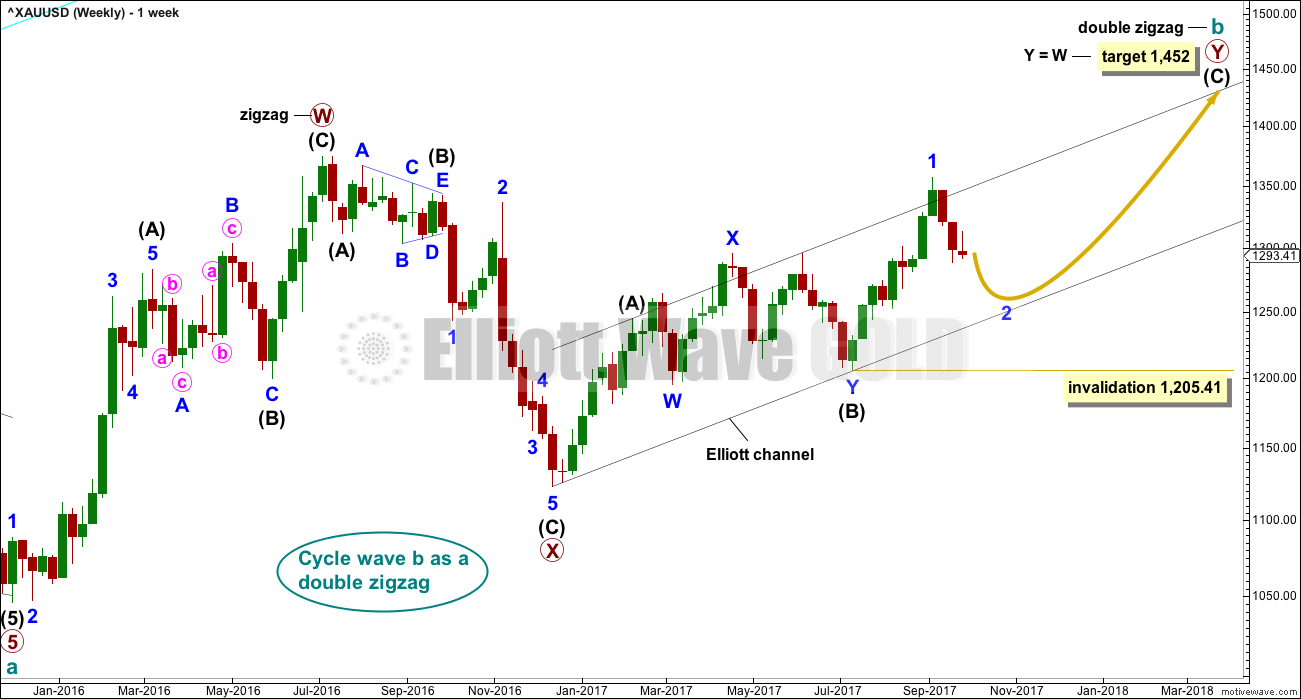
There are more than 23 possible corrective structures that B waves may take, and although cycle wave b still fits well at this stage as a triangle, it may still be another structure. This wave count looks at the possibility that it may be a double zigzag.
If cycle wave b is a double zigzag, then current upwards movement may be part of the second zigzag in the double, labelled primary wave Y.
The target remains the same.
Within intermediate wave (C), no second wave correction may move beyond the start of its first wave below 1,205.41. However, prior to invalidation, this wave count may be discarded if price breaks below the lower edge of the black Elliott channel. If this wave count is correct, then intermediate wave (C) should not break below the Elliott channel which contains the zigzag of primary wave Y upwards.
There are two problems with this wave count which reduce its probability in terms of Elliott wave:
1. Cycle wave b is a double zigzag, but primary wave X within the double is deep and time consuming. While this is possible, it is much more common for X waves within double zigzags to be brief and shallow.
2. Intermediate wave (B) within the zigzag of primary wave Y is a double flat correction. These are extremely rare, even rarer than running flats. The rarity of this structure must further reduce the probability of this wave count.
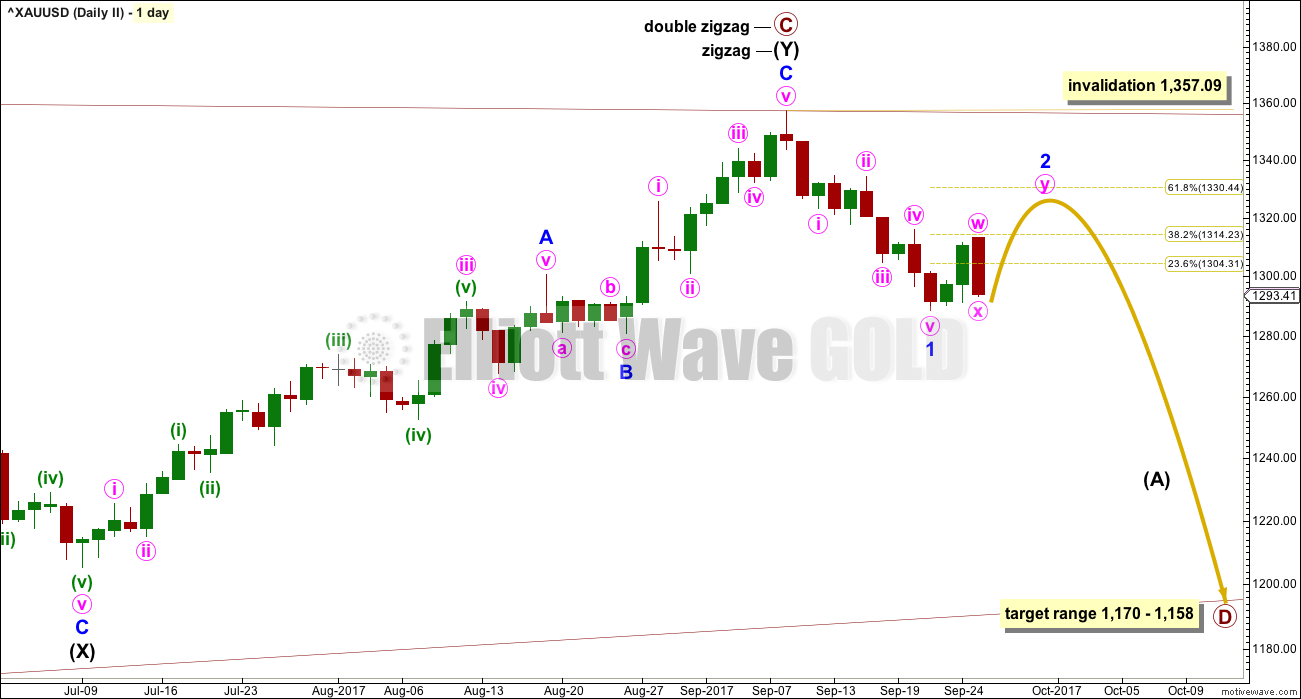
DAILY CHART
Click chart to enlarge.
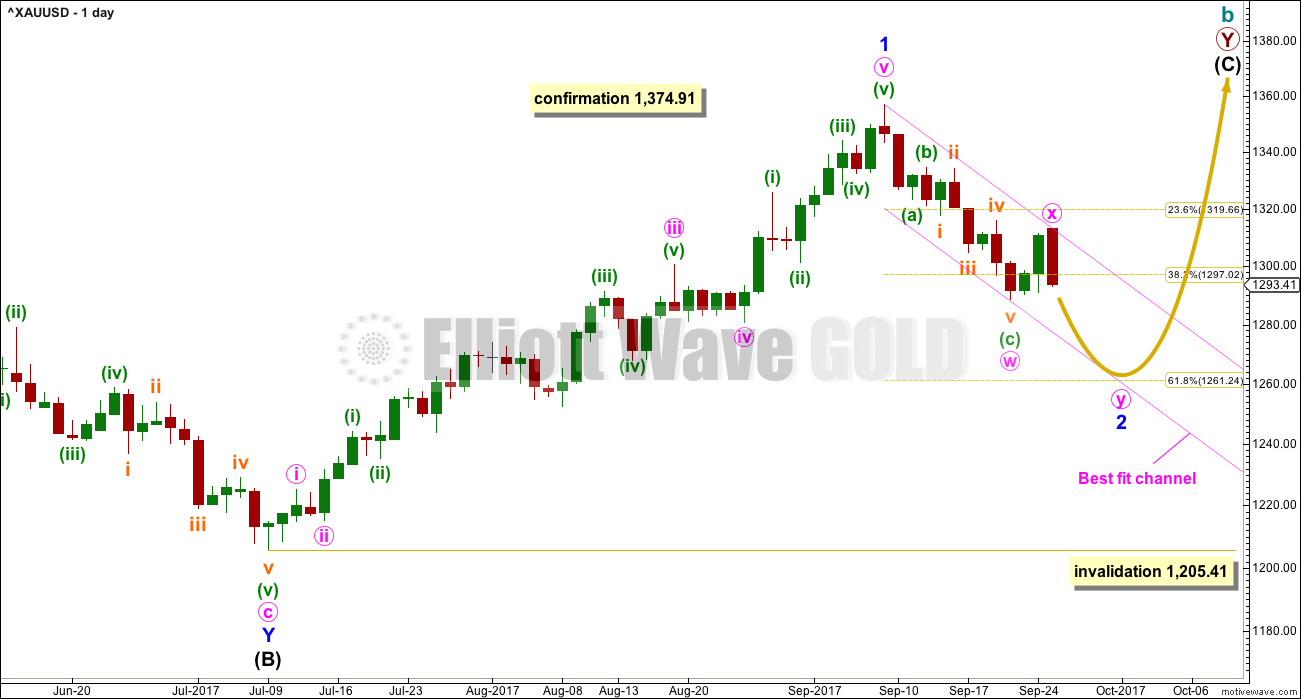
The analysis will focus on the structure of intermediate wave (C). To see details of all the bull movement for this year see daily charts here.
Intermediate wave (C) must be a five wave structure, either an impulse or an ending diagonal. It is unfolding as the more common impulse.
It is possible that minor wave 1 may have been over at the last high and the current pullback may be minor wave 2. Minor wave 2 may not move beyond the start of minor wave 1 below 1,205.41.
The strong reversal today indicates that minor wave 2 is most likely not over and may continue lower to reach a more normal depth of about 0.618 the length of minor wave 1, about 1,261. This would also see minor wave 2 have a better proportion to minor wave 1 in terms of duration; minor wave 1 lasted 44 days and so far minor wave 2 has lasted only 12 days. If it continues now for another 9 days, it may total a Fibonacci 21.
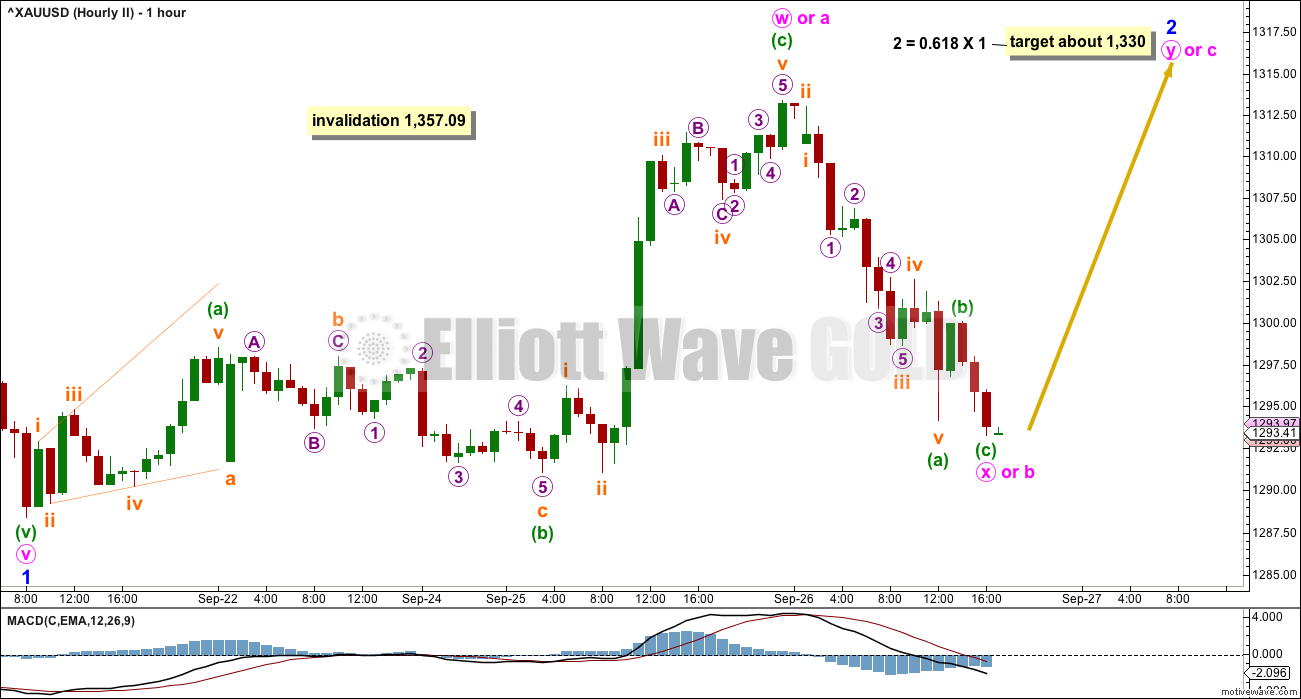
HOURLY CHART
Click chart to enlarge.
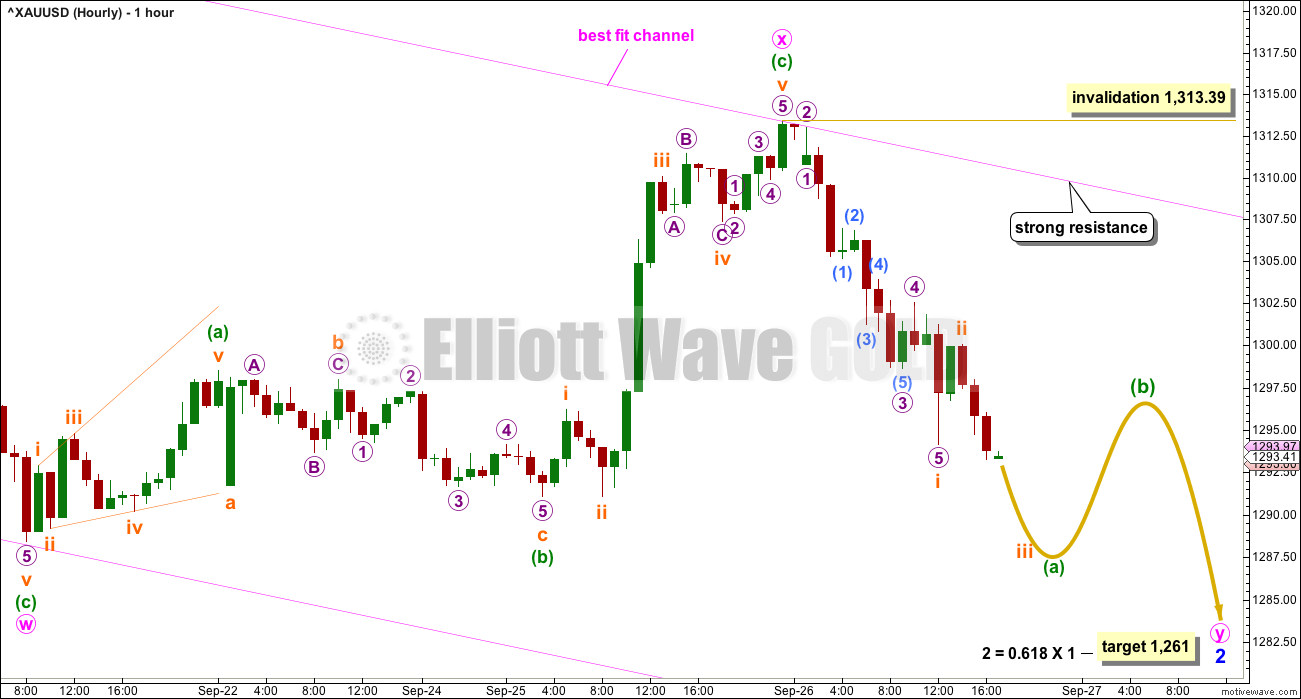
This wave count would expect minor wave 2 to now continue for another 9 days, if it exhibits a Fibonacci duration of a total 21 days.
When the first zigzag in a correction has not moved price deep enough, then a second zigzag should be considered. Here, the first zigzag of minute wave w is only a 0.45 length of minor wave 1. Second wave corrections are usually deeper than this.
X waves within double zigzags are commonly brief and shallow. Minute wave x fits this definition here.
If this correction for minor wave 2 is correctly identified as a double zigzag, then minute wave y must subdivide 5-3-5. Within the zigzag of minute wave y, minuette wave (b) may not move beyond the start of minuette wave (a) above 1,313.39. Minuette wave (b) should find very strong resistance about the upper edge of the best fit channel if it gets that high.
Along the way down, to the target at 1,261, there should be another bounce to last one to three days for minuette wave (b). Price is not expected to move in a straight line. It almost never does.
Minuette wave (a) looks to be incomplete.
Note: The labelling on the alternate chart for this downwards movement works in the same way for this main wave count. Minor wave 2 may also be a single zigzag. The low of the 21st of September may be minute wave a. Minute wave b may be continuing sideways as an expanded flat or double zigzag.
This means that the expectation of continuing downwards movement here cannot be relied upon. The lack of support today from volume indicates it may be a B wave.
SECOND ELLIOTT WAVE COUNT
WEEKLY CHART
Click chart to enlarge.
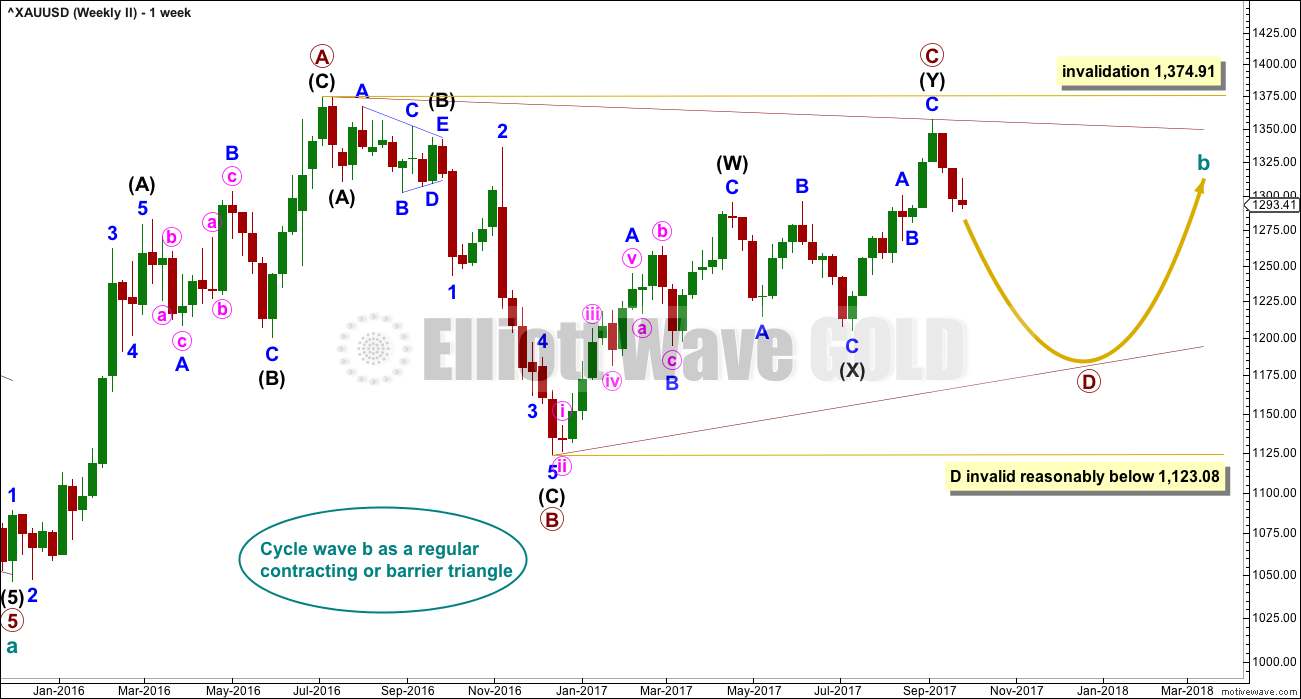
It is still possible that cycle wave b is unfolding as a regular contracting triangle.
Within a triangle, one sub-wave should be a more complicated multiple, which may be primary wave C. This is the most common sub-wave of the triangle to subdivide into a multiple.
Intermediate wave (Y) now looks like a complete zigzag at the weekly chart level.
Primary wave D of a contracting triangle may not move beyond the end of primary wave B below 1,123.08. Contracting triangles are the most common variety.
Primary wave D of a barrier triangle should end about the same level as primary wave B at 1,123.08, so that the B-D trend line remains essentially flat. This involves some subjectivity; price may move slightly below 1,123.08 and the triangle wave count may remain valid. This is the only Elliott wave rule which is not black and white.
Finally, primary wave E of a contracting or barrier triangle may not move beyond the end of primary wave C above 1,295.65. Primary wave E would most likely fall short of the A-C trend line. But if it does not end there, then it can slightly overshoot that trend line.
Primary wave A lasted 31 weeks, primary wave B lasted 23 weeks, and primary wave C lasted 38 weeks.
The A-C trend line now has too weak a slope. At this stage, this is now a problem for this wave count, the upper A-C trend line no longer has such a typical look.
DAILY CHART
Click chart to enlarge.
This second wave count expects the new wave down may be deeper and longer lasting than the first wave count allows for.
The blue base channel on this second wave count is drawn in exactly the same way as the pink Elliott channel on the first daily chart. For this second wave count the middle of minor wave 3 should have the power to break below support at the lower edge of the base channel. If price does behave like this, it would offer support for this second wave count over the first wave count.
A common length for triangle sub-waves is from 0.8 to 0.85 the length of the prior wave. Primary wave D would reach this range from 1,170 to 1,158.
If primary wave C is correctly labelled as a double zigzag, then primary wave D must be a single zigzag.
HOURLY CHART
Click chart to enlarge.
This wave count now sees the last wave down differently to the first wave count. This wave count sees a possible five down complete. Subdivisions within it are labelled at the daily chart level.
If the trend is down, then a five down labelled minor wave 1 may be complete. Now a bounce may be unfolding as a three wave structure for minor wave 2.
Minor wave 2 would be too brief and shallow, for this wave count, if it was over at yesterday’s high. That may be only minute wave w of a double zigzag for minor wave 2.
The target for this bounce to end is about 1,330.
While minor wave 2 may be a double zigzag labelled w-x-y, it may also be a flat correction labelled a-b-c. The most common type of flat is an expanded flat where minute wave b would be 1.05 times the length of minute wave a or longer. A new low does not mean that minor wave 2 is over; it would at this stage still most likely be part of minor wave 2.
Expanded flats are very common structures. They can often be identified by weakness within their B waves.
TECHNICAL ANALYSIS
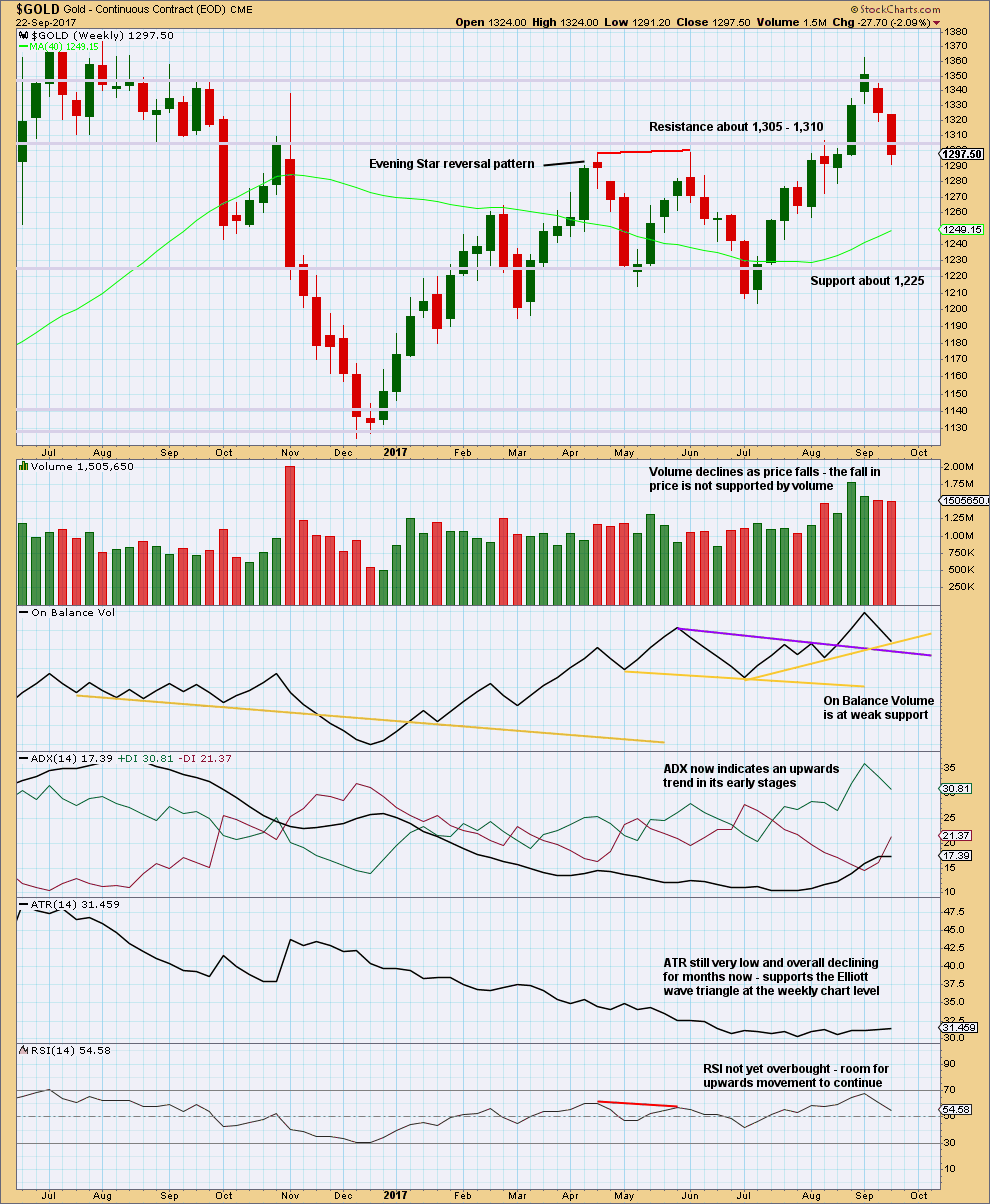
WEEKLY CHART
Click chart to enlarge. Chart courtesy of StockCharts.com.
Weak support here from On Balance Volume may halt the fall in price or initiate a small bounce. If On Balance Volume breaks below the support line thisweek, that would be a weak bullish signal.
Overall, this chart remains mostly bullish. At this stage, with downwards movement not being well supported by volume, it should be assumed to be a pullback within a larger trend until shown otherwise.
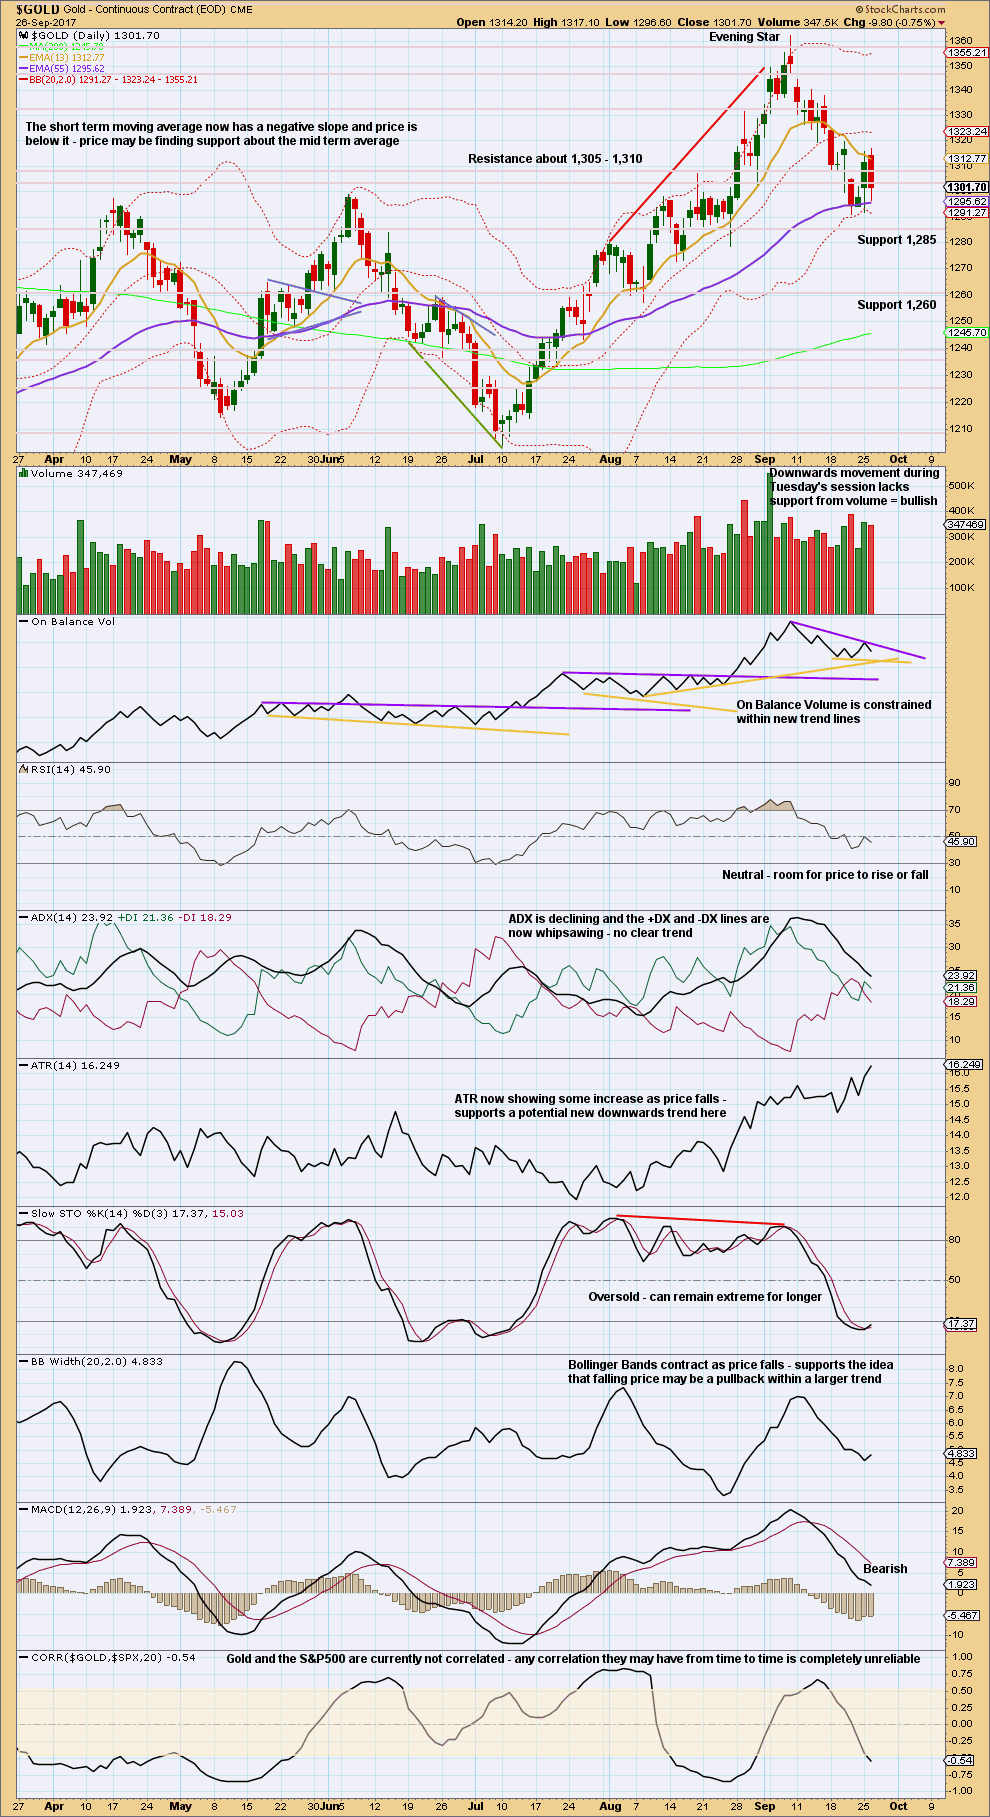
DAILY CHART
Click chart to enlarge. Chart courtesy of StockCharts.com.
Trend lines on On Balance Volume are adjusted today. On Balance Volume should be watched very carefully over the next few days. It must break out of these converging trend lines and when it does that shall offer a weak signal. The signal can only be weak because each line has only been tested twice before and neither are very long held.
A lack of support from volume for downwards movement during Tuesday’s session suggests weakness in downwards movement. This supports the alternate hourly wave count slightly; this is how B waves look.
Long lower wicks on the last two daily candlesticks are bullish. Volume short term is bullish. Stochastics is slightly bullish.
On Balance Volume is neutral. ADX is neutral. RSI is neutral.
ATR is bearish.
Overall, this chart is very mixed. It would be wisest to wait for a signal from On Balance Volume to have more confidence in the next direction for price here.
GDX
DAILY CHART
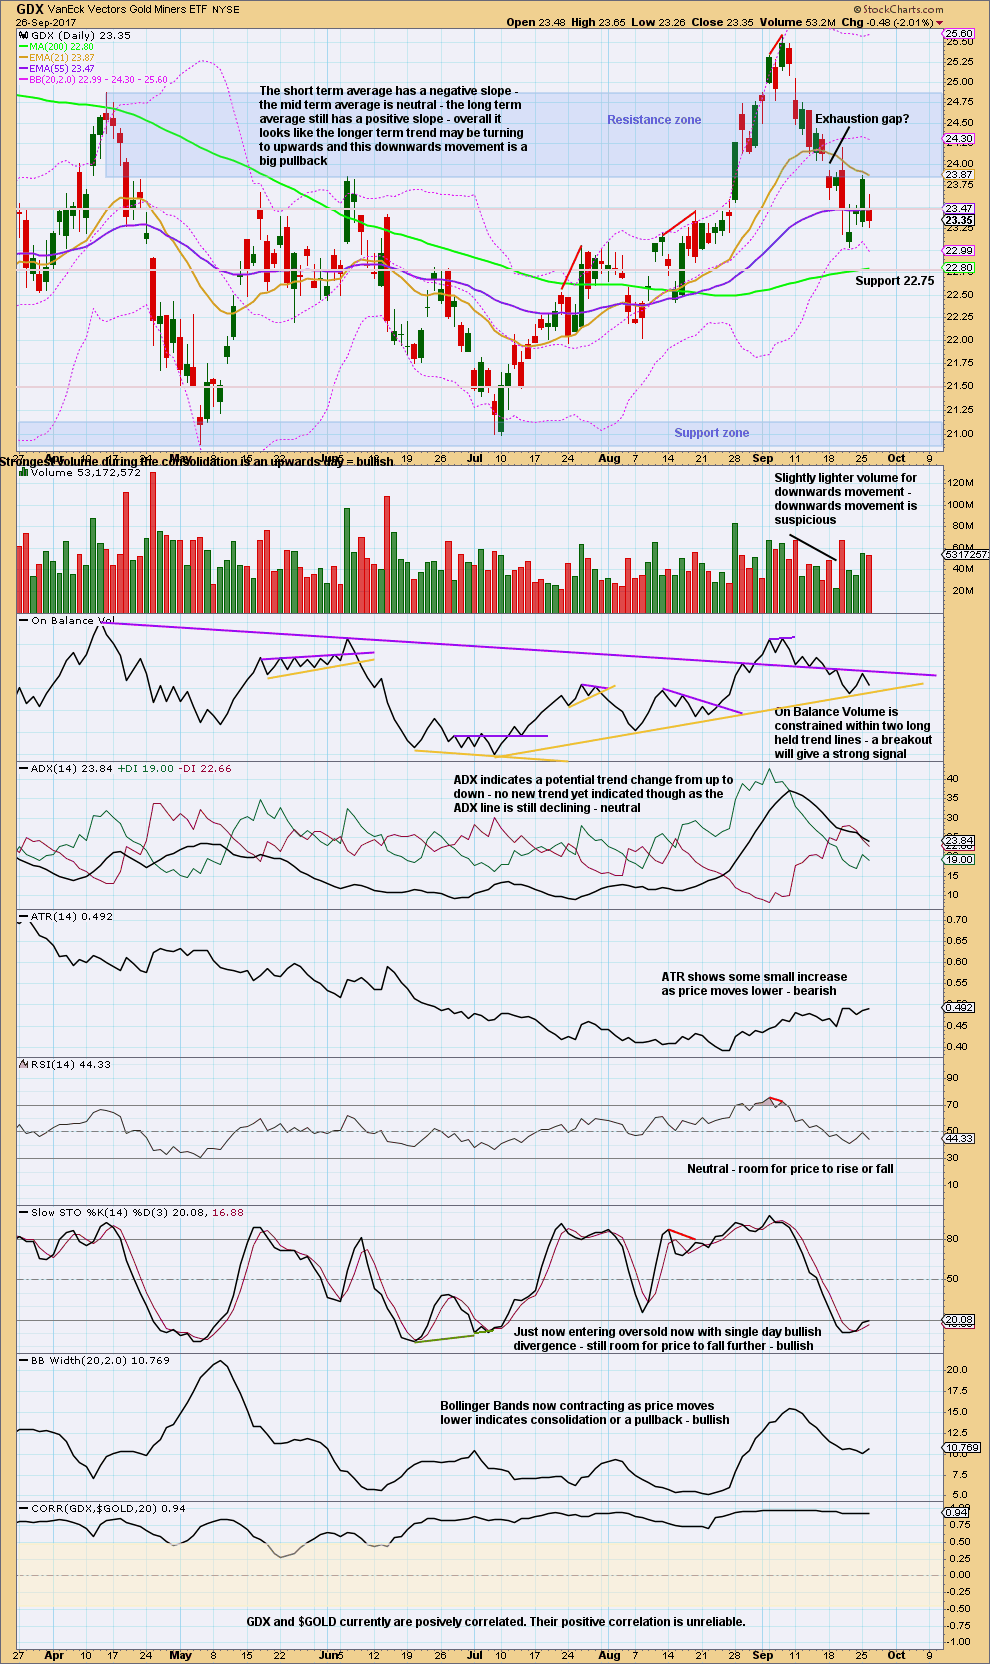
Click chart to enlarge. Chart courtesy of StockCharts.com.
GDX also lacks support from volume today for downwards movement. Short term volume for both markets is slightly bullish.
Both have trend lines on On Balance Volume, which are converging quickly, so a breakout will come soon. It would be wisest also to wait for an On Balance Volume signal for GDX to have confidence in the next direction for price.
Published @ 06:35 p.m. EST.
[Note: Analysis is public today for promotional purposes. Specific trading advice and comments will remain private for members only.]
Imo a bearish continuation for a bullish reversal in play. Takes a break below 1278 to target 1270/1269 (100dma). Gold price appears on track!
Note to Elliott Wave Gold Members: 27SEP17 @ 10:26 EST: Lara is on a plane to Hong Kong. In-flight wifi access was meant to be provided, but it appears wifi access is unavailable because I have not received any messages from Lara yet. Therefore, the probability she will be able to publish any analysis today is low. If the status changes, I will update this message. Thank you for your understanding. Cesar
Cesar, I understand.
Wi-fi coverage on board is very often intermittent. This is particularly so in the South China Sea route. I have flown this route many times and the worst outage I ever had was a good 40 minutes.
Cesar, thank you for updating. Lara’s analysis of the 26th and downside targets remain very valid and workable. Hope she has a pleasant flight.
Note to Elliott Wave Gold Members: 28SEP17 @ 06:07 EST: Lara is in Hong Kong. She is now preparing the analysis to publish before New York session opens. Thank you for your understanding. Cesar
Thanks guys! It was a lovely flight. But no wi-fi. Nada. Nothing. Not even a pretend. It was never on offer… despite what they told me when I booked.
GDX also shows a slight decline in volume on a down day, suggesting weakness in the downward movement.
Stochastics divergence with price suggests a bounce may be coming.
OBV is at horizontal support, albeit a slight overshoot of the uptrend line.
A bounce may be expected here.
Todays gap down in GDX was the 3rd gap within the downtrend. The second gap was filled. This may prove to be an exhaustion gap. If so, it should be filled rather quickly.
Slightly lower volume for a down day in gold suggests weakness in the downward momentum.
Stochastics divergence with price suggests a bounce may be coming.
OBV is now at support. A bounce may be expected here.
That’s exactly what I thought too when I saw that chart. Nice to see we agree there 🙂
I am about to get on a plane to Hong Kong 🙂
I will make every effort to get analysis done today on board. But if the internet connection does not allow me to connect to my data stream or website reliably enough to access data and upload charts, then there is a possibility that I may not be able to publish your analysis today.
No StockCharts data yet and so no conclusion on any signal from On Balance Volume.
Here is an updated for the first hourly chart. There is now a nice five down complete. Expect a bounce, it may be for a B wave.
Gold Ichimoku Daily Analysis
Data as at market close, September 26
================================
Gold prices whipsawed, reversing Monday’s rebound. On a fundamental basis, Monday’s spike was seen as a reaction to talks of war, but Tuesday saw no follow-through, and hence the buying mania was relieved. Technically speaking, the 5-day RSI failed to break through 50, and hence the drop. However, the drop was arrested by the 50-day MA at 1294.51. Moreover, although MACD is still red, the trajectory of the histogram is turning upward. This reflects consolidation. The next few sessions could remain chaotic. The 50-day MA has to hold for the bullish momentum to continue. If not, the market is going to continue selling, and probably best left alone. Gold will continue to face headwinds as risks recede, yet geopolitics could change everything in the blink of an eye. For now, I will remain on the sidelines until the situation becomes clearer.
Let’s see what Ichimoku has to offer. On the daily chart, the tenkan-sen has dropped below the kijun-sen since last Thursday. The cloud remains green, peaking at 1330 around October 22. I interpret this as being short-term slightly bearish, but intermediate term bullish. Gold prices should be targeting the 50% Fibonacci retracement of the rise from 1205.41 to 1357.09. This yields 1281.25. The next target would be the 61.8% at 1263.35. A technical rebound should then follow.
Alan, thank you very much for sharing your analysis with us all 🙂
It is greatly appreciated by me, and I know many others too.
lara mam wat about market up r down say one side dnt confuse
Viky.
Lara is not trying to confuse. The market is the one doing it. Don’t blame her. She is seeing the market as it is. She is presenting us the information to enable us to make our own choices. We should be using her analysis as the stepping stone in our trade decisions. It should be just an input, although I must admit a very honest and sincere one. The onus of making a final decision to buy or sell is ours. We have to take responsibility for that. We do not expect anyone to come along and hold our hands as we trade.
It is very much appreciated if you could give constructive opinions like most of us do. We each do our own homework and we do not just follow anyone blindly. We are wrong as often as we are right. Nobody can claim to be perfect; we all learn from one another along the way. Look at it this way: if I am always right, why do I bother to explain my trades to everyone else? I might as well trade on my own and get all the profits for myself. We are here to encourage and support one another. There is never an insistence that we are right. Humility is a virtue.
Hi Vicky
I have been a long time subsciber to Lara’s work and it is anything but confusing. I think it is very impolite to make such an accusation particularly since you appear to be a relatively new subsriber. May I politely suggest that you spend a little more time trying to learn from her analysis, as well as from the many other skillled members of the site who post regularly.
May I also politely ask that you make an effort to use complete sentences when you post and also check your spelling. Sometimes what you post is completely incomprehensible and this makes it difficult to give helpful responses. Thank you!
Verne and Alan, thank you for the illumination.