
Downwards movement was expected. Over the last week price has made a lower low and a lower high, but the weekly candlestick so far is green with continued deep bounces.
Summary: The bigger picture for Oil remains bearish. Each time price comes up to touch, or gets very close to the maroon trend line, it should react downwards from there.
The target remains at 34.34. The invalidation point is moved down now to 49.42. A strong increase in downwards momentum is still expected.
New updates to this analysis are in bold.
MONTHLY ELLIOTT WAVE COUNT
Click chart to enlarge.
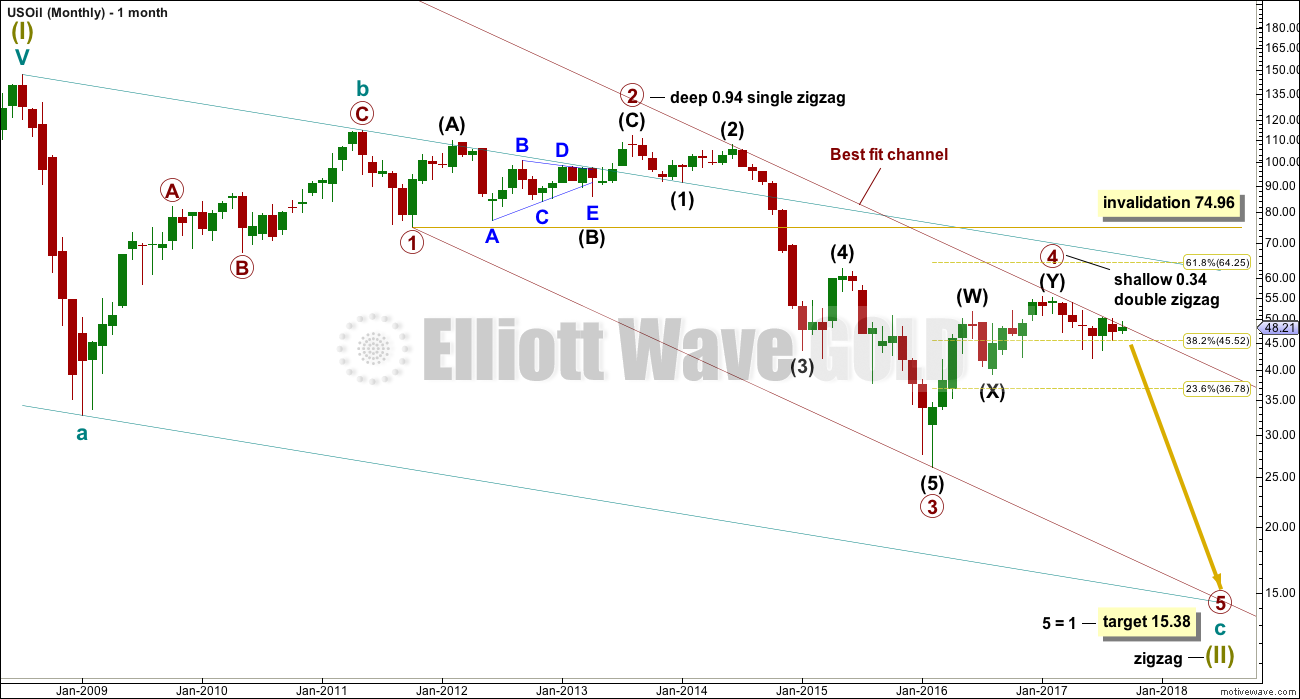
Within the bear market, cycle wave b is seen as ending in May 2011. Thereafter, a five wave structure downwards for cycle wave c begins.
Primary wave 1 is a short impulse lasting five months. Primary wave 2 is a very deep 0.94 zigzag lasting 22 months. Primary wave 3 is a complete impulse with no Fibonacci ratio to primary wave 1. It lasted 30 months.
There is alternation in depth with primary wave 2 very deep and primary wave 4 shallow. There is inadequate alternation in structure, both are of the zigzag family, but there is some alternation within structure. Primary wave 2 is a single zigzag and the triangle for intermediate wave (B) gives it a sideways look. Primary wave 4 is a sharper and quicker double zigzag.
If it continues, then primary wave 4 may not move into primary wave 1 price territory above 74.96.
WEEKLY ELLIOTT WAVE COUNT
Click chart to enlarge.
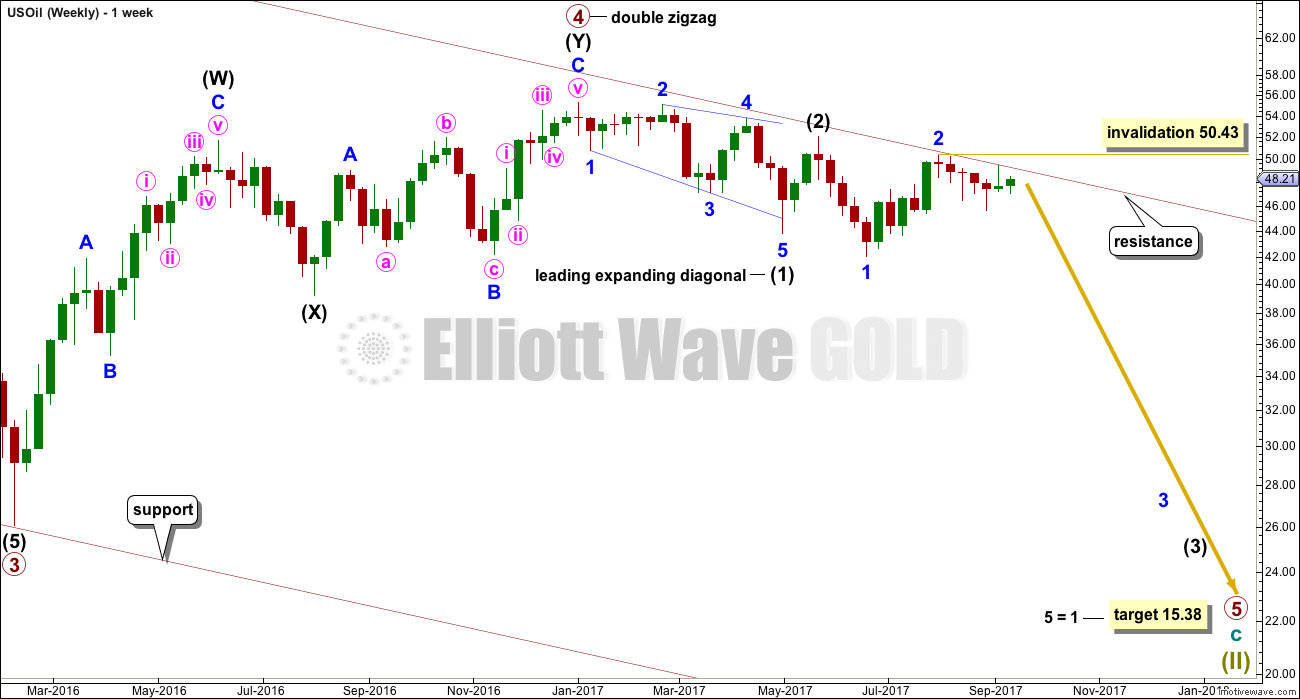
The wave count sees primary wave 5 beginning with a leading diagonal for intermediate wave (1), and now a deep expanded flat for intermediate wave (2). This has good proportion, and fits at the daily chart level.
Intermediate wave (3) may have now begun. It may only subdivide as an impulse. Within intermediate wave (3), minor waves 1 and 2 may be complete.
Price continues to find resistance just below the upper edge of the maroon channel, which is copied over from the monthly chart. Assume this wave count shall have the right look while price remains below that trend line. Only would an alternate be considered if that trend line is breached.
Within minor wave 3, no second wave correction may move beyond the start of its first wave above 50.43.
DAILY ELLIOTT WAVE COUNT
Click chart to enlarge.
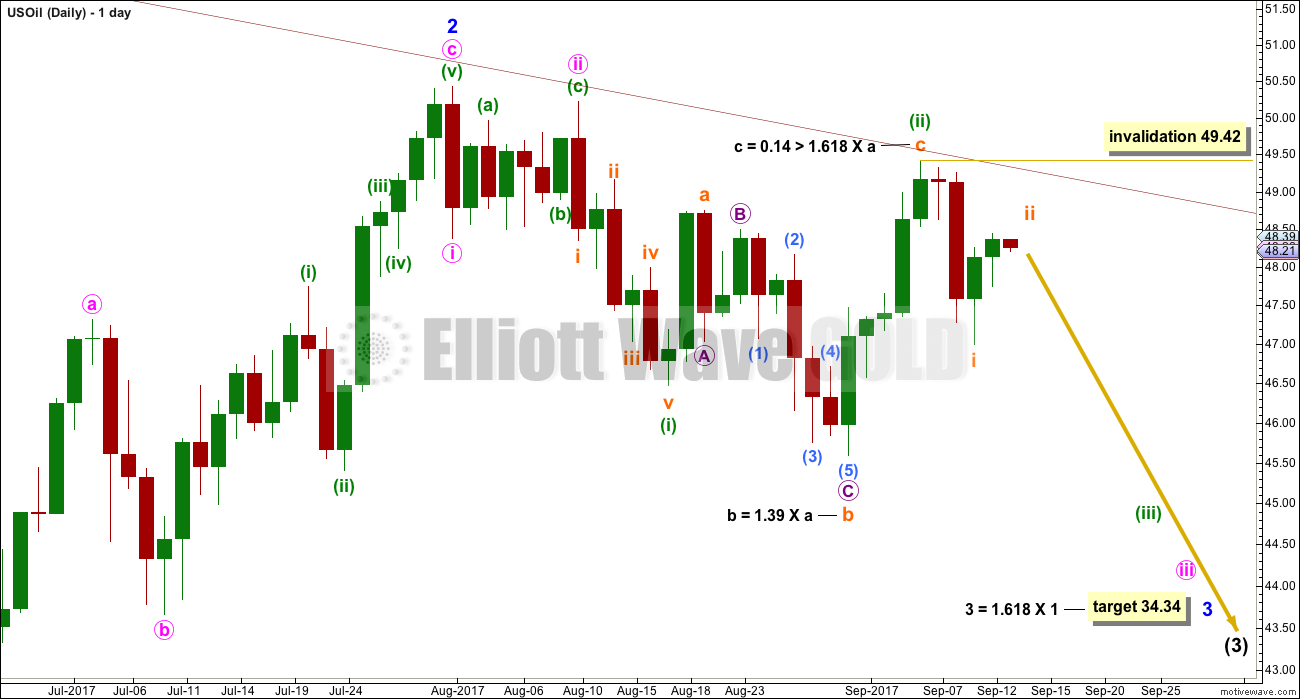
It looks like price is continuing to find very strong resistance at the upper maroon trend line, which is copied over from monthly and weekly charts.
Minor wave 3 is starting out slowly. Oil does seem to have a tendency to begin its impulses slowly, accelerate towards the middle, and end with very strong fifth waves. This tendency is typical of commodities. A good example may be seen on the monthly chart with the slow start to cycle wave c: primary wave 1 was very short, primary wave 2 was deep and time consuming, and primary wave 3 began with another short wave for intermediate wave (1) and another deep correction for intermediate wave (2).
When this third wave gets going, it should then exhibit a strong increase in downwards momentum.
The target for minor wave 3 remains the same.
Subminuette wave ii may not move beyond the start of subminuette wave i above 49.42. If it does continue higher, then expect it to find very strong resistance at the upper maroon trend line. That line should not be breached if this wave count is correct.
TECHNICAL ANALYSIS
DAILY CHART
Click chart to enlarge. Chart courtesy of StockCharts.com.
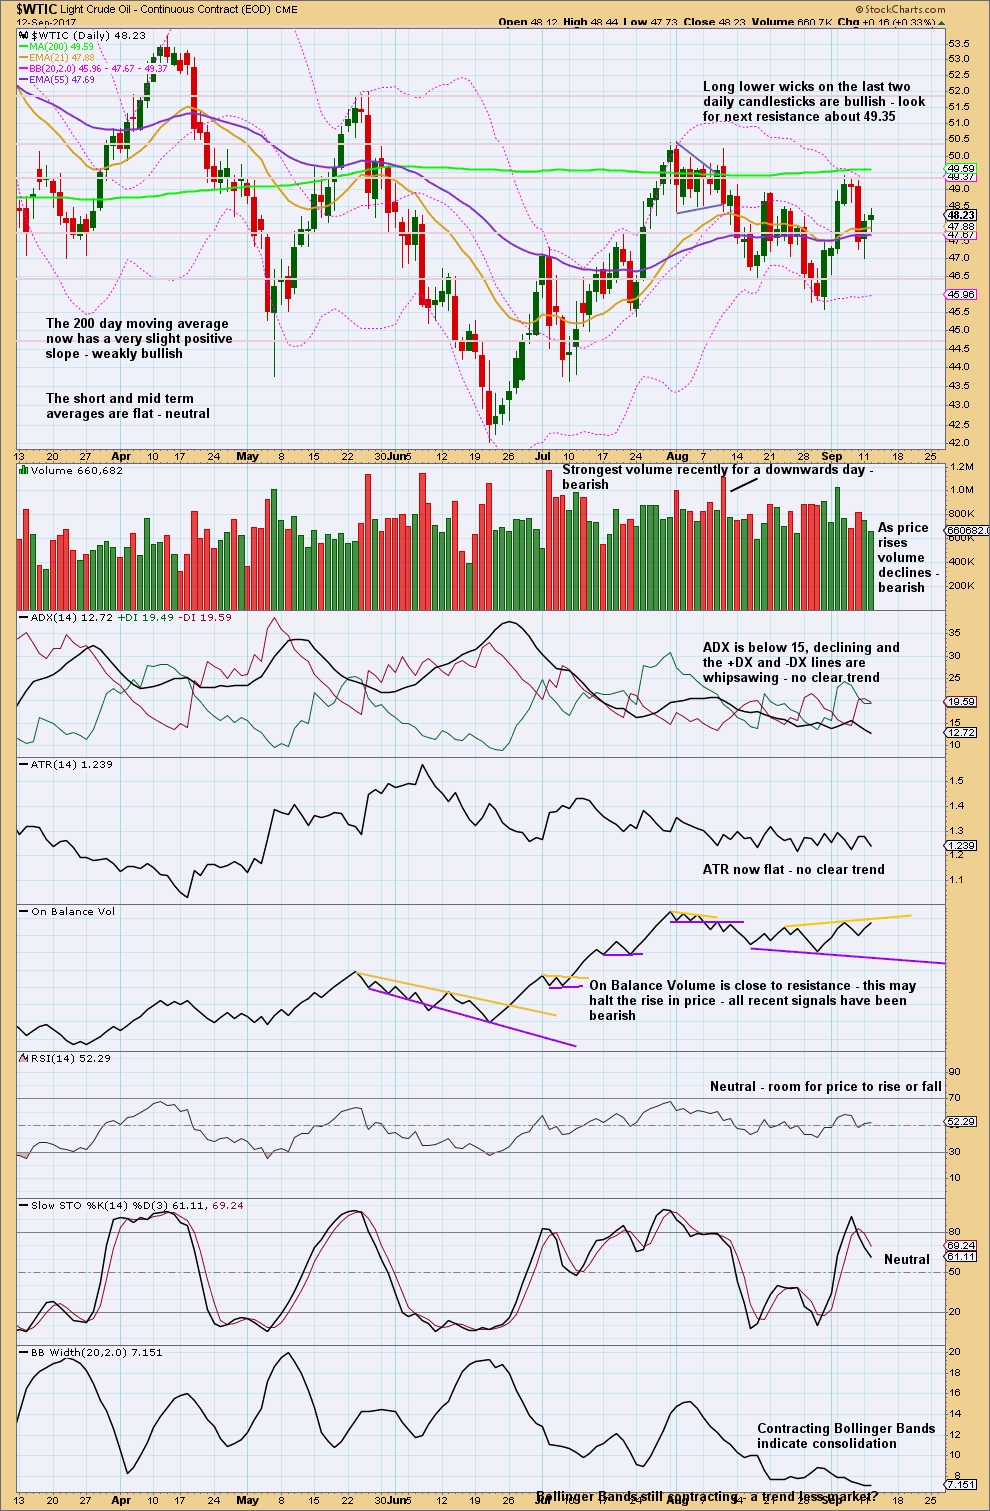
Recent days’ strongest volume is for downwards movement through the months of May to August. This strongly suggests that the larger trend is still down and upwards movement is still a counter trend movement. So far this year Oil has made a series of lower lows and lower highs, the definition of a downwards trend, although the bounces have been deep and time consuming.
For the shorter term, Oil entered a smaller consolidation range about the 25th of July. Resistance is about 50.40 and support is about 46.45 to 45.60. During this consolidation, it is the downwards day of the 10th of August that has clearly stronger volume suggesting a downwards breakout from this smaller consolidation.
ADX, ATR and Bollinger Bands all indicate that price is consolidating.
With Stochastics just returning now from oversold and price close to resistance, expect a downwards swing for the short term.
VOLATILITY INDEX
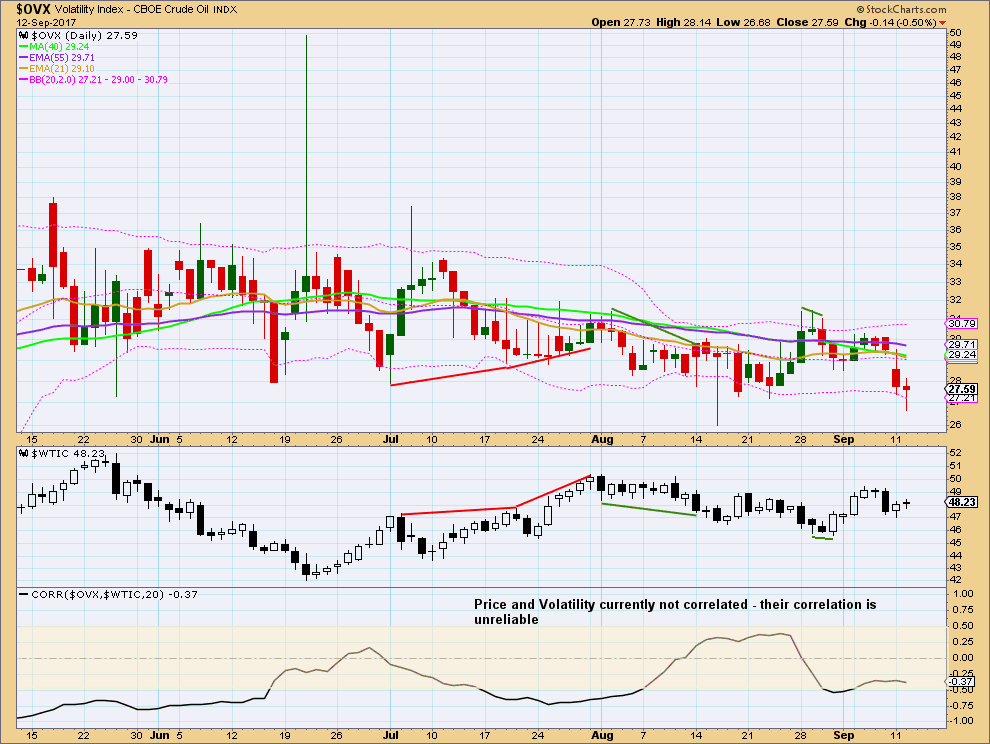
Click chart to enlarge. Chart courtesy of StockCharts.com.
Normally, volatility should decline as price rises and volatility should increase as price falls. Divergence from this normal can provide a bullish or bearish signal for Oil. However, it is noted that this signal occurs both in minor and major lows and it cannot be used to distinguish between them.
No new short term divergence is noted between price and volatility. It is noted that the correlation co-efficient indicates that currently these markets are not inversely correlated.
TRADING ADVICE
[wlm_private “GOLD Daily YT|GOLD Daily NT|GOLD Daily NTGR|GOLD DAILY 6M NT|GOLD DAILY 6M YT|GOLD DAILY 6M NT GFR|GOLD Plus Daily YT|GOLD Plus Daily NT|OIL SILVER Weekly YT|OIL SILVER Weekly NT|GOLD Plus Daily 6M NT|GOLDPLUSDAY6M|OIL SILVER Weekly 6M NT|GOLDPLUSDAY1M|GOLDPLUSDAY1MYT|GOLDDAY6M|GOLDDAY1M|GOLDDAY1MYT|OILSILVERWEEK6M|OILSILVERWEEK1M|OILSILVERWEEK1MYT”]Another entry point to go short is offered each time price gets close to the maroon trend line. Stops should be set just a little above the line. Allow for very small overshoots. But if that line is breached or even strongly overshot, then short positions should be exited. Profit target is at 34.34.
Always trade with stops. Invest only 1-5% of equity on any one trade.
[/wlm_private]
MONTHLY ELLIOTT WAVE COUNT – JULY 2014

Click chart to enlarge.
This is from the 2014 archives.
I have had for a long time a bearish outlook for US Oil. Back in 2014 I even received some disparaging comments about it, but that’s okay because the record shows that so far the bigger picture was right.
I did struggle for some time with cycle wave b: how to label it, where it ended, and what would be the subsequent structure after it. But this came right some time later and now I am more comfortable with how this movement is currently labelled.
On the post for July 2014, the weekly chart target for the mid term was 74.53.
Published @ 03:52 a.m. EST.
[Note: Analysis is public today for promotional purposes. Specific trading advice and comments will remain private for members only.]
Lara, any comments here would be greatly appreciated.
Sorry Dean. Updating Oil analysis now.
I guess we are looking now at the weekly invalidation of 50.43 but this the strength of the candles looks very bullish.
Hi Lara,
just a quick question as we have reached 49.60 and overshoot the invalidation point at 49.42. are we still in a bear market as the weekly invalidation point 50.43 is still in place?
Your questions will be answered in the update, shortly to be published.
thanks for the update Lara
You’re welcome Nick 🙂