
The overall upwards trend continues.
Summary: Note that inaccurate data from StockCharts substantially reduces the confidence in classic technical analysis today.
While price remains above 1,284.48 and most importantly within the pink base channel on the main hourly chart, assume the trend remains the same, upwards. The target is at 1,319 in the first instance and may be as high as 1,412.
If price breaks below the base channel, then expect a pullback to test support at prior resistance is underway. The target for it to end would be firstly at 1,281 but may be as low as 1,273. If a pullback does eventuate here, then use it as an opportunity to join the new upwards trend.
Always use stops and invest only 1-5% of equity on any one trade.
New updates to this analysis are in bold.
Last monthly charts for the main wave count are here, another monthly alternate is here, and video is here.
Grand SuperCycle analysis is here.
The wave counts will be labelled first and second. Classic technical analysis will be used to determine which wave count looks to be more likely. In terms of Elliott wave structure the second wave count has a better fit and fewer problems.
FIRST ELLIOTT WAVE COUNT
WEEKLY CHART
Click chart to enlarge.
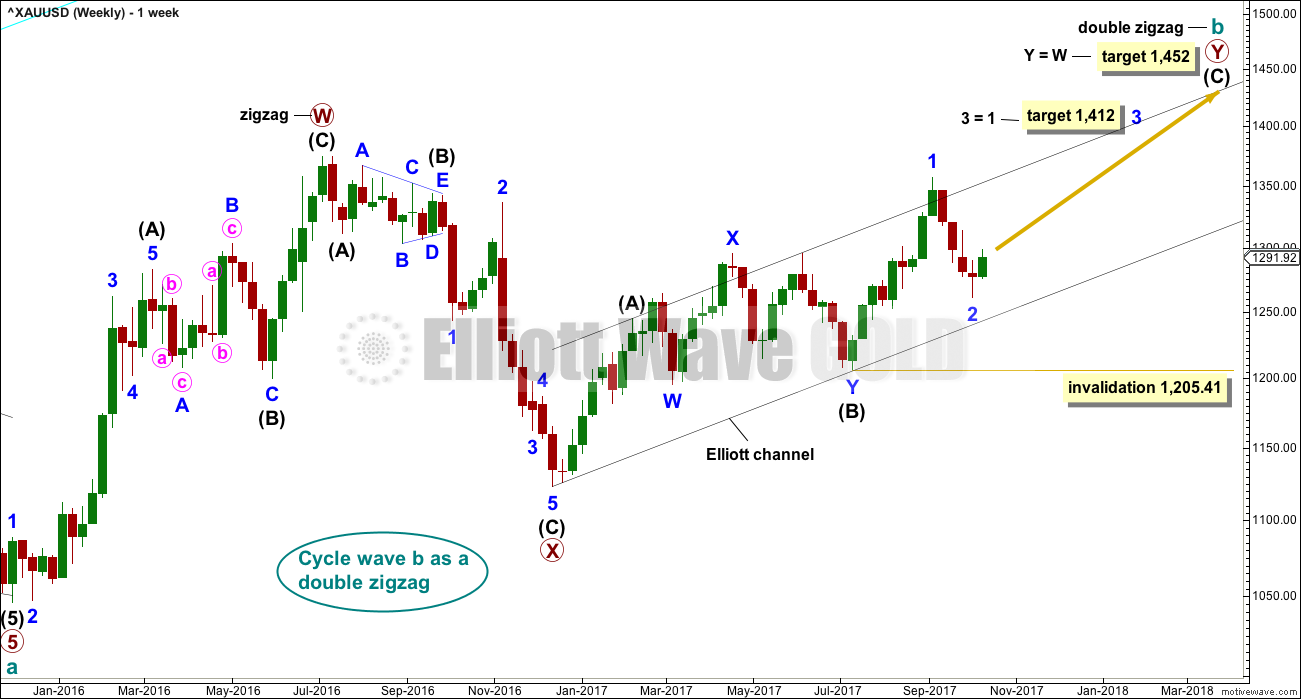
There are more than 23 possible corrective structures that B waves may take, and although cycle wave b still fits well at this stage as a triangle, it may still be another structure. This wave count looks at the possibility that it may be a double zigzag.
If cycle wave b is a double zigzag, then current upwards movement may be part of the second zigzag in the double, labelled primary wave Y.
The target remains the same.
Within intermediate wave (C), no second wave correction may move beyond the start of its first wave below 1,205.41. However, prior to invalidation, this wave count may be discarded if price breaks below the lower edge of the black Elliott channel. If this wave count is correct, then intermediate wave (C) should not break below the Elliott channel which contains the zigzag of primary wave Y upwards.
There are two problems with this wave count which reduce its probability in terms of Elliott wave:
1. Cycle wave b is a double zigzag, but primary wave X within the double is deep and time consuming. While this is possible, it is much more common for X waves within double zigzags to be brief and shallow.
2. Intermediate wave (B) within the zigzag of primary wave Y is a double flat correction. These are extremely rare, even rarer than running flats. The rarity of this structure must further reduce the probability of this wave count.
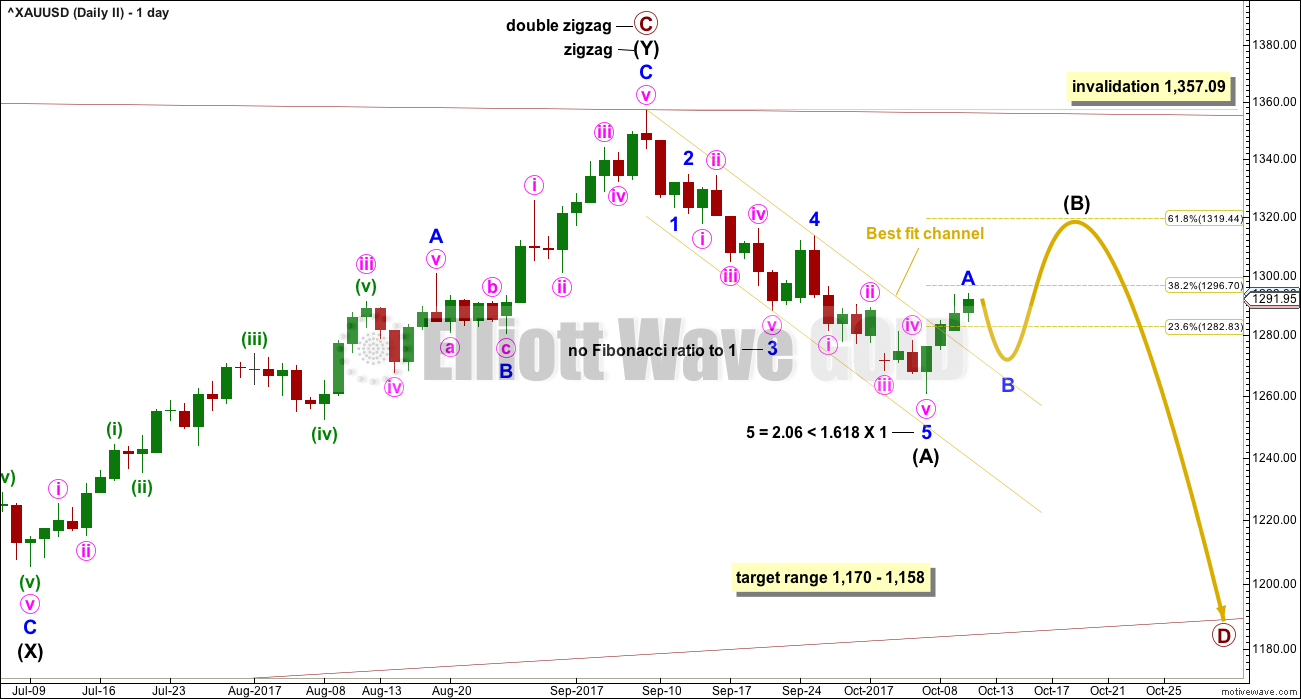
DAILY CHART
Click chart to enlarge.
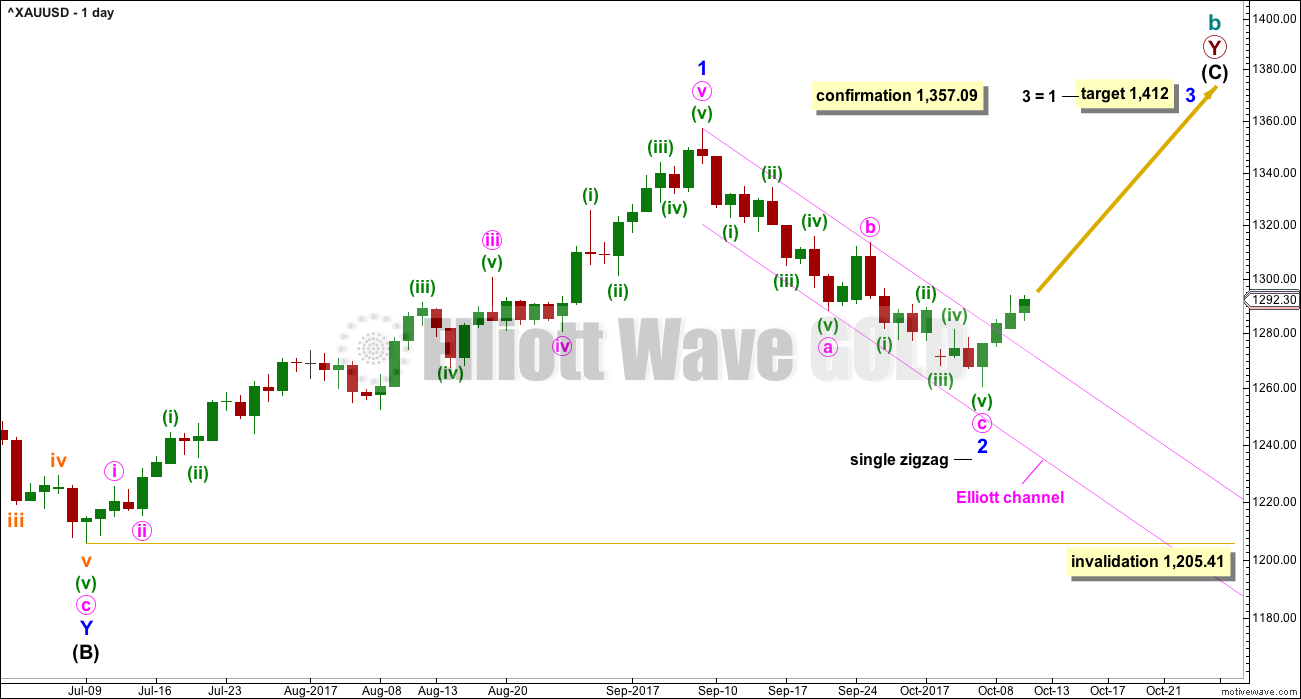
The analysis will focus on the structure of intermediate wave (C). To see details of all the bull movement for this year see daily charts here.
Intermediate wave (C) must be a five wave structure, either an impulse or an ending diagonal. It is unfolding as the more common impulse.
It is possible that minor waves 1 and now 2 may both be over. Minor wave 2 may have ended very close to the 0.618 Fibonacci ratio. If it continues lower, then minor wave 2 may not move beyond the start of minor wave 1 below 1,205.41.
Minor wave 1 lasted 44 days and minor wave 2 may have lasted 20 days, just one short of a Fibonacci 21.
It is of some concern now that minor wave 3 appears to be starting out rather slowly. This is somewhat unusual for a third wave and offers some support now to the second Elliott wave count. When StockCharts data is fixed, then this rise in price of the last few days may be more accurately analysed.
HOURLY CHART
Click chart to enlarge.
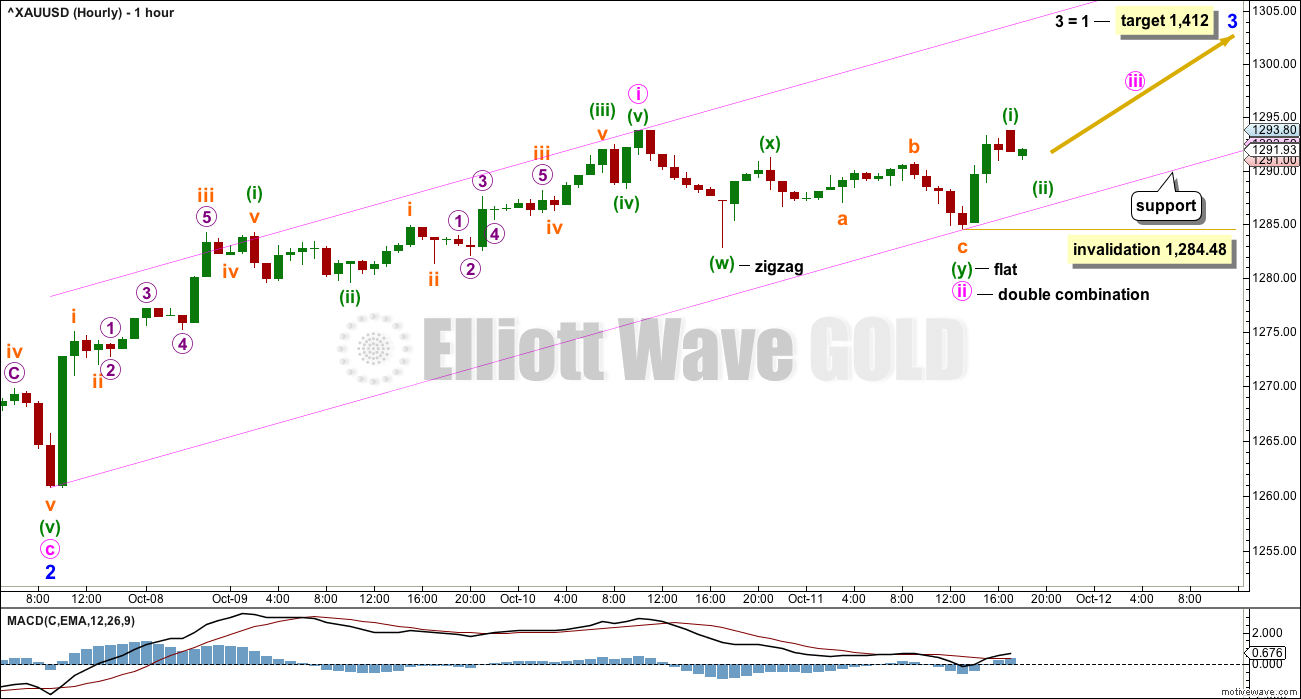
Assume the trend remains the same until proven otherwise. It is possible that minute wave ii may be over as a very shallow double combination.
If this first hourly wave count is correct, then within minute wave iii any corrections should find very strong support at the lower edge of the pink base channel about minute waves i and ii. Minuette wave (ii) may not move beyond the start of minuette wave (i) below 1,284.48.
This first wave count requires more upwards movement to have support from volume and exhibit an increase in upwards momentum.
If price breaks below the lower edge of the base channel, then use the alternate hourly chart below.
ALTERNATE HOURLY CHART
Click chart to enlarge.
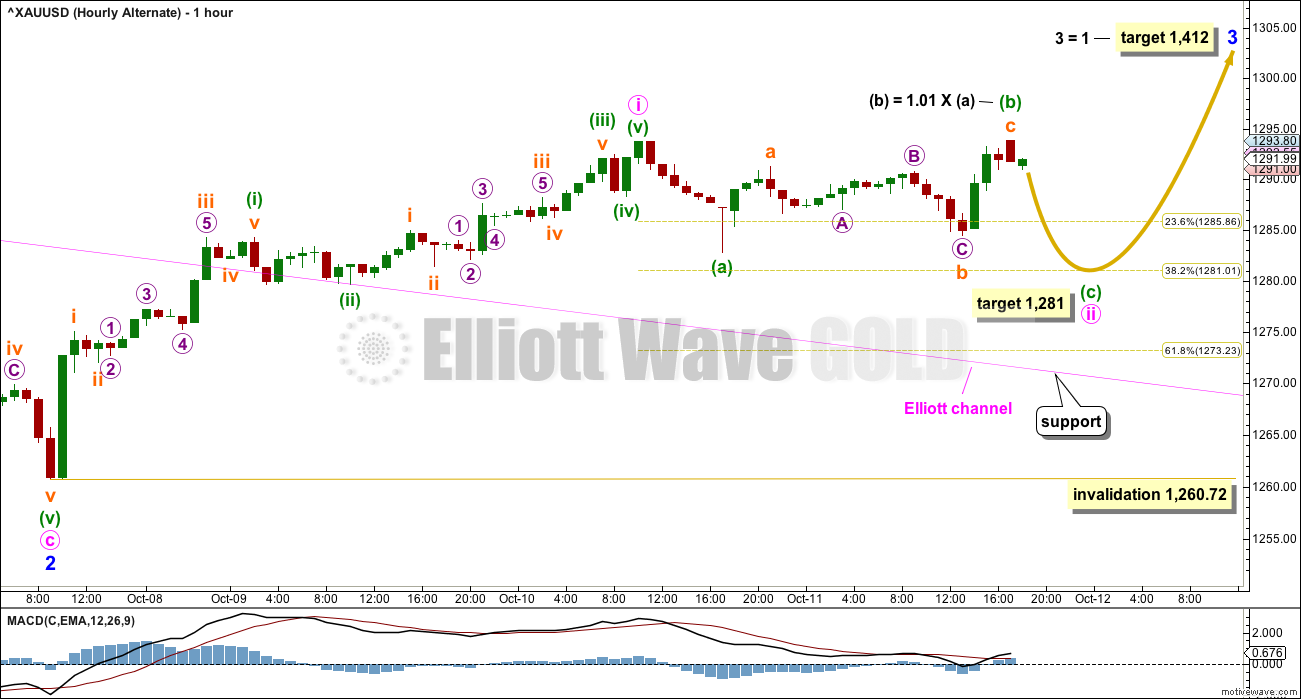
If price breaks below the lower edge of the pink base channel on the first hourly chart, expect a pullback to test support at prior resistance is underway. Prior resistance was the upper edge of the pink Elliott channel, which has been copied over here from the first daily chart.
The first second wave correction at the start of a new trend for Gold is almost always very deep. If the target here is wrong, it may not be low enough.
Minute wave ii may not move beyond the start of minute wave i below 1,260.72.
SECOND ELLIOTT WAVE COUNT
WEEKLY CHART

Click chart to enlarge.
It is still possible that cycle wave b is unfolding as a regular contracting or barrier triangle.
Within a triangle, one sub-wave should be a more complicated multiple, which may be primary wave C. This is the most common sub-wave of the triangle to subdivide into a multiple.
Intermediate wave (Y) now looks like a complete zigzag at the weekly chart level.
Primary wave D of a contracting triangle may not move beyond the end of primary wave B below 1,123.08. Contracting triangles are the most common variety.
Primary wave D of a barrier triangle should end about the same level as primary wave B at 1,123.08, so that the B-D trend line remains essentially flat. This involves some subjectivity; price may move slightly below 1,123.08 and the triangle wave count may remain valid. This is the only Elliott wave rule which is not black and white.
Finally, primary wave E of a contracting or barrier triangle may not move beyond the end of primary wave C above 1,295.65. Primary wave E would most likely fall short of the A-C trend line. But if it does not end there, then it can slightly overshoot that trend line.
Primary wave A lasted 31 weeks, primary wave B lasted 23 weeks, and primary wave C lasted 38 weeks.
The A-C trend line now has too weak a slope. At this stage, this is now a problem for this wave count, the upper A-C trend line no longer has such a typical look.
Within primary wave D, no part of the zigzag may move beyond its start above 1,357.09.
DAILY CHART
Click chart to enlarge.
This second wave count expects the new wave down may be deeper and longer lasting than the first wave count allows for.
A common length for triangle sub-waves is from 0.8 to 0.85 the length of the prior wave. Primary wave D would reach this range from 1,170 to 1,158.
If primary wave C is correctly labelled as a double zigzag, then primary wave D must be a single zigzag.
Within the single zigzag of primary wave D, intermediate wave (A) is labelled as a complete impulse.
Intermediate wave (A) lasted 20 days, just one short of a Fibonacci 21. Intermediate wave (B) may be about the same duration, so that this wave count has good proportions, or it may be longer because B waves tend to be more complicated and time consuming.
Intermediate wave (B) may be a sharp upwards zigzag, or it may be a choppy overlapping consolidation as a flat, triangle or combination.
HOURLY CHART
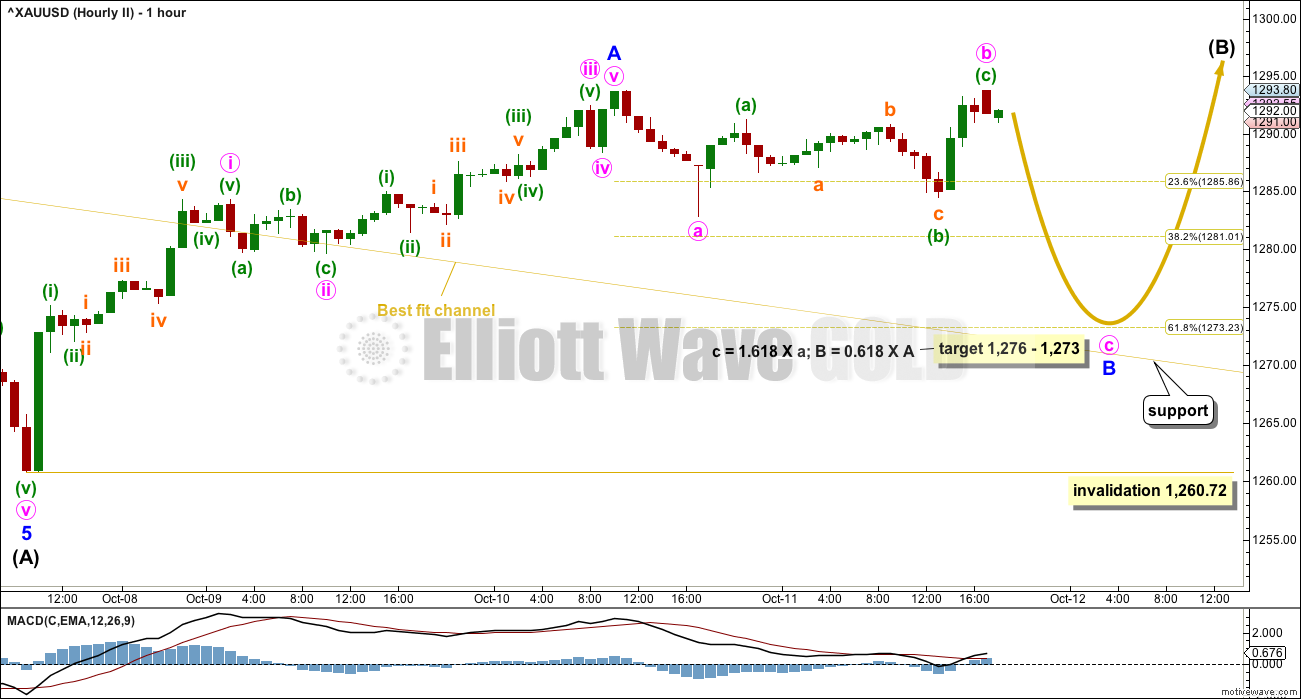
Click chart to enlarge.
This hourly chart is essentially the same as the alternate hourly chart for the first wave count. The target is different though.
If the target for the alternate hourly wave count is wrong, it may not be low enough. This hourly chart shows a lower target which may be slightly more likely. This target would expect a test of support at the upper edge of the yellow best fit channel (this channel is drawn in exactly the same way as the pink Elliott channel on the first wave count).
TECHNICAL ANALYSIS
WEEKLY CHART
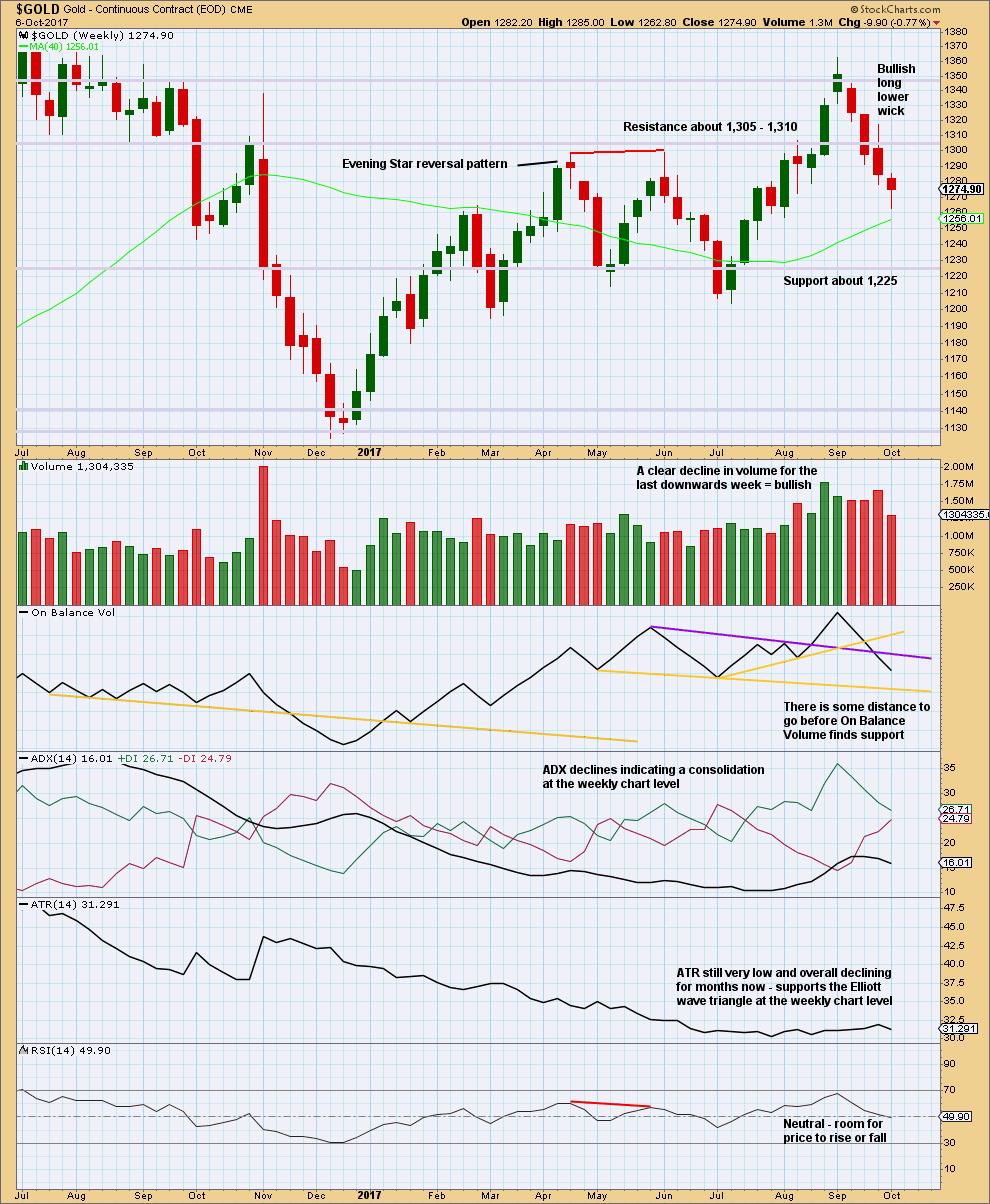
Click chart to enlarge. Chart courtesy of StockCharts.com.
The candlestick for last week is not a Hammer reversal pattern. The lower shadow must be at minimum twice the length of the real body and this one falls short. The long lower wick is still bullish though.
The lower wick with a decline in volume for downwards movement last week does look like at least an interim low is in place.
DAILY CHART
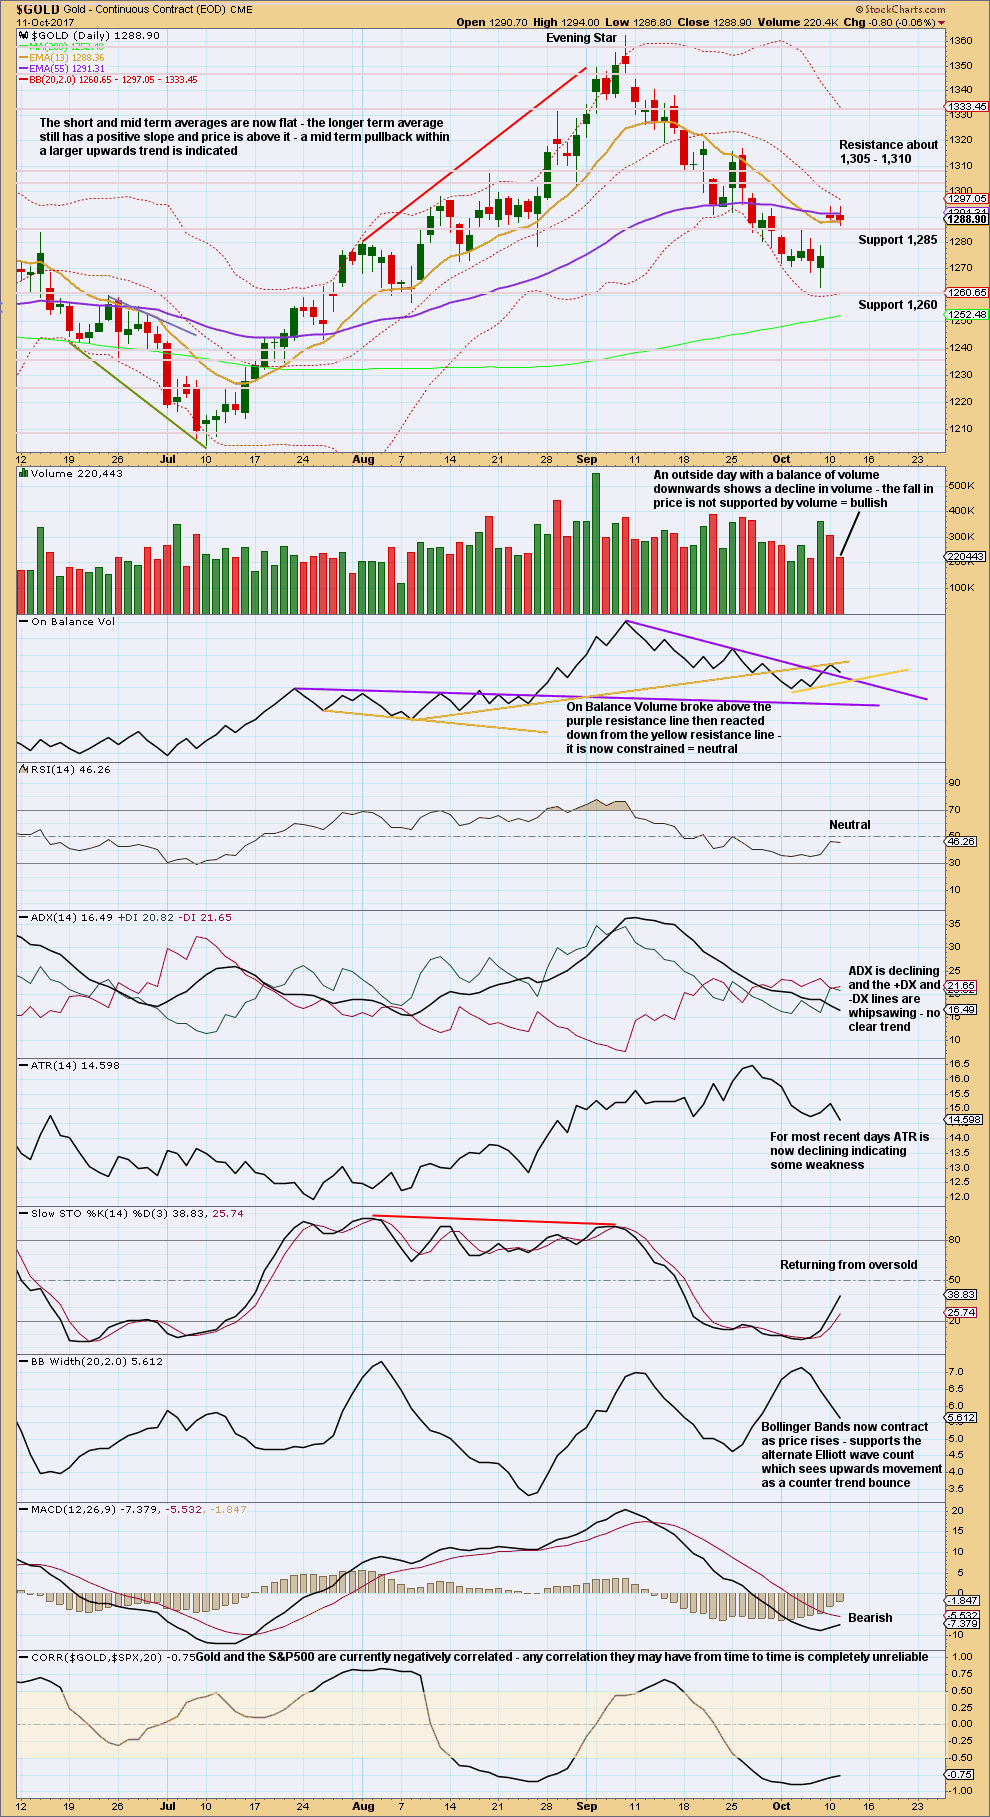
Click chart to enlarge. Chart courtesy of StockCharts.com.
StockCharts data for $GOLD has been inaccurate for two sessions now. This makes any confidence in classic analysis impossible. This analysis comes with this caveat.
If this On Balance Volume is to be believed, then it is bullish. I have no confidence in volume bars for the last three sessions here.
There is room for price to rise. Look for resistance about 1,305 to 1,310.
Click chart to enlarge.
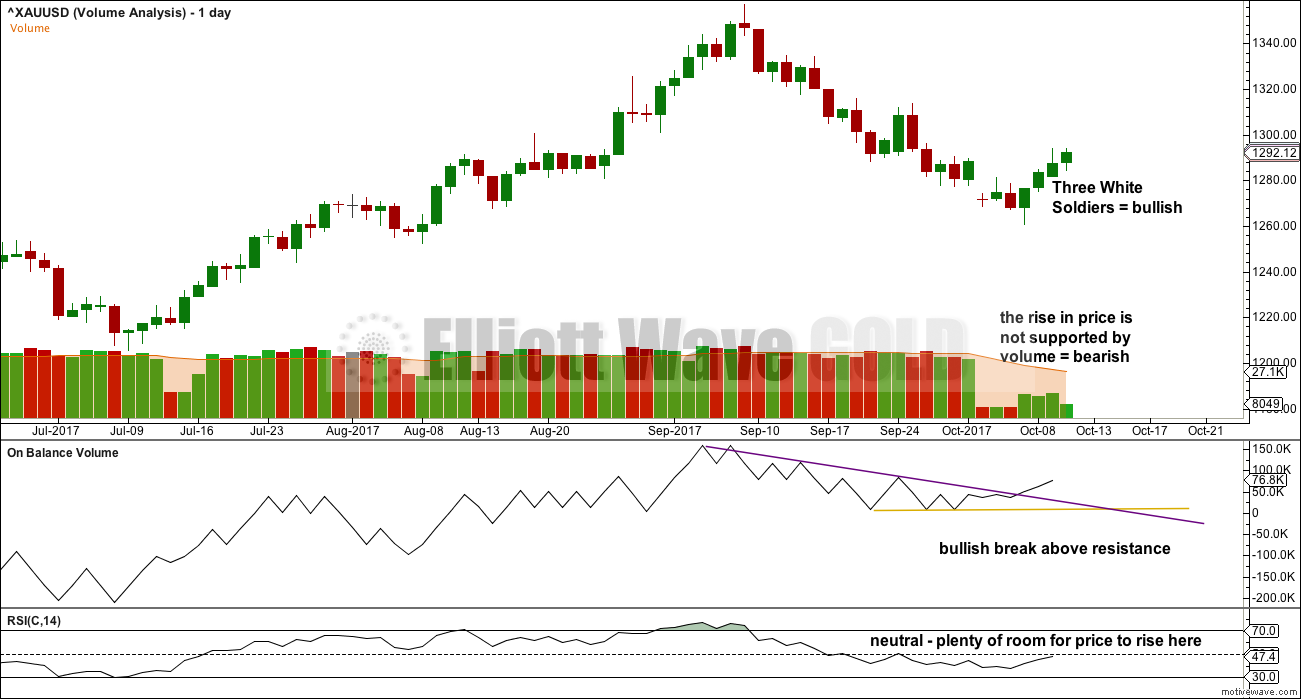
With this chart, I’m using BarChart data for some volume analysis.
The very light volume for the last four sessions does not support the rise in price, so it is suspicious. This offers more support to the second Elliott wave count, which sees upwards movement as a B wave. B waves should exhibit weakness.
I do not like using BarChart and MotiveWave for On Balance Volume analysis because it squashes On Balance Volume into too small a space and does not allow for accurate trend line analysis. The trend lines here are different for this reason. If this data is used, then On Balance Volume looks more bullish.
GDX
DAILY CHART
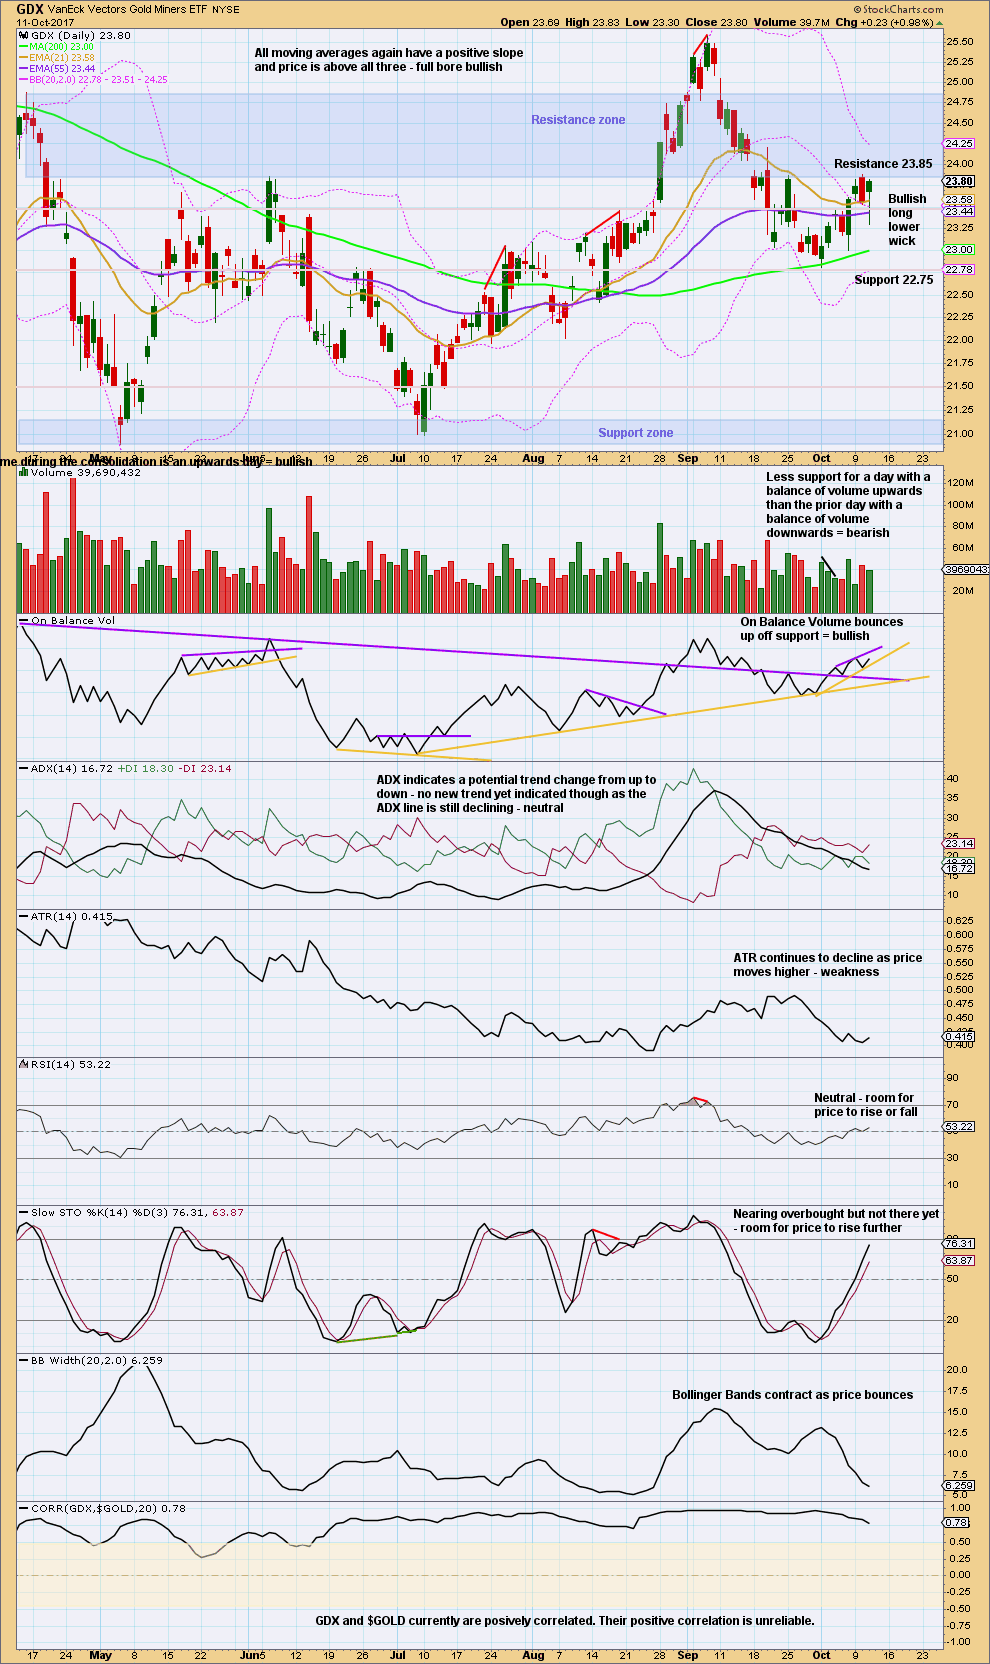
Click chart to enlarge. Chart courtesy of StockCharts.com.
The reversal pattern of the Bearish Engulfing candlestick for yesterday’s session may now be fulfilled. Today’s candlestick has a very long lower wick, which is bullish.
This candlestick may also be read as a Hanging Man pattern, but the bullishness of the long lower wick on a Hanging Man pattern means it requires bearish confirmation from the next session before it can be read as bearish.
Overall, this chart suggests an upwards day for GDX tomorrow.
Published @ 09:13 p.m. EST.
[Note: Analysis is public today for promotional purposes. Specific trading advice and comments will remain private for members only.]
StockCharts data is fixed and is accurate.
The reason why the 9th of October was missing was Columbus Day. Chicago was closed, they’re using CME exchange data for $GOLD and so no data for that date.
We can now have confidence in StockCharts data for $GOLD today.
I am sorry everybody for not posting a chart prior to the close of the NY session, it has been a late and disharmonious start to the day here for me.
Working on your analysis now which will be published shortly.
Thank you.
Mixed feelings about this move. Feels very b-wavey and could very well roll over tomorrow big time. i believe there is some important data out tomorrow morning, which may further move December rate move odds. I think the gold market is waiting for that, and it could explain lack of any follow through today. I like the idea of being long given all that’s going on but this could be just a little retrace back up to the breakdown point before a big plunge. Tough to call, and my strategy is to stay small here. The patterns being carved out are a little too ambiguous and can be interpreted both ways
I agree, it looks weak. That’s exactly what we would expect to see for a B wave.
For this reason at this time I am favouring the second wave count which sees it as intermediate (B) upwards.
Looks like a clean “5” up from the 1,284ish low. I think that now favors the 1st hourly chart. We may start to see an increase in upwards momentum very soon…
Lara, just an idea… when you post on StockTwits for promotion, I bet that you will get many more followers and readers if you insert a bunch of relevant “cash tags” into each post, such as:
$GLD, $XAUUSD, $GDX, $GDXJ, $NUGT, $DUST, $JNUG, $JDST
Then when someone looks at only the $JNUG stream for example, they will see your post. 🙂
Thank you Dreamer, a very good idea. I’ll email this to Cesar, he’s the one who does the StockTwits for us 🙂
Hi Lara,
You’re talking about the wrong data about a month “Note that inaccurate data from StockCharts” you mean lot of wrong data. you need to change the data source.
’cause you got me wrong.” I’m dissapointed.
with best regards,
Huriye Gökağaçlı
BarChart data was inaccurate for three days; 27th September, 28th September and 2nd October. I has been fixed now for over a week.
StockCharts data is now inaccurate for three days; 9th October, 10th October and 11th October. It is now fixed today.
This is not the wrong data “for about a month”, it is a total of six sessions affected. For each session I still have a second data source to consult.
I am limited to data sources which can synchronise with Motive Wave for Macs. For classic analysis StockCharts is the best source and most widely used, it is very rare for them to have problems.
I am just as frustrated as you with this issue and have been contacting each data provider daily (for data for which I am paying) with polite and professional requests for it to be fixed.
You have been a member for a long time and so you will be aware that the current problems experienced with data feeds is highly unusual. And I hope you will understand that this problem is not of my making and that I am doing everything I can to work with it.
Gold Ichimoku Daily Analysis
Data as at 4:10 am ET, October 12
=============================
Gold prices continued to rise as the FOMC minutes were dovish. The minutes gave a grim and general commentary of the economy with no specific timelines for the next rate hike. The December rate hike had been baked in for quite a while, and the absence of mention led investors to vote immediately for gold. The centre stage of the Fed minutes completely eclipsed the news of the flight of two military bombers over the Korean peninsula in a show of force late last Tuesday and that Trump had met top defence officials to discuss how to respond to any threat from North Korea. Today, we have the PPI data and this might provide one last opportunity for the dollar bulls to make a stand, and also for the markets to continue to wallow in the belief that there is still a rate hike at the end of the year after all.
The 4-hour Ichimoku chart shows that gold prices had completely broken above the kumo. However, prices have now reached 1297, the important 38.2% Fibonacci resistance. This could justify a pullback towards the upper cloud boundary near 1290 now (incidentally also current tenkan-sen support at 1290.87), but sloping towards 1286 later in the day. The next support is the current kijun-sen at 1278.93. A pullback with a higher low would provide more strength to the upside momentum.
Lara. Like Dreamer, I was thinking what if the gold wave count is also of nested 1-2s?
Comparing with the annotation in your First Elliott Hourly Count, what if Minuette 3 of Minute 1 is not complete yet, that:
Minute 1 labelled at 1293.72 is actually Subminuette 1 of Minuette 3;
Minuette W at 1282.80 is Subminuette 2;
Minuette X at 1291.22 is micro 1 of Subminuette 3;
Minute 2 at 1284.48 is micro 2?
Then, we have three 1-2s in Minute 1 which indicates that the big spike up on volume is yet to occur. For your consideration please.
will chart and consider that
but it has very little support now from classic TA, especially volume
So what’s up with GDX?
I see 2 possible bullish scenarios that account for the movement over the last 7 days since the bottom @ 22.81
The 1st bullish scenario is a set of nested 1-2’s, since there is overlap. Powerful 3rd waves often start out this way. On balance volume may support this view. If this is correct, a strong move up should follow over the next week or two and Saurabh will likely get the 10%+ up day(s) he is looking for in JNUG or NUGT.
The second bullish scenario is that a leading expanding diagonal is forming and the 5th wave is underway. the minimum target for the 5th wave to be longer than the 3rd wave is 24.19, but it will likely be much higher.
Either way, tomorrow should be an up day. Good luck!
https://www.tradingview.com/x/coAnFtYl/
Thanks Dreamer. Good. I thought of nested 1-2 as well. Leading diagonal never occurred to me.
That looks like a really good solid wave count Dreamer.
I have a couple of alternate ideas… and I think it’s way beyond time that I published a GDX EW analysis.
Will be working on that and BitCoin later today. Cesar thinks BitCoin may be done… but I’m not so sure.