
Has the Bitcoin bubble burst? I look at price and volume, along with trend lines, to answer this question.
Last analysis stated: “Instead of trying to figure out where this bubble may go, I’ll focus on figuring out when it may have popped. A strong bearish candlestick pattern at the weekly chart level and a trend channel or trend line breach will be looked for.”
There is a completed weekly candlestick at the end of today’s session, and it is a strong bearish engulfing candlestick pattern.
But the channel is not yet breached.
Volume supports the idea of a high in place, but the bottom line is that there is substantial risk to any short position while price remains within the channel.
Look now for a bounce to not make a new all time high, which should exhibit weakness in volume. Then look for the channel breach.
Manage risk diligently.
ELLIOTT WAVE CHARTS
2 WEEKLY
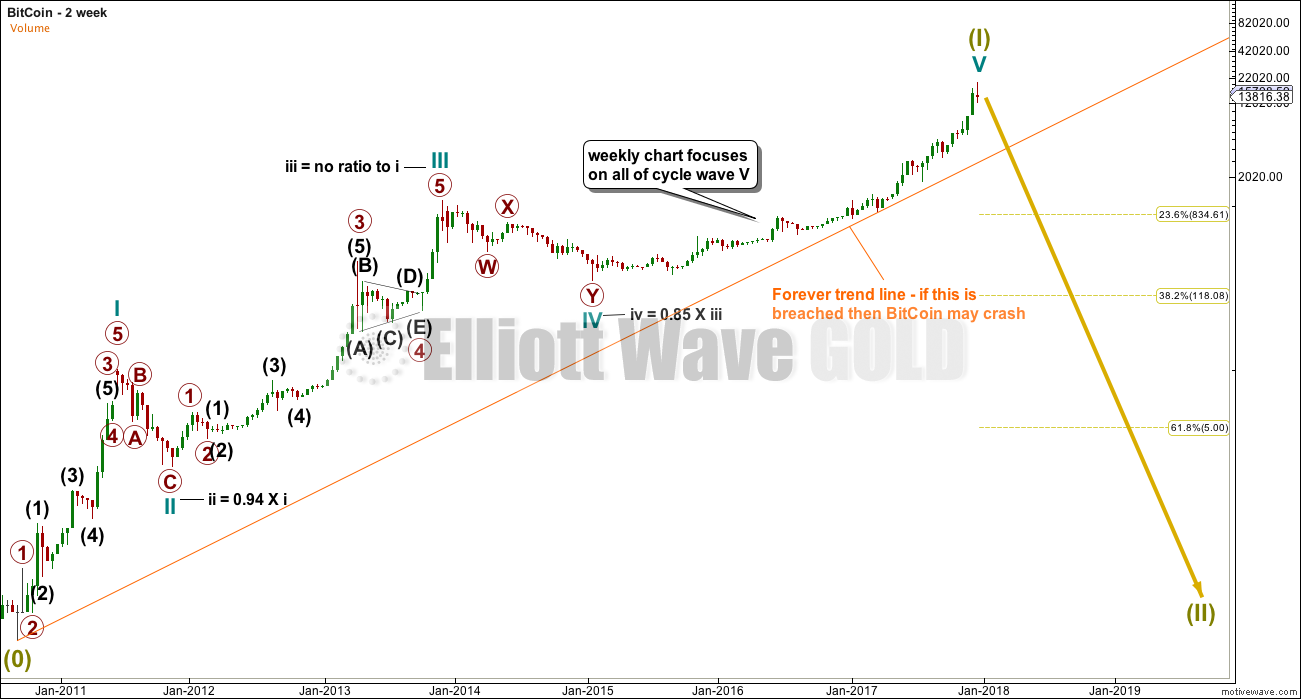
Click chart to enlarge.
WEEKLY
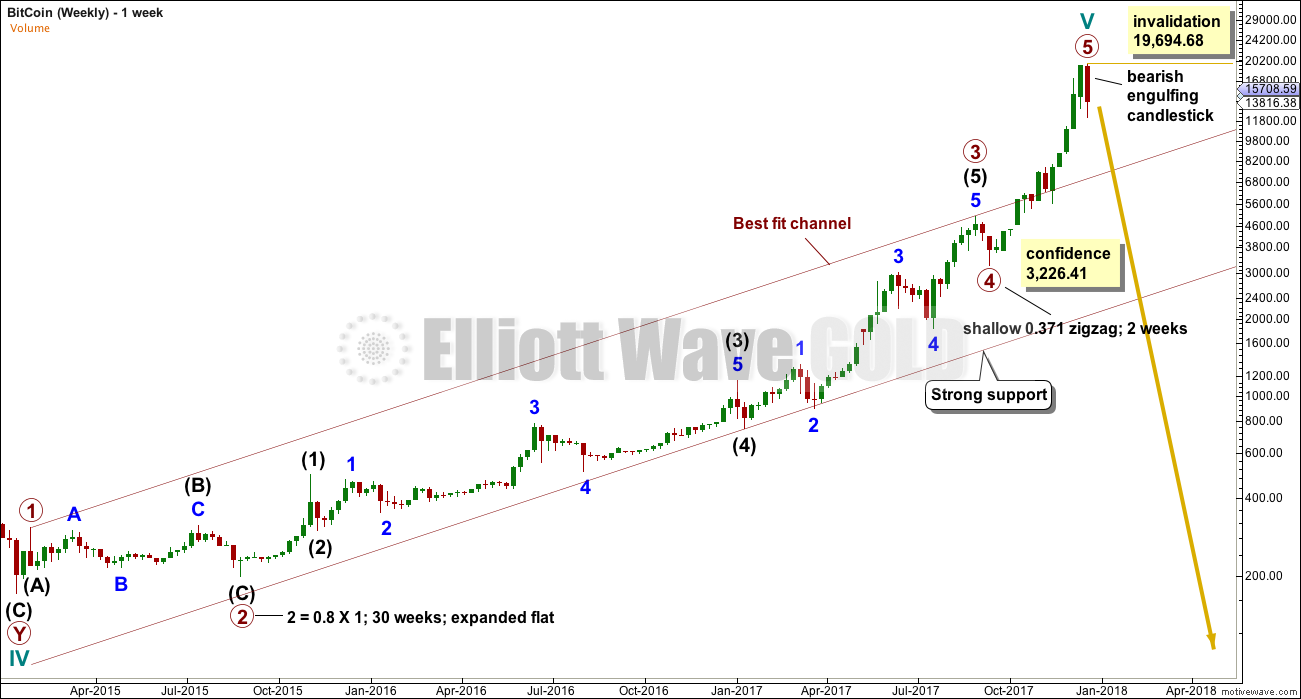
Click chart to enlarge.
DAILY
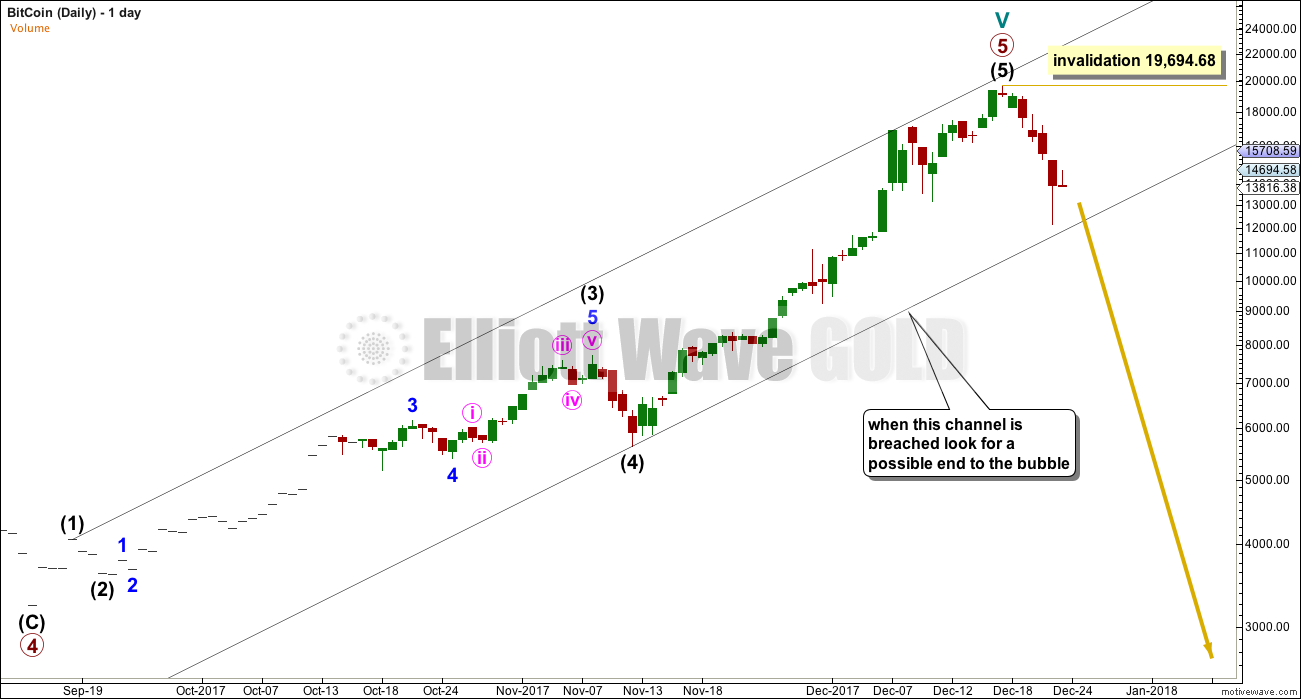
Click chart to enlarge.
VOLUME ANALYSIS
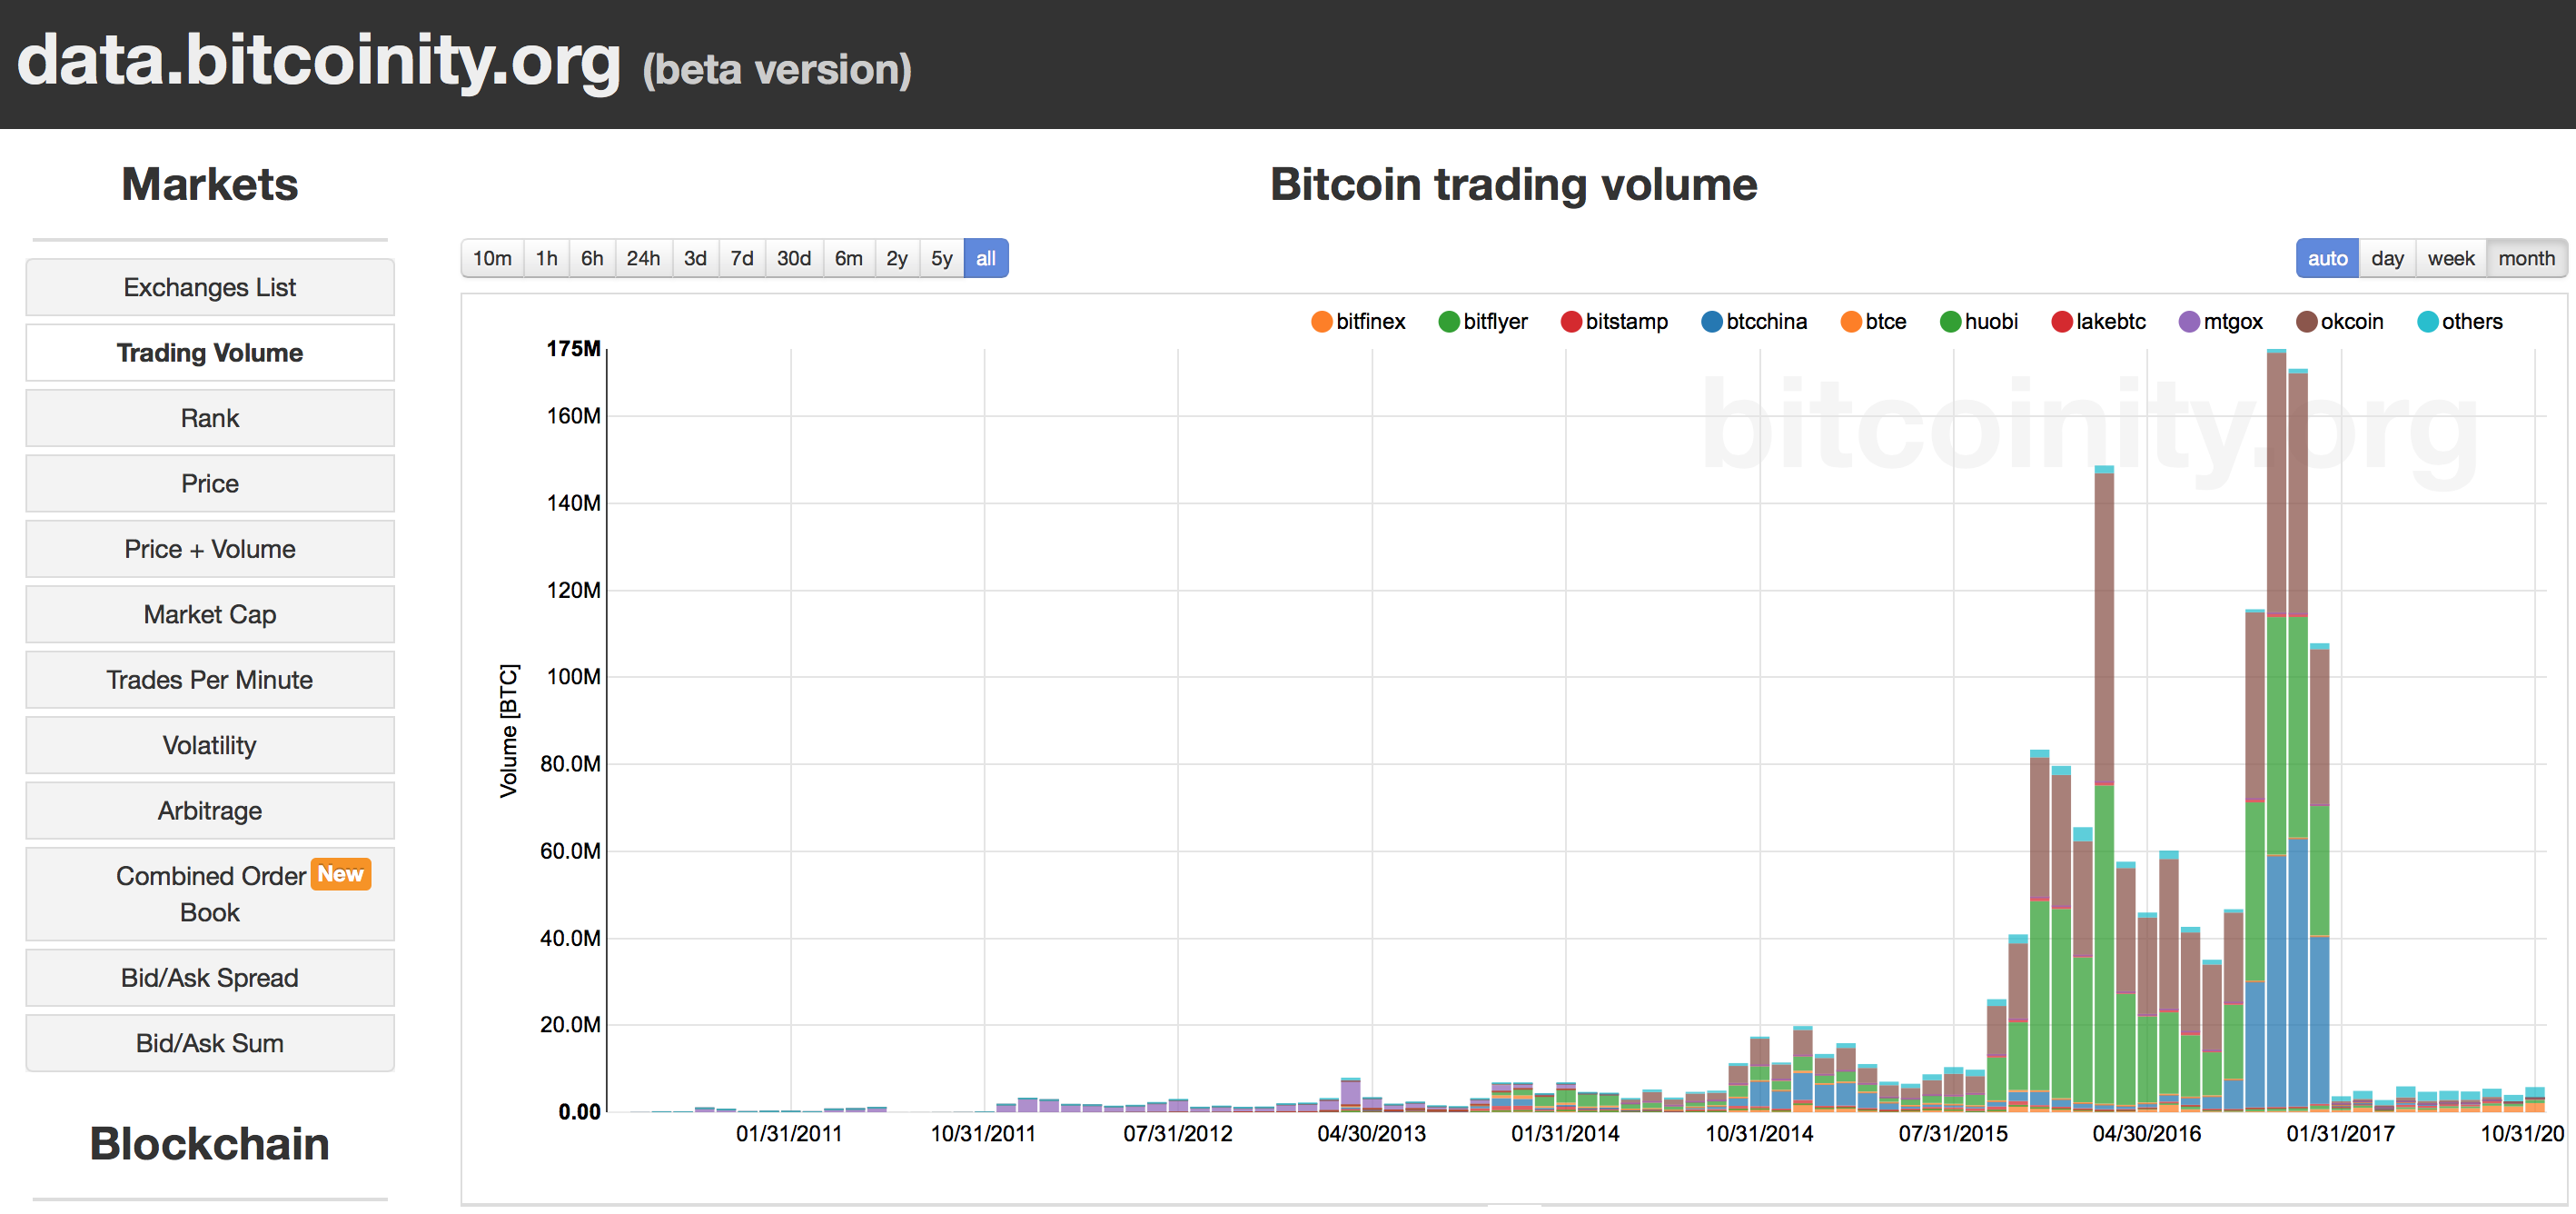
Click chart to enlarge. Chart courtesy of Bitcoinity.org.
A huge drop in volume suggests exhaustion.
Published @ 02:22 a.m. EST.
The 1st idea, that a triangle is complete with an upward breakout looks pretty good at this point. If correct, new highs will be forthcoming.
If option 2 or 3 is in play, a big move down should start very soon
https://www.tradingview.com/x/4t51chB8/
Updated: 3 corrective patterns to watch:
Blue = triangle
Black = A-B-C
Pink/Orange = Head & Shoulders
Which one wins?
https://www.tradingview.com/x/bZl6vxtX/
If this is a standard A-B-C correction, 3 possible targets. This next week will be interesting. Could be painful for longs
https://www.tradingview.com/x/IikLPh37/
How would one short bitcoin?
With a trading account that allows you to do so. BitStamp is one that Cesar found.
Tulip Mania 1637
Will Bitcoin be next?
https://en.wikipedia.org/wiki/Tulip_mania
Sure looks likely doesn’t it!
If you draw a long held channel this way (see chart) there has been a breakout and a back-test. Does this not look bullish? Thanks.
Yes, that does look bullish
If one looks at the long term chart of a bubble “Dow to Gold ratio” caution is the word.
Once these long channels are broken the top is closer than one expect.
If one looks at the last peak and bottom they were separated by 20 year cycle. Next 20 year bottom from 2000 top is due in 2020. Which is at ratio of “1”.
Hey Papudi,
Nice chart. Looks like it ended in Feb 2017. I made an attempt to count the move from the 2011 to current. I may be wrong, but it looks like there may be one more high this year before the big move down. If correct, it suggests that the DJI shows relative strength vs. gold for a few more months. Thoughts?
https://www.tradingview.com/x/KUmIVtWO/
Yes it may touch the average 20 and then down sharply. thanks.