
Last analysis advised members to hold onto short positions which should have been entered just prior to or at the downwards breakout. Targets are given today using a classic symmetrical triangle pattern and Elliott wave counts.
Summary: The classic analysis target is about 1,228. The Elliott wave target is at 1,191. The Elliott wave target may be met in about four weeks time.
I will leave it up to members to decide on when to take profits, as each trader may have a different preferred time frame for trading. For maximum profits, positions entered prior to the breakout may possibly be held until the target is reached.
The trend for now may be down. Bounces are opportunities to enter the trend.
Always trade with stops and invest only 1-5% of equity on any one trade.
New updates to this analysis are in bold.
Last monthly charts for the main wave count are here, another monthly alternate is here, and video is here.
Grand SuperCycle analysis is here.
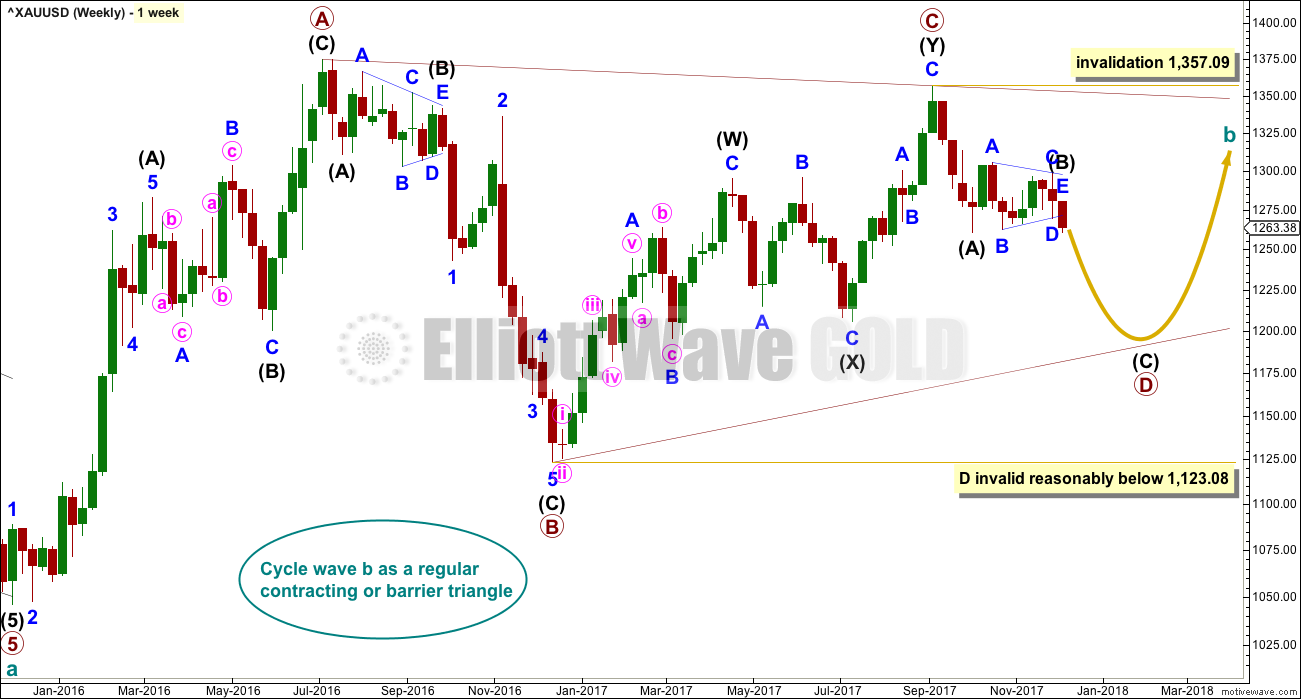
MAIN ELLIOTT WAVE COUNT
WEEKLY CHART
Click chart to enlarge.
Both wave counts expect that Gold completed a large five down from the all time high in November 2011 to the low of December 2015, which is seen on the left hand side of both weekly charts.
If this analysis is correct, then the five down may not be the completion of the correction. Corrective waves do not subdivide as fives; they subdivide as threes. The five down is seen as cycle wave a within Super Cycle wave (a).
Both wave counts then expect cycle wave b began in December 2015.
There are more than 23 possible corrective structures that B waves may take. It is important to always have multiple wave counts when B waves are expected.
It looks unlikely that cycle wave b may have been over at the high labelled primary wave A. Primary wave A lasted less than one year at only 31 weeks. Cycle waves should last one to several years and B waves tend to be more time consuming than other Elliott waves, so this movement would be too brief for cycle wave b.
This wave count looks at cycle wave b to be most likely a regular contracting triangle.
The B-D trend line should have a reasonable slope for this triangle to have the right look, because the A-C trend line does not have a strong slope. A barrier triangle has a B-D trend line that is essentially flat; if that happened here, then the triangle trend lines would not converge with a normal look and that looks unlikely.
Primary wave D should be a single zigzag. Only one triangle sub-wave may be a more complicated multiple, and here primary wave C has completed as a double zigzag; this is the most common triangle sub-wave to subdivide as a multiple.
Primary wave D of a contracting triangle may not move beyond the end of primary wave B below 1,123.08.
At its completion, primary wave D should be an obvious three wave structure at the weekly chart level.
For this one weekly chart, two daily charts are presented below. They look at intermediate wave (B) in two different ways, and are presented now in order of probability.
DAILY CHART

Click chart to enlarge.
Both daily charts are identical up to the low labelled intermediate wave (A).
This first daily chart shows intermediate wave (B) as a now complete regular contracting Elliott wave triangle. This has support from what looks like a classic downwards breakout from the symmetrical triangle identified on the technical analysis chart below.
The target assumes that intermediate wave (C) may exhibit the most common Fibonacci ratio to intermediate wave (A).
Intermediate wave (C) must subdivide as a five wave structure. Within intermediate wave (C), the second wave correction to come may not move beyond the start of the first wave above 1,287.61.
Intermediate wave (A) lasted twenty sessions. Intermediate wave (C) may be about even in duration as well as length, so twenty or twenty-one sessions looks likely.
HOURLY CHART
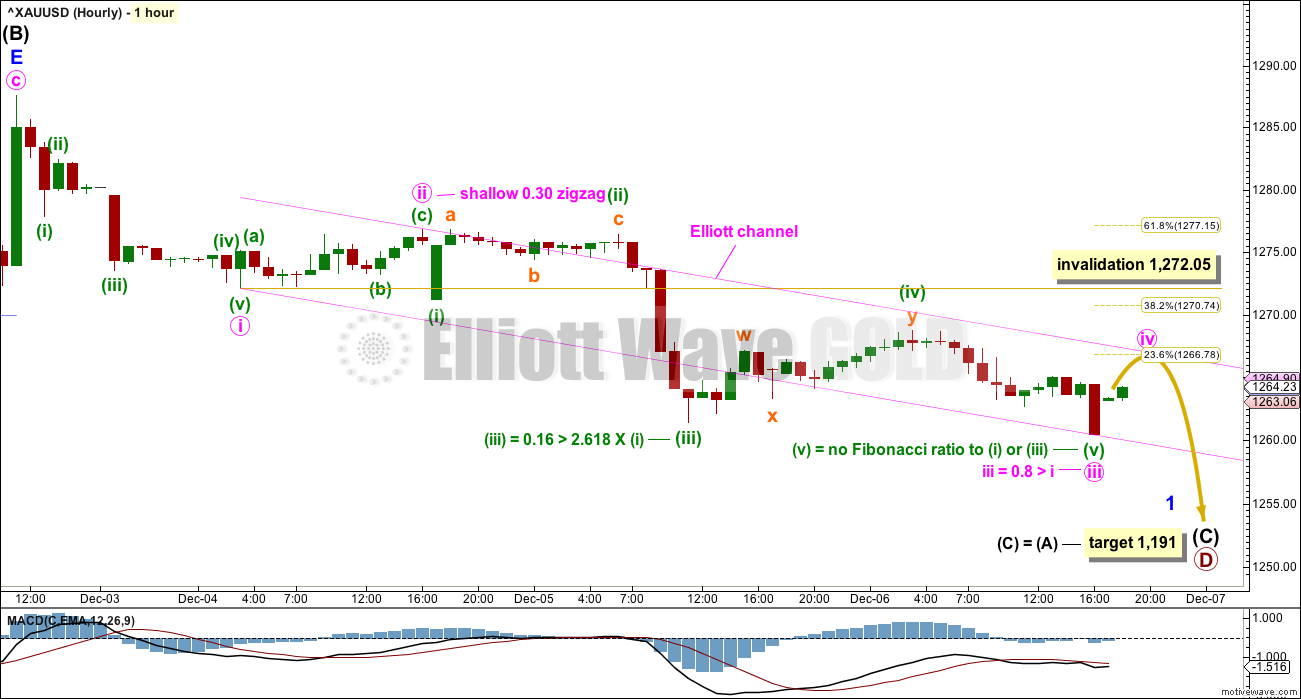
Click chart to enlarge.
If a new trend at intermediate degree is beginning, then a five down should develop at the daily chart level. That would so far be incomplete and will be labelled here minor wave 1.
Within minor wave 1, minute wave iii may now be a complete impulse that exhibits a ratio of equality with minute wave i and its middle shows an increase in momentum.
Minute wave ii was a shallow zigzag. To exhibit alternation minute wave iv may be a more shallow sideways flat, combination or triangle; it may not be deep because it may not move into minute wave i price territory above 1,272.05.
When minute wave iv is complete, then minute wave v downwards may unfold to new lows. A target for minute wave v cannot be calculated until minute wave iv is complete and the start of minute wave v is known.
The channel is drawn using Elliott’s first technique. Minute wave iv may find resistance at the upper edge. If it does not, then the channel must be redrawn using Elliott’s second technique.
Minute wave v may end about the lower edge of the channel.
SECOND DAILY CHART

Click chart to enlarge.
It is very important to always consider an alternate when a triangle may be unfolding. Triangles are very tricky structures, and may even be invalidated after one thinks they are complete.
It is still possible that intermediate wave (B) may be completing as a flat correction.
Within the flat correction, both minor waves A and B are threes. Minor wave B has retraced more than the minimum 0.9 length of minor wave A.
With minor wave B now a 1.01 length to minor wave A, a regular flat is still indicated. Minor wave C of a regular flat would most commonly be about even in length with minor wave A.
If minor wave B continues lower, then an expanded flat would be indicated once it reaches 1.05 the length of minor wave A or below. At that stage, minor wave C would then most likely be about 1.618 the length of minor wave A.
Now minor wave C may be required to move price upwards to end at least above the end of minor wave A at 1,305.72 to avoid a truncation.
A new high above 1,298.70 is required now for confidence in this wave count.
ALTERNATE ELLIOTT WAVE COUNT
WEEKLY CHART
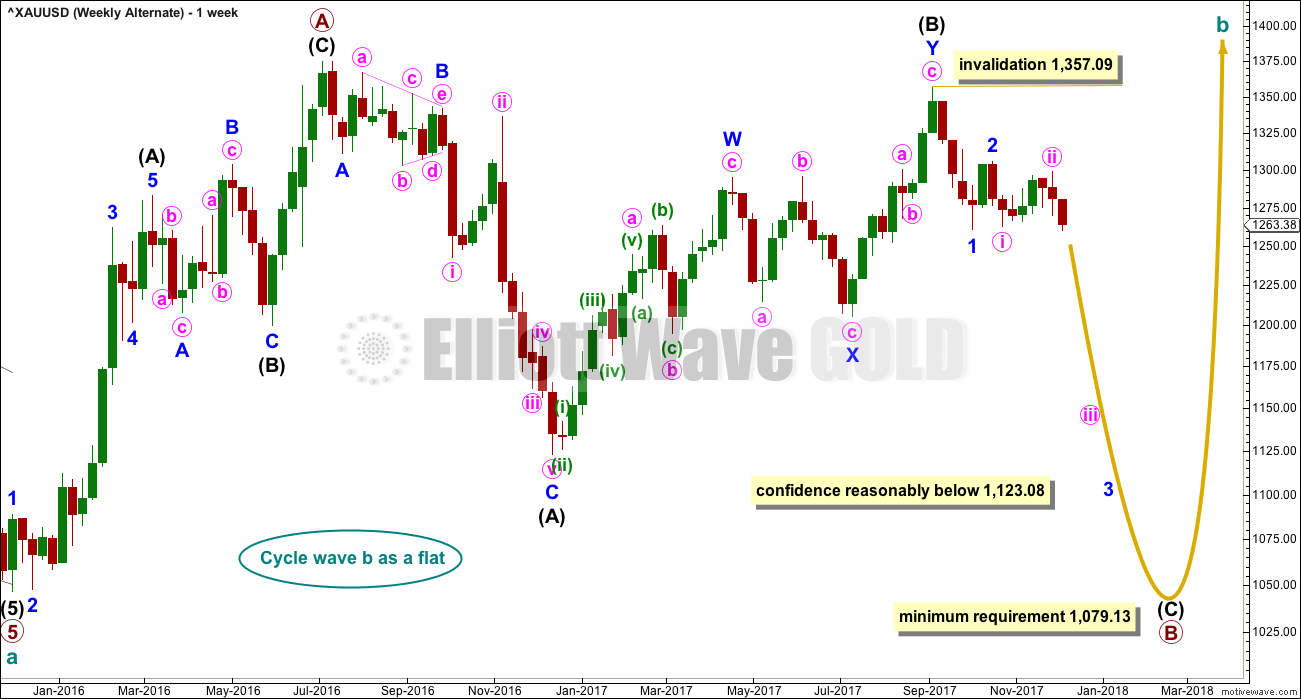
Click chart to enlarge.
Both wave counts are identical to the low labelled cycle wave a. Thereafter, they look at different possible structures for cycle wave b.
Cycle wave b may be a flat correction. Within a flat primary, wave B must retrace a minimum 0.9 length of primary wave A at 1,079.13 or below.
TECHNICAL ANALYSIS
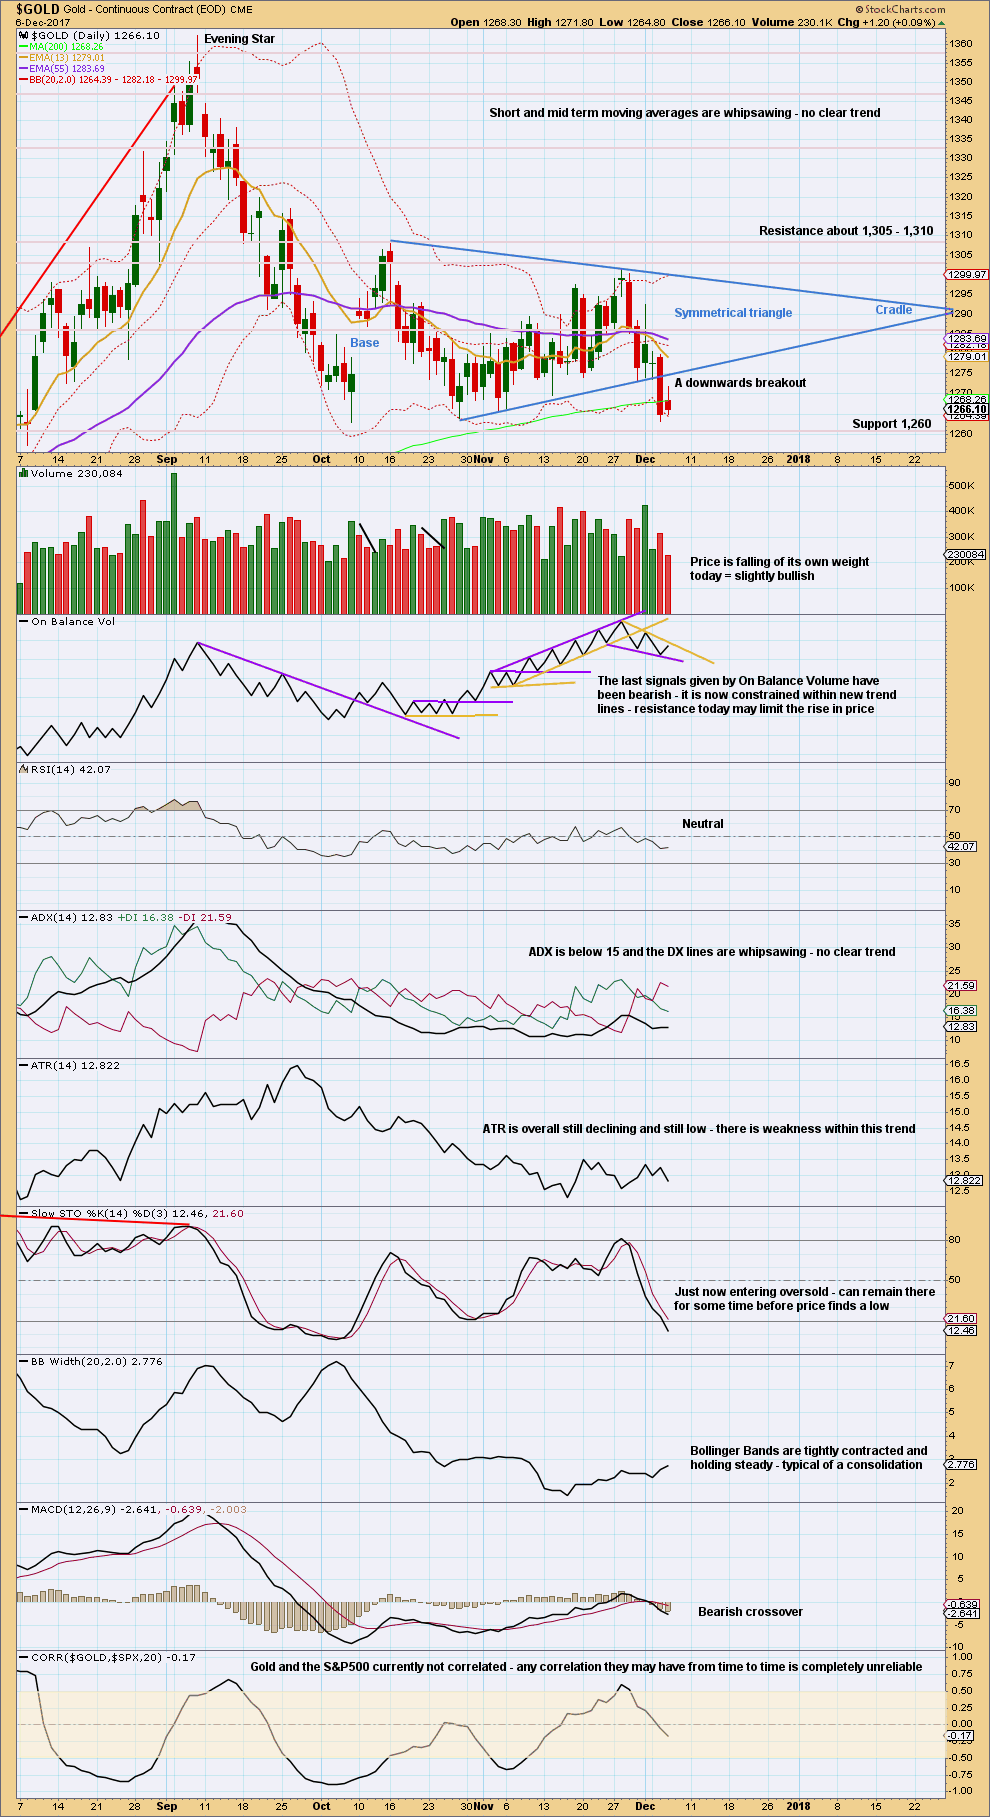
WEEKLY CHART
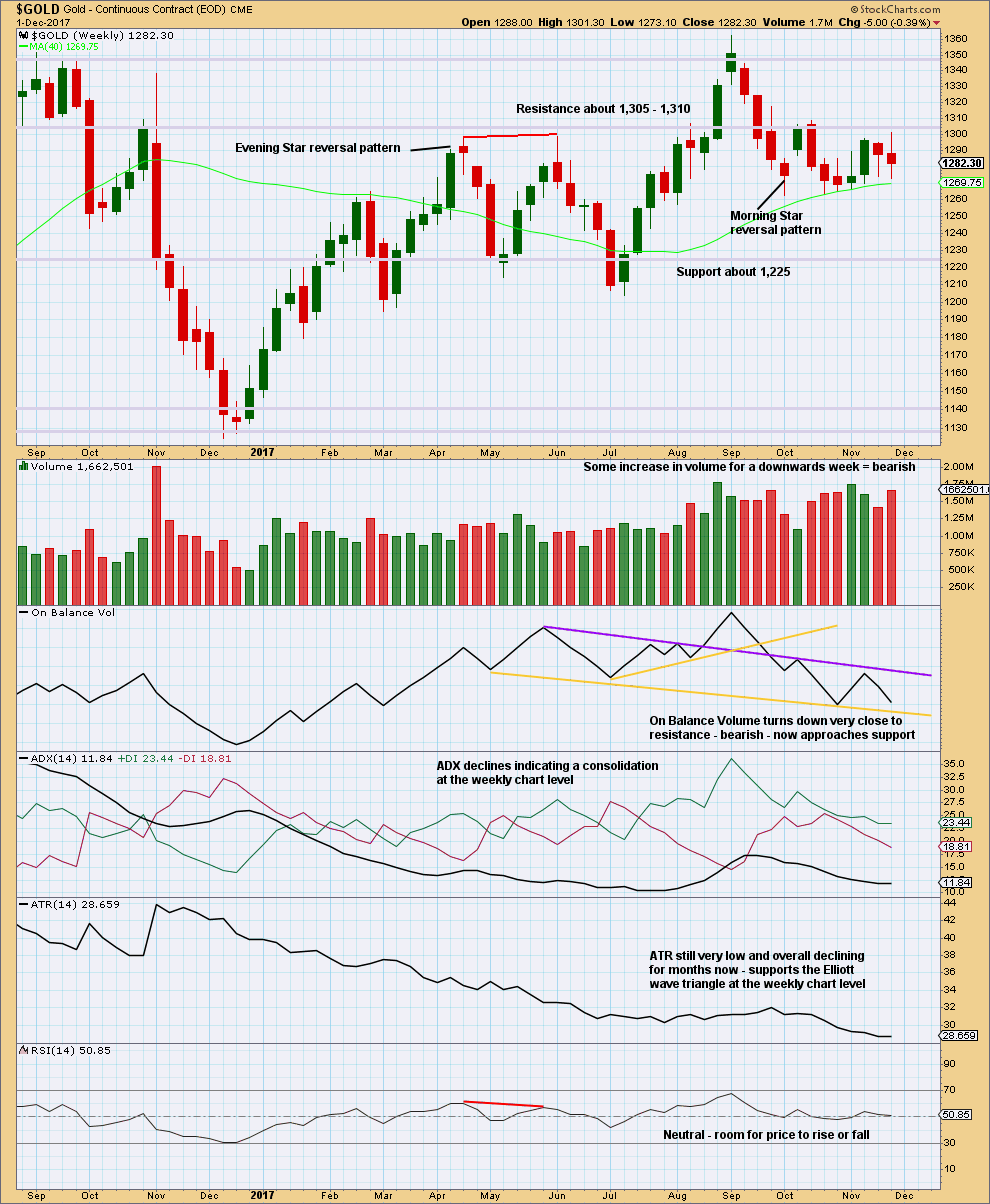
Click chart to enlarge. Chart courtesy of StockCharts.com.
On Balance Volume is still constrained. The last signal given was bearish.
DAILY CHART
Click chart to enlarge. Chart courtesy of StockCharts.com.
Downwards movement looks very much like a downwards breakout from a symmetrical triangle. Because the support line for the triangle was tested seven times prior to this breakout, that trend line has strong technical significance and a strong downwards day closing well below it is a strong bearish signal. The breakout had some support from volume. Price today fell of its own weight. While an increase in volume for falling price is good to see, decreasing volume for falling price does not necessarily mean price should turn. It can continue to fall of its own weight, particularly early on in a trend.
Regarding triangles from Kirkpatrick and Dhalquist:
“Throwbacks… occur 37%… of the time, respectively, and, as in most patterns, when they occur, they detract from eventual performance. This implies that for actual investement or trading, the initial breakout should be aced upon, and if a pullback or throwback occurs, the protective stop should be tightened. It does not imply that a pullback or throwback should be ignored, but that instead, performance expectations should be less than if no pullback or throwback had occurred.”
On trading triangles:
“The ideal situation for trading triangles is a definite breakout, a high trading range within the triangle, an upward-sloping volume trend during the formation of the triangle, and especially a gap on the breakout… An initial target for these patterns is calculated by adding the be distance – the vertical distance between the initial upper and lower reversal point prices – to the price where the breakout occurred.”
A target is calculated using this method today to be about 1,228.
Members are warned that a throwback to the lower trend line of the triangle is unlikely. The breakout should have been acted upon within the last 24 hours.
Always remember to manage risk as the most important aspect of trading. Always use a stop and invest only 1-5% of equity on any one trade.
GDX DAILY CHART
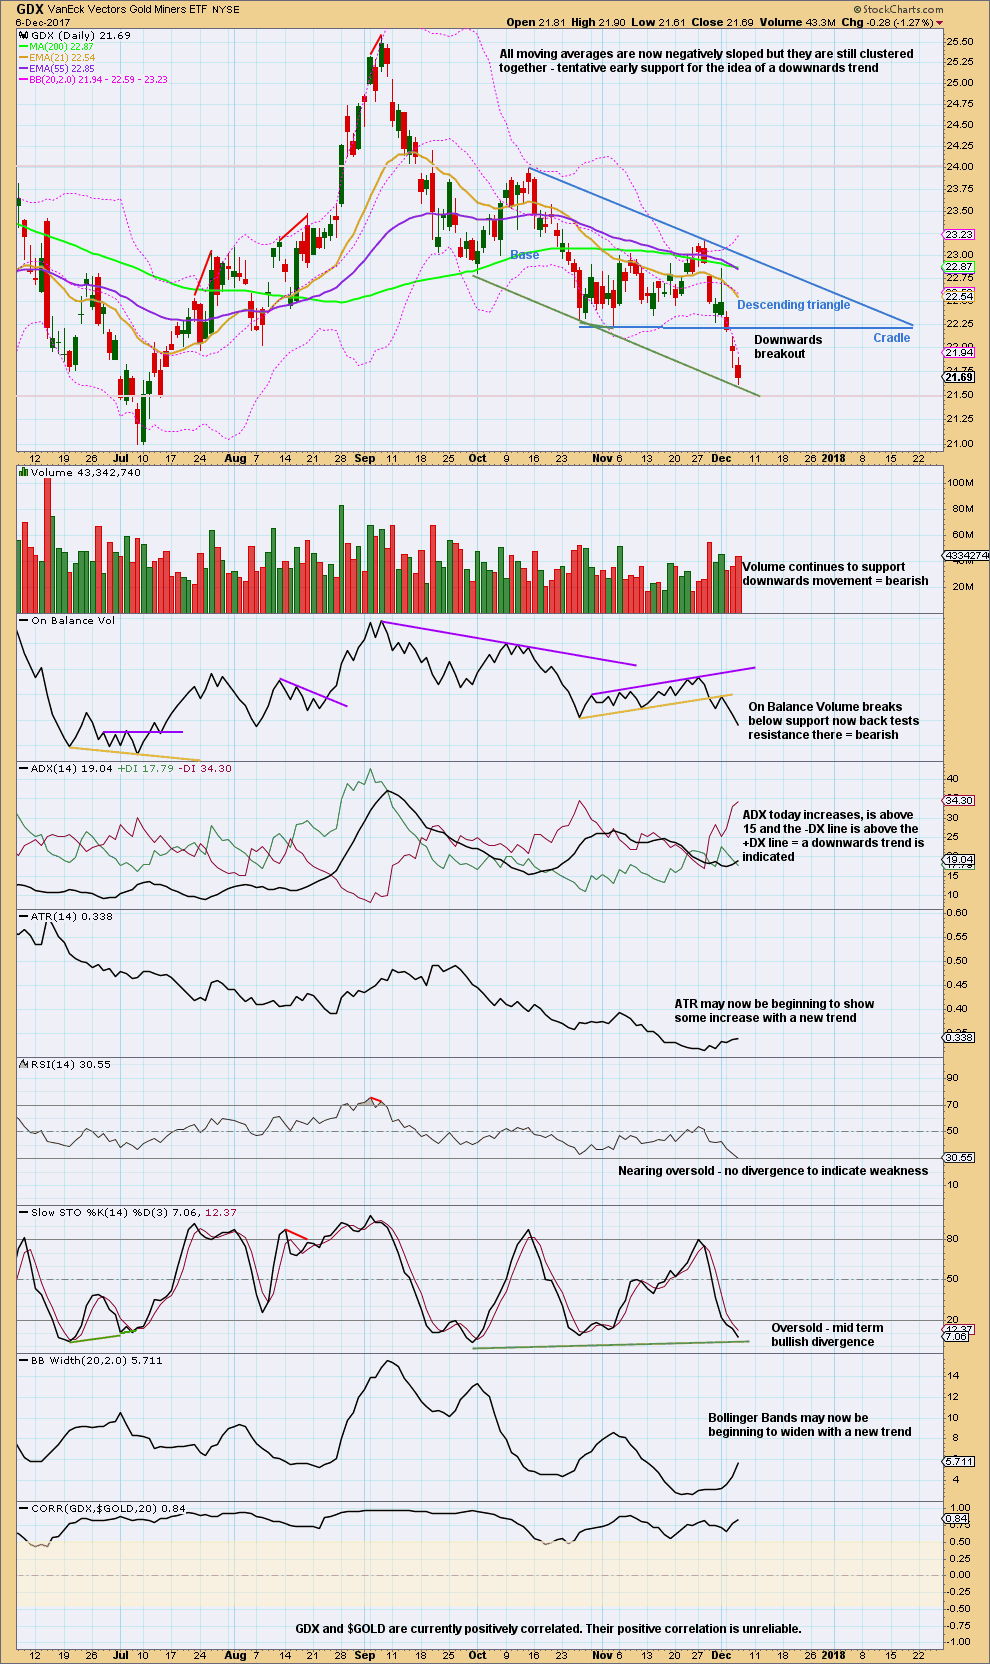
Click chart to enlarge. Chart courtesy of StockCharts.com.
A descending triangle looks to be complete now for GDX. From Kirkpatrick and Dhalquist regarding descending triangles:
“The breakout is more common to the downside (65%), but the upward breakout is more reliable and profitable… This formation can be stretched high and wide and is sometimes difficult to recognise. The trend lines defining its boundaries are almost never exact and are loaded with false intra-bar breakouts. A strict breakout strategy is required… However, prices often explode out of it and produce sizeable gains. It can also be wild and guarantee an exciting ride. It will break out and run, break out and pull back to its trend line, break out and pull back to its cradle, or break back through the cradle, create a sizeable trap, and then reverse back in its original breakout direction and run. In other words, when you enter on a breakout from a descending triangle, the subsequent action must be watched carefully.”
Yesterday looks like a downwards breakout from this triangle, with some support from volume and a small gap down. This breakout should have been acted upon if members did not already hold short positions.
A target calculated from the width of the triangle and applied to the breakout point is at 20.43.
For the short term, with again bearish volume, bearish On Balance Volume, and bearish ADX, another downwards day looks likely tomorrow.
However, price is at support and there is some bullish divergence with Stochastics. I would not give much weight to this divergence though, because it is not replicated with RSI. Divergence with Stochastics tends to be less reliable, because it may just disappear. I would give more weight here to On Balance Volume.
Published @ 07:18 p.m. EST.
[Note: Analysis is public today for promotional purposes. Specific trading advice and comments will remain private for members only.]
Second update with a target for minute iii. It’s passed 1.618 X minute i, so the next Fibonacci ratio in the sequence is used for the target.
The channel should be redrawn as price keeps moving lower. The first trend line from the end of minute i to the last low, then a parallel copy higher up to contain all this movement.
This channel may be used in two ways: first, while minor 1 is incomplete bounces should find resistance at the upper edge of the channel. Second, when the channel is breached by upwards movement that shall be an early indication that minor 1 should be over and minor 2 should then be underway.
Good morning. So, who here has taken the trading advice given and is holding a very profitable short position today? How are you all going?
Hold on folks. The structure is incomplete. If you have a position opened prior to the breakout day of 5th December you may now be able to hold it until the target is reached, or the structure is complete, whichever comes first. I’ll also use a trend line for resistance and if that’s broken exit short positions. It’s a little too early now to draw that line.
Any members not yet short, now is still early on in the trend. Bounces are an opportunity to join the trend.
The breakout should have been acted upon.
I’ve changed the labelling of minute iii to see it continuing lower with an extended fifth wave. This is very common for Gold’s impulses, particularly it’s third waves.
Thanks Lara. Have been short since that sharp move up failed last week. I’m taking profits today myself, although rolling some over for next week. Tomorrow might in fact see a bounce (bottom?) with NFP, or might trigger a waterfall. Hard to say, but i don’t want to leave all of the profits on the table with what may happen tomorrow and with price pretty far under the daily BB.
Nice problem to have though 🙂
That’s awesome Eli. Thanks for the feedback. Yes, a nice problem to have.
Yep! Yep! Yep! That move out of the triangle was a no brainer…T’was the night before Christmas! 🙂
🙂 that symmetrical triangle was just so perfect wasn’t it! and with that trend line tested 7 times prior to the breakout…. it was such a high confidence set up.
An absolute beaut!
Gold Futures keeps falling below 200sma.
Even though the Bullish Barrier triangle count that I have been following has not been fully invalidated with a new low below 20.99, I’m afraid the price action is too bearish and an invalidation is imminent in the coming days. Time to be bearish as Lara has been saying.
Yes, that is a very interesting bearish signal there from On Balance Volume. And you know how much weight I place in that 🙂
Not too late Dreamer to join the trend 🙂