
Price continues to move slowly lower as the main wave count expects it to.
Summary: The main wave count expects a trend change to a new bear market to last one to several years, and the target is 470. A new low below 1,324.93 now offers further confidence in this view.
Full confidence may be had in the target if price can make a new low below 1,236.54 in the next few weeks.
An alternate expects overall upwards movement from here. It would be confirmed if price makes a new high reasonably above 1,357.09.
New updates to this analysis are in bold.
Last historic analysis with monthly charts is here. Video is here.
Another alternate monthly chart is here.
Grand SuperCycle analysis is here.
MAIN ELLIOTT WAVE COUNT
WEEKLY CHART
Click chart to enlarge.
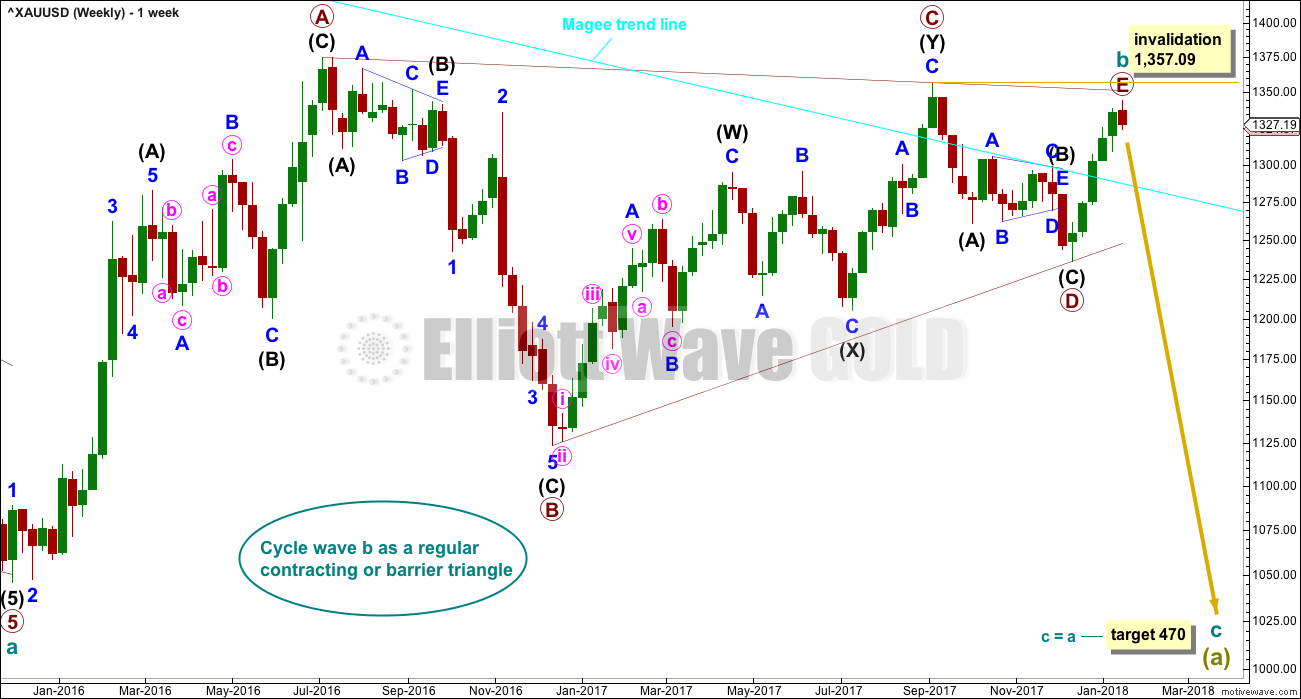
All main wave counts expect that Gold completed a large five down from the all time high in November 2011 to the low of December 2015, which is seen on the left hand side of weekly charts.
If this analysis is correct, then the five down may not be the completion of the correction. Corrective waves do not subdivide as fives; they subdivide as threes. The five down is seen as cycle wave a within Super Cycle wave (a).
Cycle wave b began in December 2015.
It looks unlikely that cycle wave b may have been over at the high labelled primary wave A. Primary wave A lasted less than one year at only 31 weeks. Cycle waves should last one to several years and B waves tend to be more time consuming than other Elliott waves, so this movement would be too brief for cycle wave b.
This wave count looks at cycle wave b to be most likely a regular contracting triangle.
All sub-waves must subdivide as threes within an Elliott wave triangle, and four of the five sub-waves must be zigzags or multiple zigzags, and the most common sub-wave to be a multiple is wave C. Only one sub-wave may be a more complicated multiple. This triangle meets all these rules and guidelines; all subdivisions fit perfectly at all time frames. It is the main wave count for these reasons, and thus is judged to have the highest probability.
The triangle trend lines have a normal looking convergence. Primary wave D now looks fairly likely to be complete, and it looks like an obvious three wave structure at the weekly chart level.
While primary wave E should also most likely look like an obvious three wave structure at the weekly and daily chart levels, it does not have to do this. It is possible that primary wave E could be over, falling reasonably short of the A-C trend line and being relatively quick. E waves of triangles can often be the quickest of all triangle waves.
DAILY CHART
Click chart to enlarge.
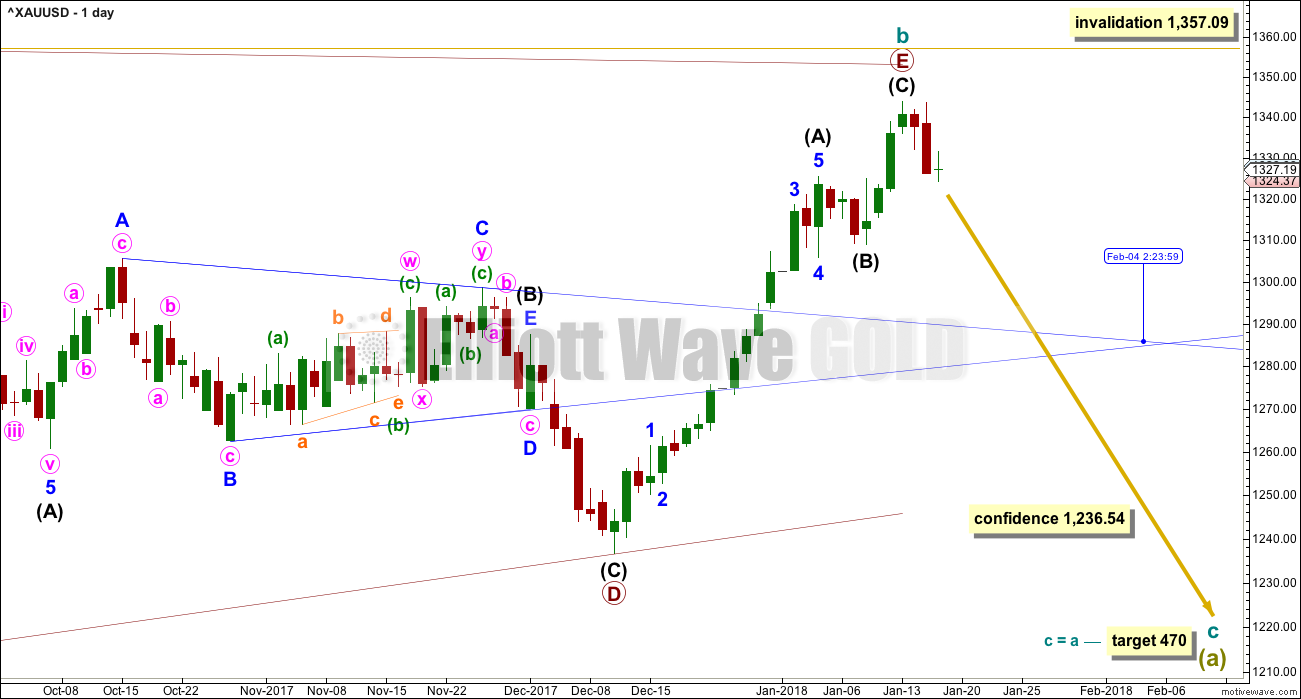
This first wave count follows on directly from the weekly chart above. It looks at primary wave E as a single zigzag. Zigzags subdivide 5-3-5.
It is possible that the zigzag for primary wave E may be complete. It looks like a zigzag at the daily chart level. E waves of triangles can be surprisingly quick. A very good example of this is here on this daily chart: the triangle labelled intermediate wave (B) within primary wave D also came to a quicker than expected end.
The target calculated for cycle wave c assumes the most common Fibonacci ratio to cycle wave a.
If primary wave E continues higher, it may not move beyond the end of primary wave C above 1,357.09. A new high by any amount at any time frame would immediately invalidate this wave count.
A new low below 1,236.54 would invalidate weekly alternate wave counts and provide a high level of confidence in this main wave count.
HOURLY CHART
Click chart to enlarge.
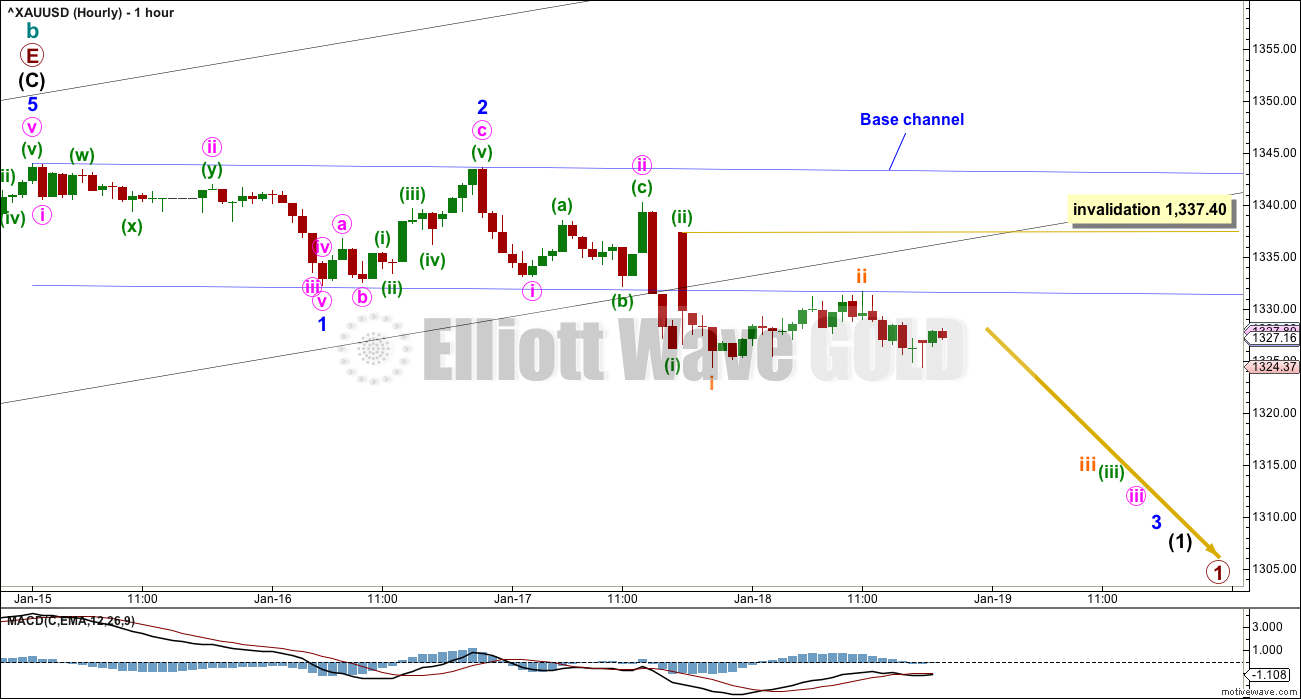
A base channel is added to minor waves 1 and 2. Downwards movement has breached the lower edge of the channel, which is now providing resistance.
This wave count still expects to see an increase in downwards momentum as a third wave down at four degrees unfolds.
If subminuette wave ii moves any higher, it may not move beyond the start of subminuette wave i above 1,337.40.
The alternate hourly wave count is invalidated. This adds a little more confidence to this main wave count.
SECOND WAVE COUNT
WEEKLY CHART
Click chart to enlarge.
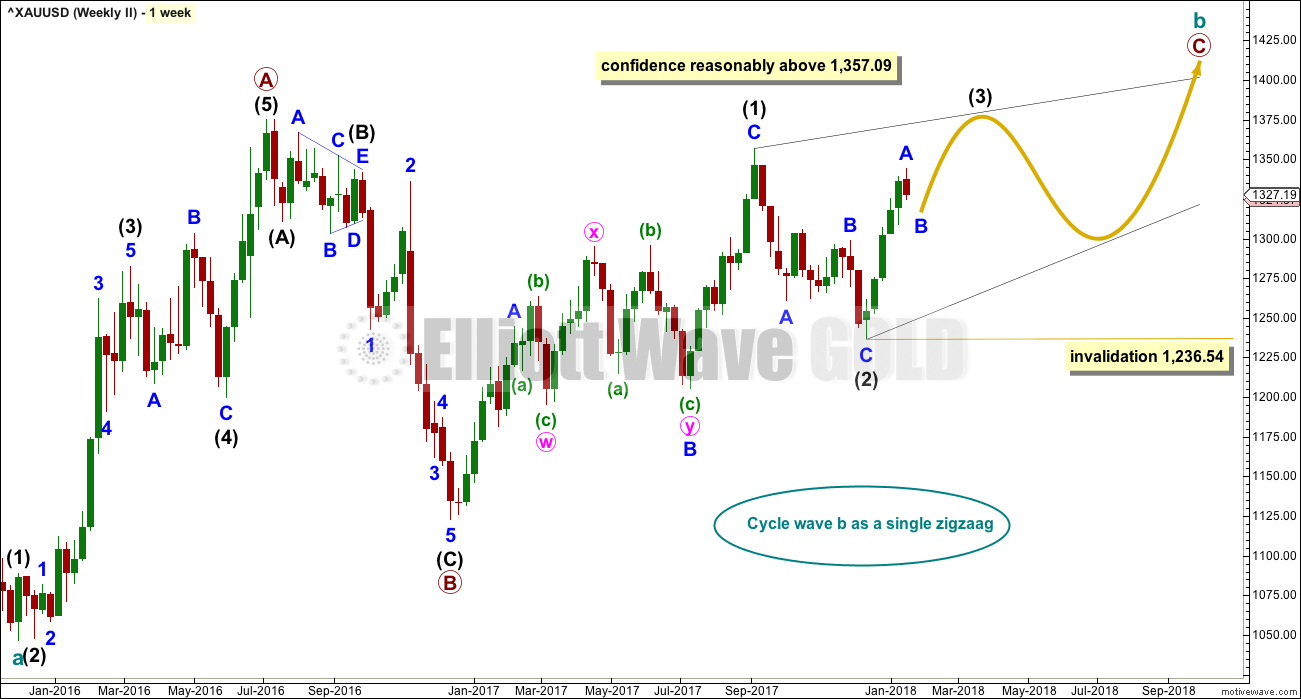
If cycle wave b is a single zigzag, then the upwards wave labelled here primary wave A must be seen as a five wave structure. But this is problematic because (within primary wave A) intermediate wave (4) lasted 12 weeks whereas intermediate wave (2) only lasted 2 weeks. While disproportion between corrective waves does not violate any Elliott wave rules, it does give a wave count the wrong look.
Gold is typical of commodities in that it often exhibits swift strong fifth waves, leading to blowoff tops in bull markets and selling climaxes in bear markets. This tendency is most often seen in Gold’s third waves. When this happens the strong fifth wave forces the fourth wave correction that comes before it to be more brief and shallow than good proportion to its counterpart second wave would suggest. When this happens the impulse has a curved three wave look to it at higher time frames.
It is acceptable for a wave count for a commodity to see a curved impulse which has a more time consuming second wave correction within it than the fourth wave correction.
The impulse has a more time consuming fourth wave than the second in this case though, giving the wave the look of a zigzag. This is unusual, and so the probability of this wave count is low.
Low probability does not mean no probability, so this wave count is possible; when low probability outcomes do occur, they are never what was expected as most likely.
Primary wave C must subdivide as a five wave structure, either an impulse or an ending diagonal. Because the upwards wave of intermediate wave (1) fits as a zigzag and will not fit as an impulse, an ending diagonal is considered.
Ending diagonals require all sub-waves to subdivide as zigzags.
Within intermediate wave (1), to see this wave as a zigzag, minor wave B is seen as a double flat correction. In my experience double flats are extremely rare structures, even rarer than running flats. The rarity of this structure further reduces the probability of this wave count.
Intermediate wave (3) must move beyond the end of intermediate wave (1) above 1,357.09.
Intermediate wave (3) must subdivide as a zigzag. Within the zigzag, minor wave B may not move beyond the start of minor wave A below 1,236.54.
THIRD WAVE COUNT
WEEKLY CHART
Click chart to enlarge.
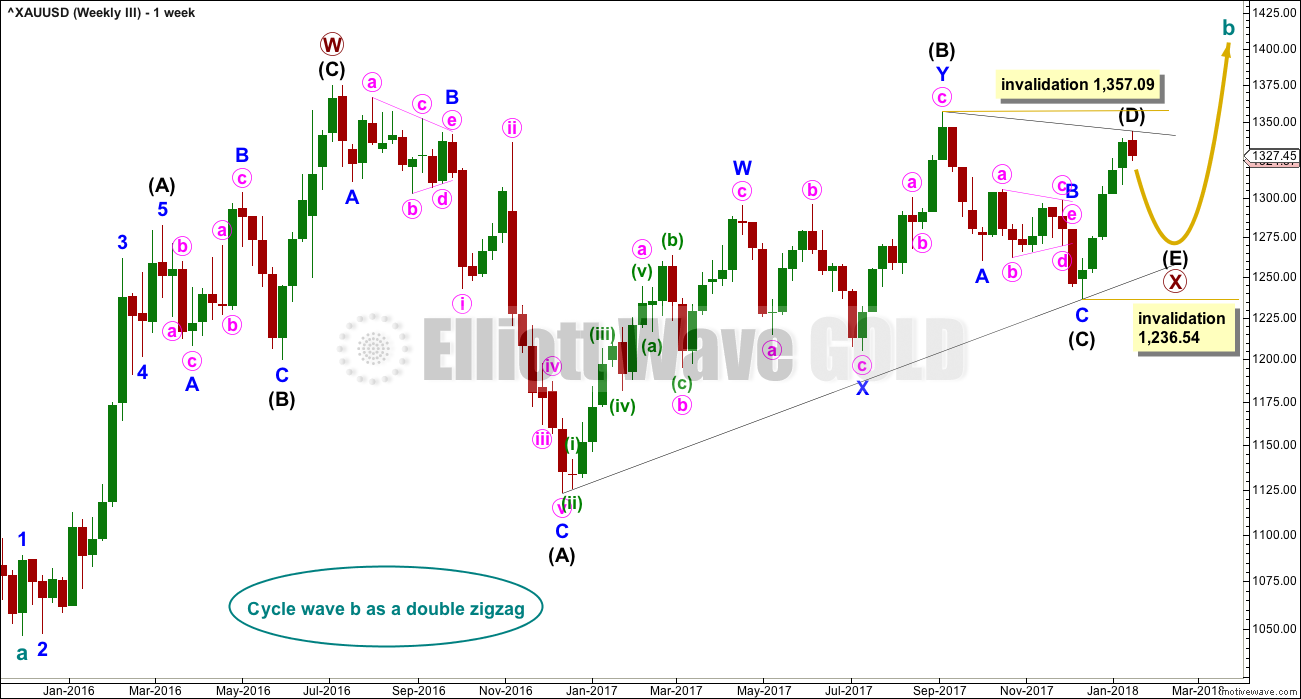
Cycle wave a is still seen as a completed five wave structure. This third wave count looks at cycle wave b as a possible double zigzag.
A triangle may be completing as an X wave within a double zigzag for cycle wave b.
Now the upwards wave labelled here primary wave W is seen as a zigzag. This has a better fit than the first alternate.
Within the triangle for primary wave X, intermediate waves (A) through to (C) may be complete. Intermediate wave (D) may also be complete, but there is room for it to still move higher. If the triangle for primary wave X is a regular contracting triangle, then intermediate wave (D) may not move beyond the end of intermediate wave (B) above 1,357.09. If the triangle is a barrier triangle, then intermediate wave (D) should end about the same level as intermediate wave (B), so that the (B)-(D) trend line remains essentially flat. In practice, this means that intermediate wave (D) may end slightly above 1,357.09 and this wave count would remain valid.
This is why a new high reasonably above 1,357.09 only would invalidate this wave count. This invalidation point is not black and white.
The final sub-wave of intermediate wave (E) may have now begun. Intermediate wave (E) may not move beyond the end of intermediate wave (C) below 1,236.54. This invalidation point is black and white. A new low by any amount at any time frame would invalidate this wave count.
TECHNICAL ANALYSIS
WEEKLY CHART

Click chart to enlarge. Chart courtesy of StockCharts.com.
Now that price has again broken above resistance at 1,305 to 1,310, that area may now provide support. Next resistance is about 1,345.
Stochastics is added this week. Price is range bound in a weekly level consolidation. As price swings from resistance to support and back again, Stochastics may be used to assist to see where each swing may end and the next begin. Price is nearing resistance at 1,345 and Stochastics is just entering overbought. It looks reasonable to expect the upwards swing to end soon; there is a little room for price to rise still.
DAILY CHART
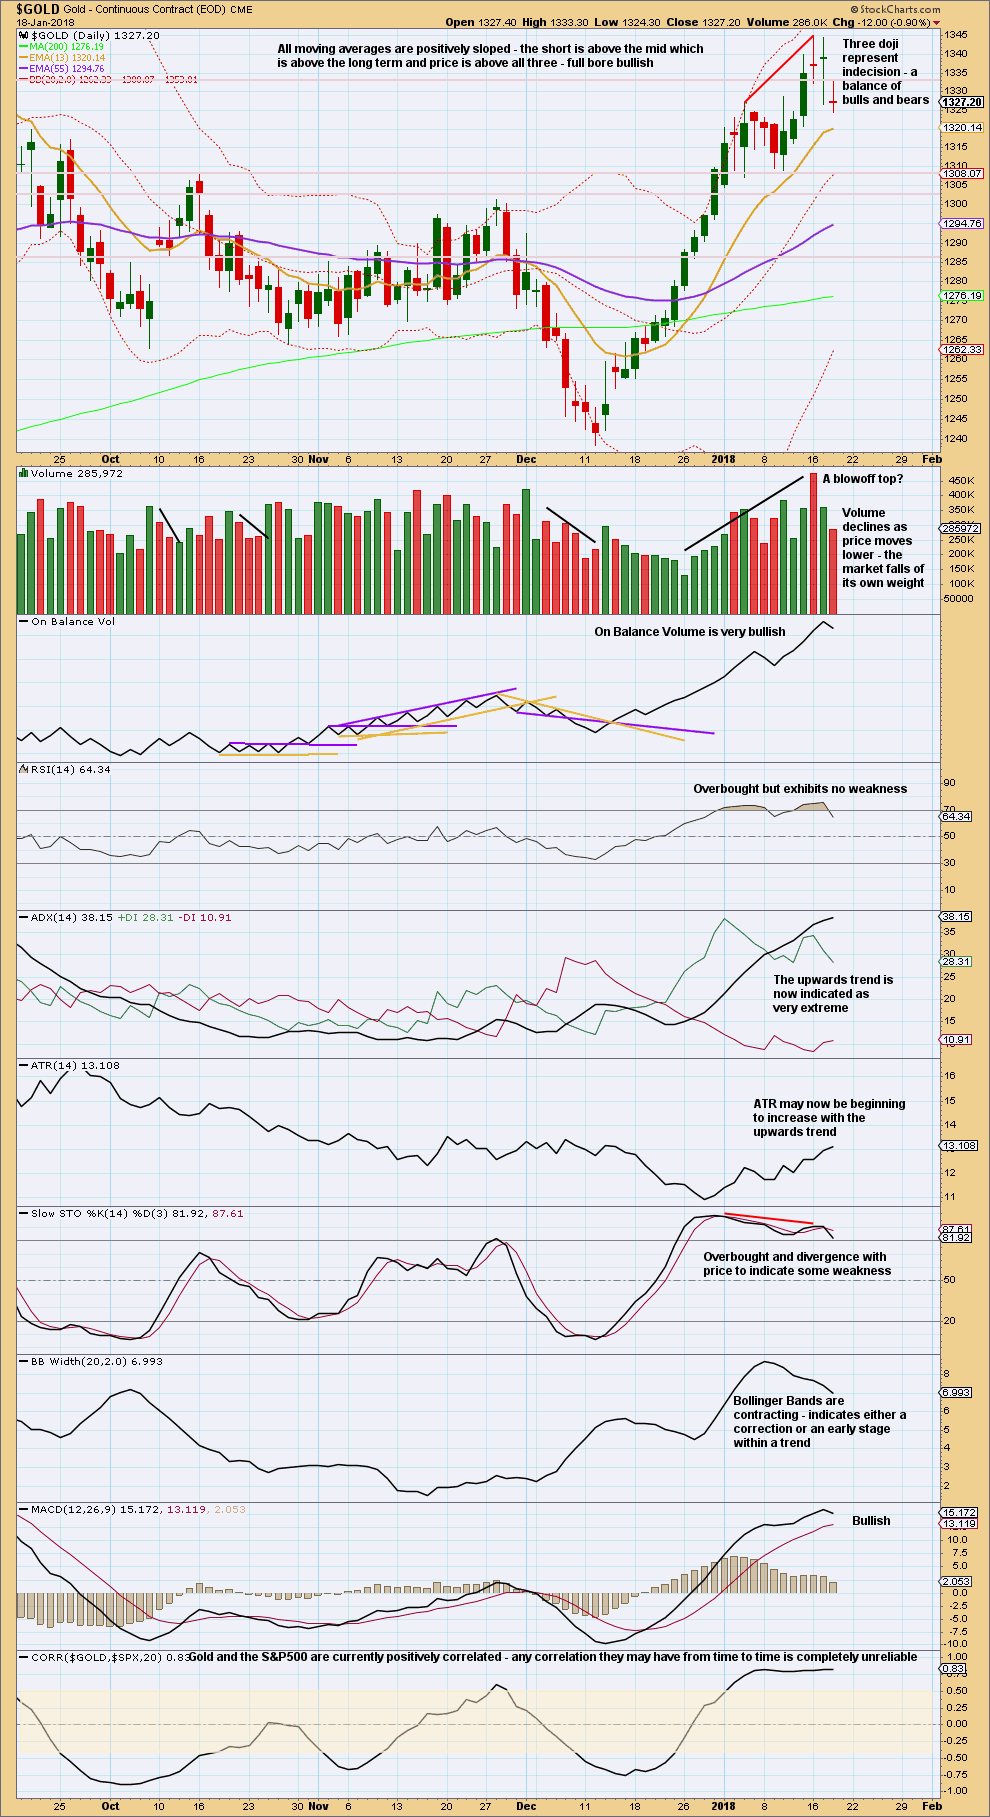
Click chart to enlarge. Chart courtesy of StockCharts.com.
The doji and light volume for this session are a concern for the bearish wave counts. At this stage, it looks like a correction within an ongoing upwards trend.
There is strong support below about 1,310 – 1,305.
The upwards trend is stretched and very extreme, but it could still continue for longer.
GDX DAILY CHART
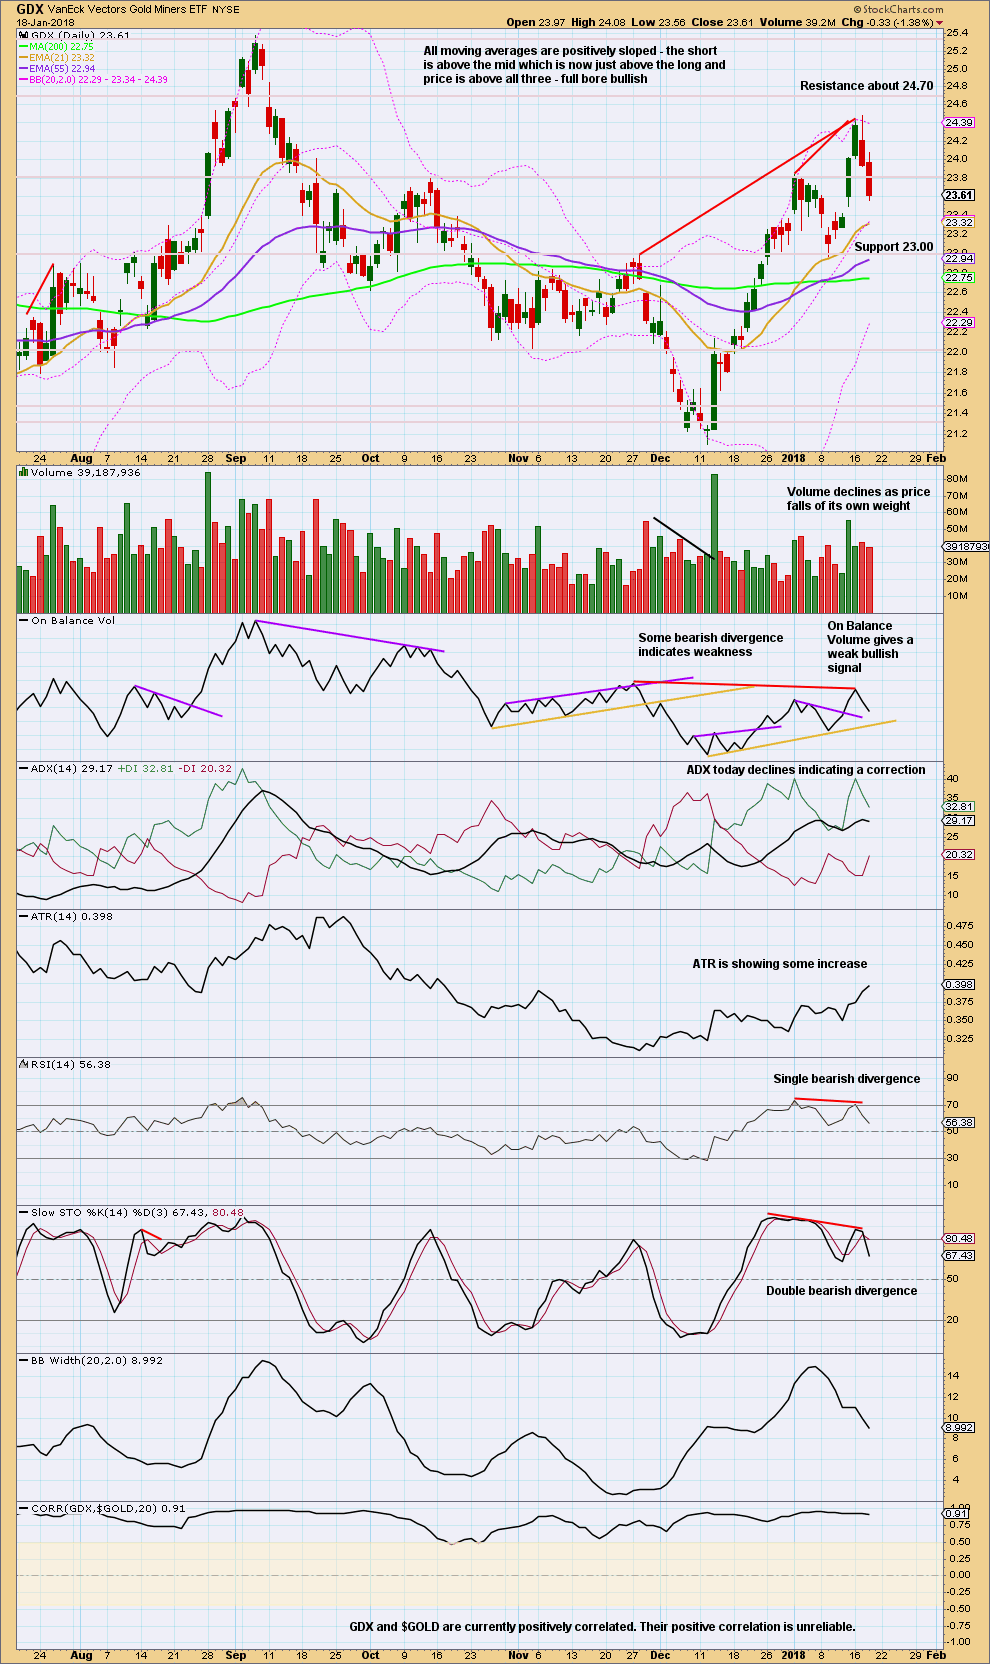
Click chart to enlarge. Chart courtesy of StockCharts.com.
It looks like price may have turned for GDX. Look for price to move lower to support while Stochastics moves lower towards oversold.
Published @ 08:28 p.m. EST.
I think Alan’s right, an expanded flat has continued a second wave correction.
I tried a diagonal and it doesn’t meet all EW rules.
And so an impulse is still indicated. Minuette (ii) may not move beyond the start of minuette (i).
Main count invalidated. Guess we could be looking at weekly alternative
Invalidation of the hourly doesn’t invalidate the main count. Lara will just rework the hourly. 😀
Good Point – let’s hope I’m still on rights side i.e. I am bearish at the moment.
… bullish here as long as 1327-24 continues to hold with Gold price presently coasting above 1332; expected target a take out of 1341-44…. lets see what happens. Have a great weekend all 🙂
No. Only minuette 2 rose higher as an expanded flat. Stopped at 1337.47.
I really doubt if cryptocurrencies can make it into mainstream everyday life. There are too many of them. Until such time when they can be whittled down to a manageable number would there be commercial use for it. You see, payment counters are already choked with credit card readers, debit card readers and a whole host of mobile payment options. Currently, transactions in cryptocurrencies are a joke — ridiculously long transaction times, extreme volatility, and the fact that there is actually very low volume, easy to buy but extremely difficult to sell. The fractional use of BitCoin doesn’t help either (I don’t know what is the limit to the number of decimal places they can come up with).
Cryptocurrencies are really useful only in speculation; volatility sees to that. They are never meant as investment vehicles — they have no intrinsic value, much worse than the barbaric relic we call “gold” which at least find wide industrial use. They are just a blip on the computer. Also, they are extremely difficult to sell off. The recent crash of BitCoin was testimony to that; many people panicked and wanted to offload, but there were no ready buyers. Exchanges are not obligated to buy back BitCoin.
Bitcoin is the most classic example of a bubble anywhere in time or space. More classic even than the Tulip Mania.
I’m simply seeing it as an opportunity to short.
But the problem there is getting the trade to be honoured when I want to exit. I give it 50:50
Just can’t wait for the big down move to start. I used to think $700 was low, heck $430 is even better. I am sure at those incredible prices, Central banks in China, Russia, India etc would be adding to their gold reserves like crazy.
As soon as it reaches the vicinity of $500, I might become a buyer of physical gold – opportunity of a lifetime. Or, on second thoughts, would everybody start shunning gold at those levels in favor of more stable cyptocurrencies ?
Do you really think gold goes down to $500?? May be in EW analysis.
Between 2009 and today China and India have bot gold at much higher prices from $1200 to $1300. Would they let gold go below these price???
Besides Central Bankers are not bottom feeders/traders. They control the price.
http://www.thehindu.com/business/RBI-buys-200-tonnes-of-gold-worth-6.7-b-from-IMF/article16890119.ece
I agree with you Papudi. I would be super surprise if I gold could ever fall below $1100 and stay below that price for more than half yr….IMHO.
That sounds similar to some comments I received about US Oil when it was up around $110.
Conditions change. Regimes change.
And I do not think any government anywhere can control a market. The CCP couldn’t halt the crash of their stock market, and they’re as close to a God of Markets as any government anywhere can be.
That crash was a beautiful example of government and central bank intervention being very large and heavy handed, yet utterly failing.
The core tenet of EW theory states it is social mood not politics nor governments nor central banks that move markets.
The Gold market is absolutely huge, it’s global. It would dwarf any government or central bank anywhere. Even if they colluded to try and control this market it is too large IMO.
I don’t have a crystal ball either. I would sell my house to buy gold if it falls below $900 for very sure. lol
Yep. It certainly does not take into account the amazing power of a deflationary cycle, which is dead ahead….
Papudi, IMO the probability of gold going to sub-$1000 range is slim. However, anything is possible. For that reason, we need to have bullish as well as bearish counts ready and let Mr.Market lead us.
Regarding cryptocurrencies replacing gold either as currency or as store of value, not probable in the current state of its evolution. The two drawbacks, IMO, anonymity (black money, parallel economy) and hack/theft of wallet.