
Downwards and sideways movement to end the week fits the main wave count. But while price action so far looks right, this main wave count does not have support from classic analysis at the end of this week. Two alternates are considered.
Summary: The main wave count expects a trend change to a new bear market to last one to several years, and the target is 470. A new low below 1,324.93 now offers further confidence in this view.
Full confidence may be had in the new bear market if price can make a new low below 1,236.54 in the next few weeks.
An alternate expects overall upwards movement from here. It would be confirmed if price makes a new high reasonably above 1,357.09.
New updates to this analysis are in bold.
Last historic analysis with monthly charts is here. Video is here.
Another alternate monthly chart is here.
Grand SuperCycle analysis is here.
MAIN ELLIOTT WAVE COUNT
WEEKLY CHART
Click chart to enlarge.
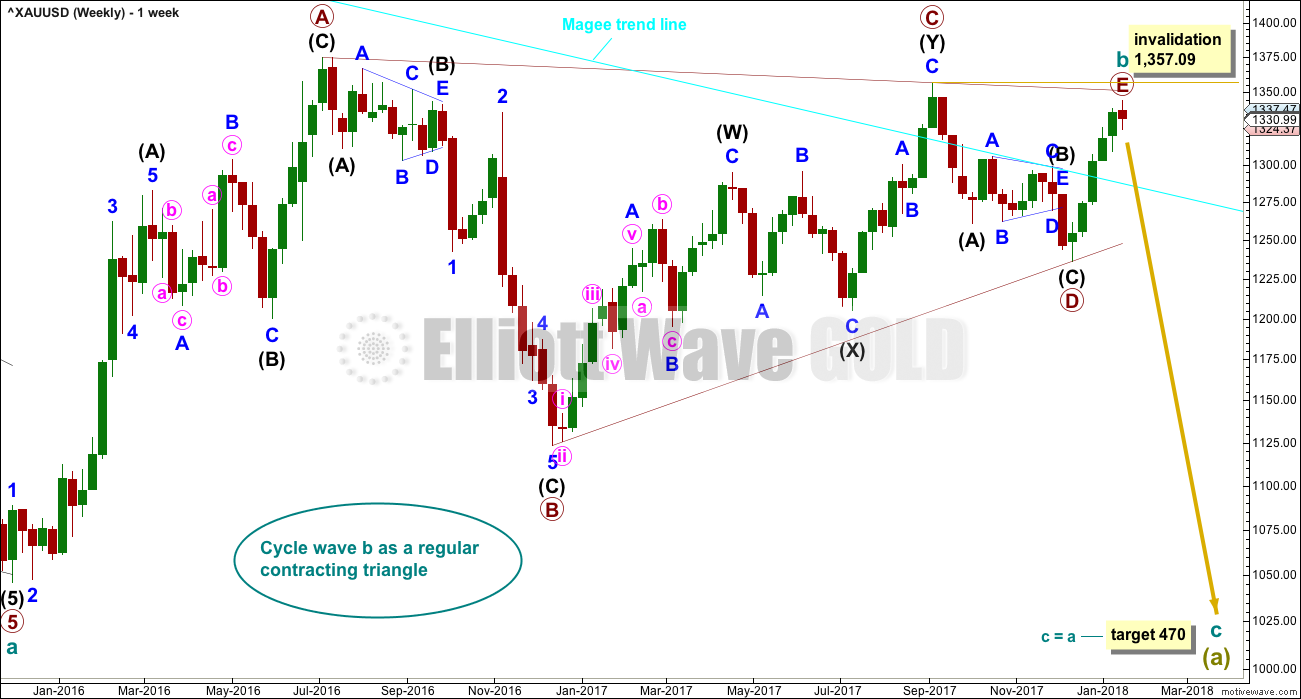
All main wave counts expect that Gold completed a large five down from the all time high in November 2011 to the low of December 2015, which is seen on the left hand side of weekly charts.
If this analysis is correct, then the five down may not be the completion of the correction. Corrective waves do not subdivide as fives; they subdivide as threes. The five down is seen as cycle wave a within Super Cycle wave (a).
Cycle wave b began in December 2015.
This wave count looks at cycle wave b to be most likely a regular contracting triangle.
All sub-waves must subdivide as threes within an Elliott wave triangle, and four of the five sub-waves must be zigzags or multiple zigzags, and the most common sub-wave to be a multiple is wave C. Only one sub-wave may be a more complicated multiple. This triangle meets all these rules and guidelines; all subdivisions fit perfectly at all time frames. It is the main wave count for these reasons, and thus is judged to have the highest probability.
The triangle trend lines have a normal looking convergence.
While primary wave E should also most likely look like an obvious three wave structure at the weekly and daily chart levels, it does not have to do this. It is possible that primary wave E could be over, falling reasonably short of the A-C trend line and being relatively quick. E waves of triangles can be the quickest of all triangle waves.
DAILY CHART
Click chart to enlarge.
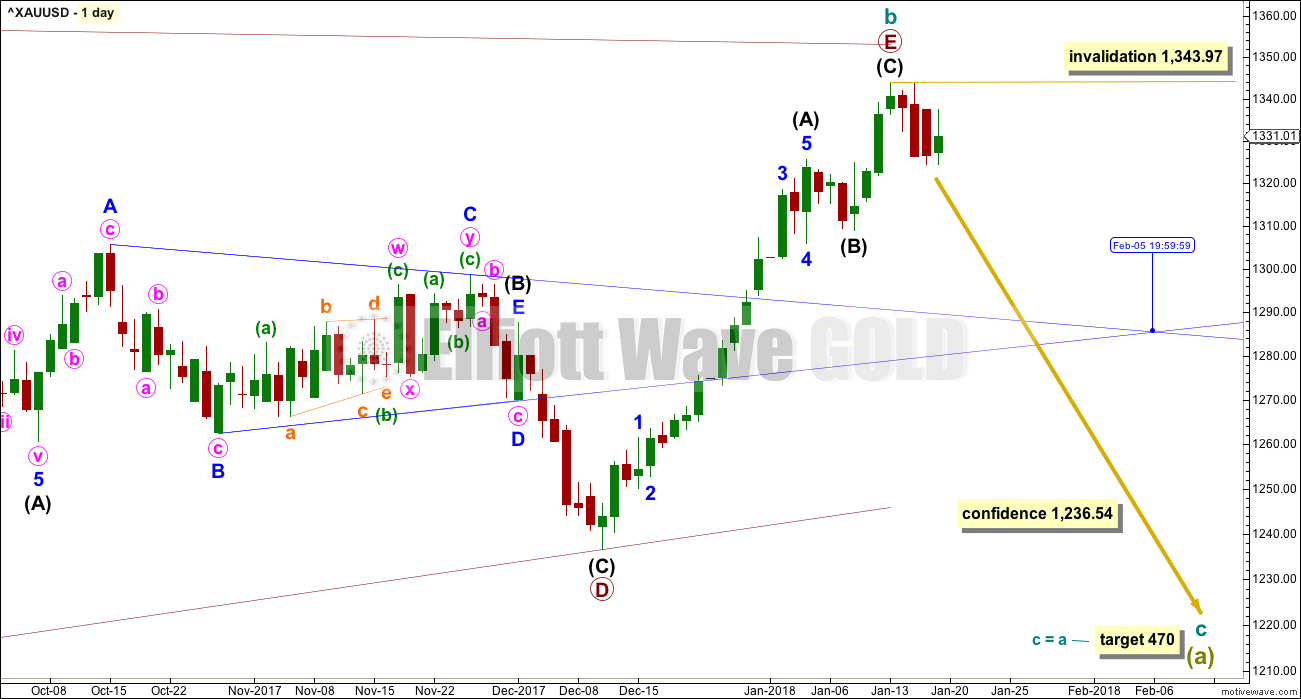
This first daily chart follows on directly from the weekly chart above. The triangle for cycle wave b may have just recently completed.
Primary wave E fits as a completed zigzag and falls reasonably short of the A-C trend line, the most common point for E waves of Elliott triangles to end.
If this wave count is correct, then price needs to move strongly lower next week. Within the new trend, no second wave correction may move beyond the start of its first wave above 1,343.97.
The target for cycle wave c to end assumes the most common Fibonacci ratio to cycle wave a.
A new low below 1,236.54 would invalidate weekly alternate wave counts and provide a high level of confidence in this main wave count.
HOURLY CHART
Click chart to enlarge.
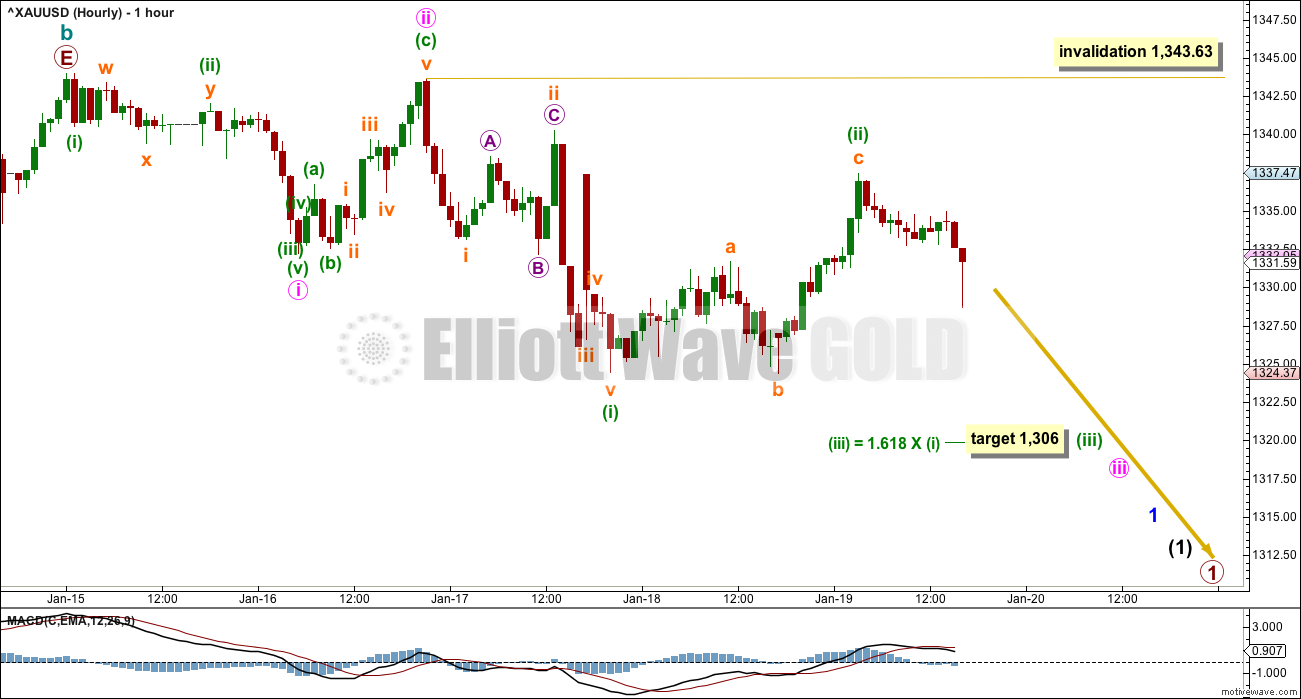
There may only be two first and second waves complete or almost complete. This wave count still expects to see an increase in downwards momentum next week.
Minuette wave (ii) may not move beyond the start of minuette wave (i) above 1,343.63.
The target for minuette wave (iii) expects it to exhibit the most common Fibonacci ratio to minuette wave (i). If the target is wrong, it may be too high.
SECOND WAVE COUNT
WEEKLY CHART
Click chart to enlarge.
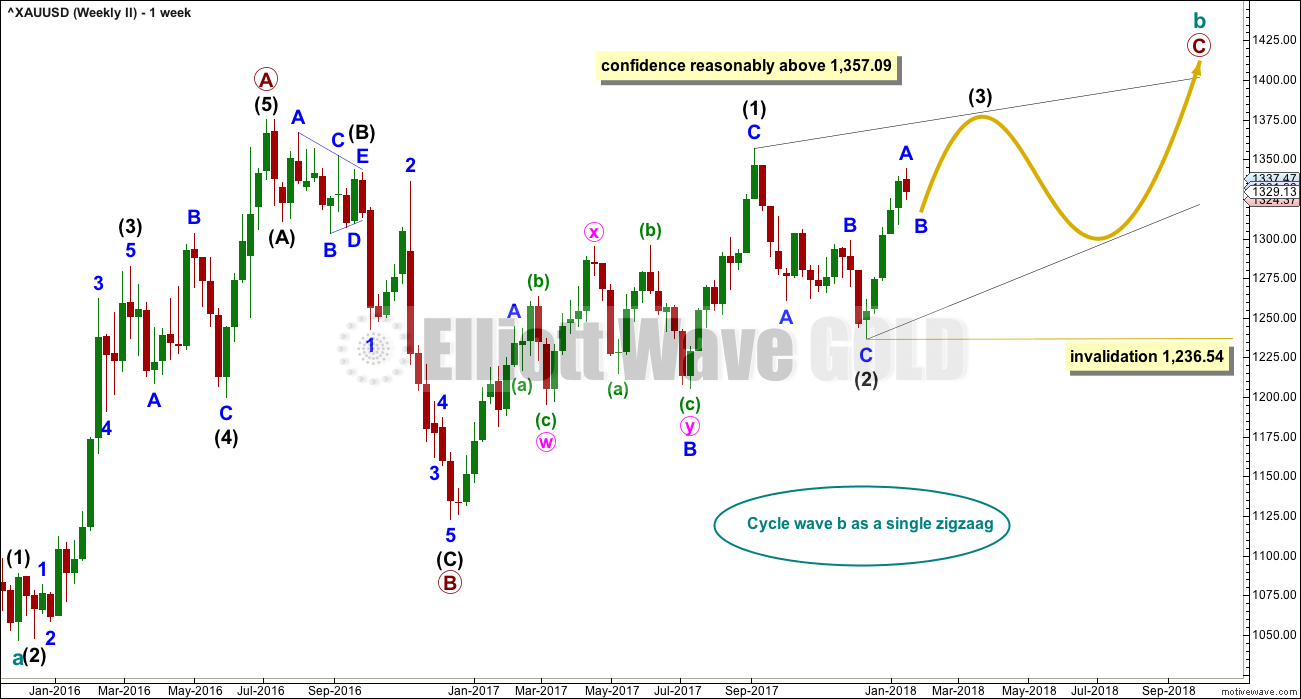
If cycle wave b is a single zigzag, then the upwards wave labelled here primary wave A must be seen as a five wave structure. But this is problematic because (within primary wave A) intermediate wave (4) lasted 12 weeks whereas intermediate wave (2) only lasted 2 weeks. While disproportion between corrective waves does not violate any Elliott wave rules, it does give a wave count the wrong look.
Gold is typical of commodities in that it often exhibits swift strong fifth waves, leading to blowoff tops in bull markets and selling climaxes in bear markets. This tendency is most often seen in Gold’s third waves. When this happens the strong fifth wave forces the fourth wave correction that comes before it to be more brief and shallow than good proportion to its counterpart second wave would suggest. When this happens the impulse has a curved three wave look to it at higher time frames.
It is acceptable for a wave count for a commodity to see a curved impulse which has a more time consuming second wave correction within it than the fourth wave correction.
The impulse has a more time consuming fourth wave than the second in this case though, giving the wave the look of a zigzag. This is unusual, and so the probability of this wave count is low.
Low probability does not mean no probability, so this wave count is possible; when low probability outcomes do occur, they are never what was expected as most likely.
Primary wave C must subdivide as a five wave structure, either an impulse or an ending diagonal. Because the upwards wave of intermediate wave (1) fits as a zigzag and will not fit as an impulse, an ending diagonal is considered.
Ending diagonals require all sub-waves to subdivide as zigzags.
Within intermediate wave (1), to see this wave as a zigzag, minor wave B is seen as a double flat correction. In my experience double flats are extremely rare structures, even rarer than running flats. The rarity of this structure further reduces the probability of this wave count.
Intermediate wave (3) must move beyond the end of intermediate wave (1) above 1,357.09.
Intermediate wave (3) must subdivide as a zigzag. Within the zigzag, minor wave B may not move beyond the start of minor wave A below 1,236.54. At this stage, the last three days of sideways movement look like a correction within an ongoing upwards trend which would favour this alternate wave count. Minor wave B may last from just a few days to a few weeks.
THIRD WAVE COUNT
WEEKLY CHART
Click chart to enlarge.
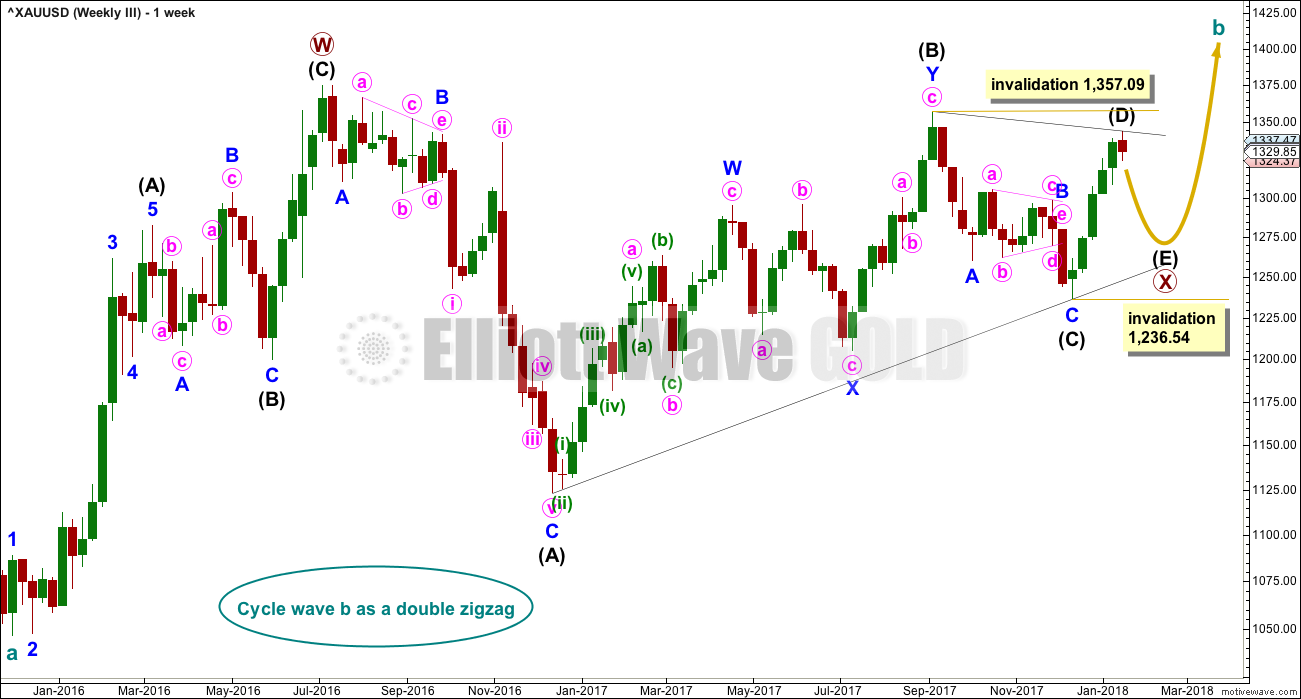
Cycle wave a is still seen as a completed five wave structure. This third wave count looks at cycle wave b as a possible double zigzag.
A triangle may be completing as an X wave within a double zigzag for cycle wave b.
Now the upwards wave labelled here primary wave W is seen as a zigzag. This has a better fit than the first alternate.
Within the triangle for primary wave X, intermediate waves (A) through to (C) may be complete. Intermediate wave (D) may also be complete, but there is room for it to still move higher. If the triangle for primary wave X is a regular contracting triangle, then intermediate wave (D) may not move beyond the end of intermediate wave (B) above 1,357.09. If the triangle is a barrier triangle, then intermediate wave (D) should end about the same level as intermediate wave (B), so that the (B)-(D) trend line remains essentially flat. In practice, this means that intermediate wave (D) may end slightly above 1,357.09 and this wave count would remain valid.
This is why a new high reasonably above 1,357.09 only would invalidate this wave count. This invalidation point is not black and white.
The final sub-wave of intermediate wave (E) may have now begun. Intermediate wave (E) may not move beyond the end of intermediate wave (C) below 1,236.54. This invalidation point is black and white. A new low by any amount at any time frame would invalidate this wave count.
TECHNICAL ANALYSIS
WEEKLY CHART
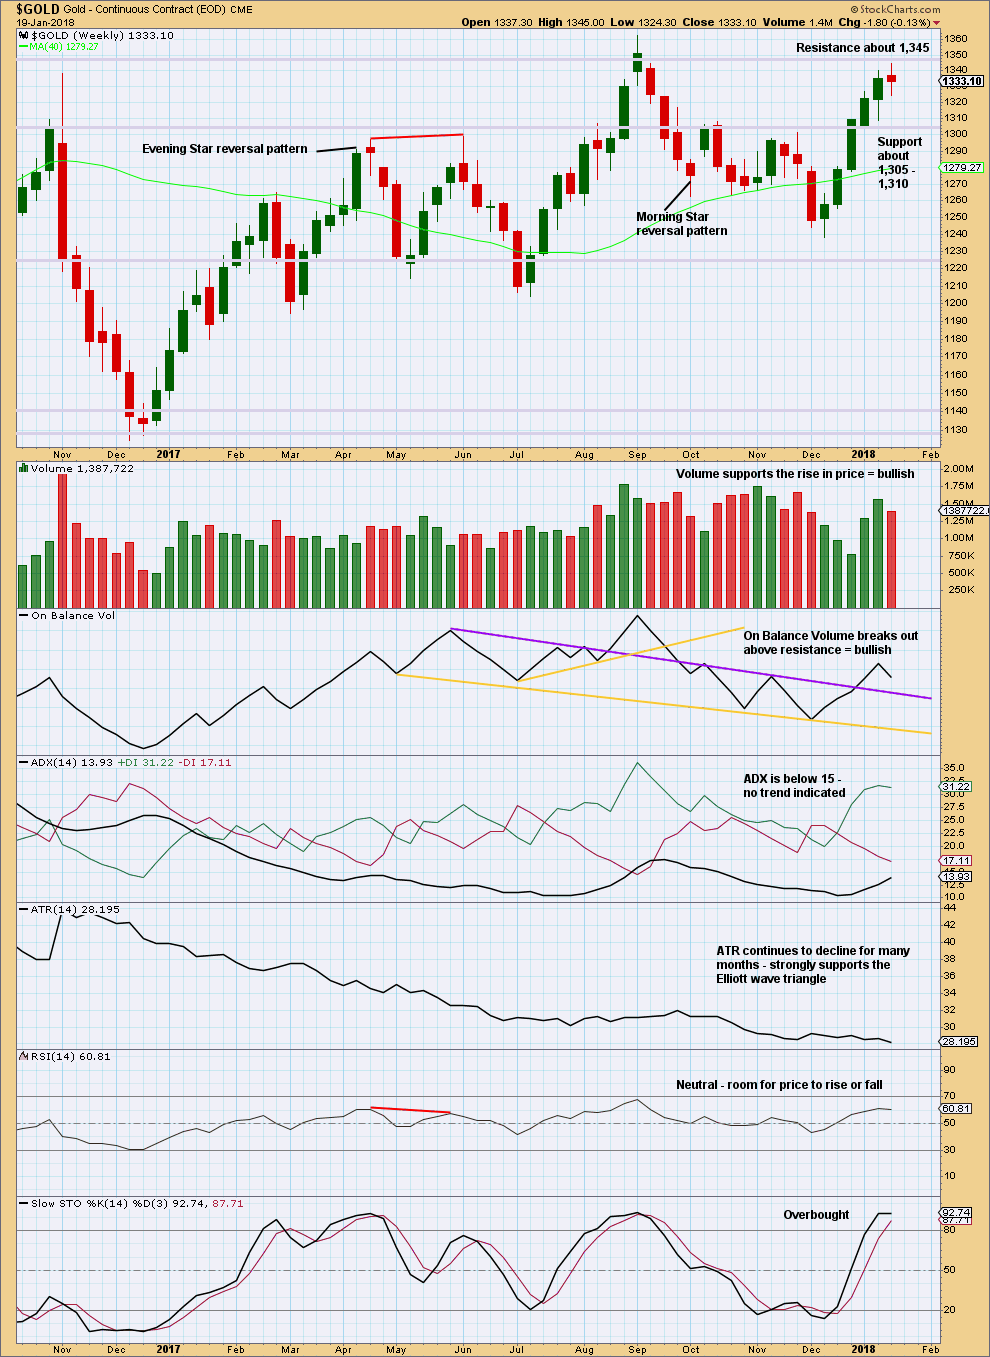
Click chart to enlarge. Chart courtesy of StockCharts.com.
Price found resistance this week, at about 1,345.
The small spinning top candlestick and decline in volume suggest a pause within an upwards trend, or a weak end to the upwards trend.
Stochastics may move further into overbought territory before price turns.
DAILY CHART
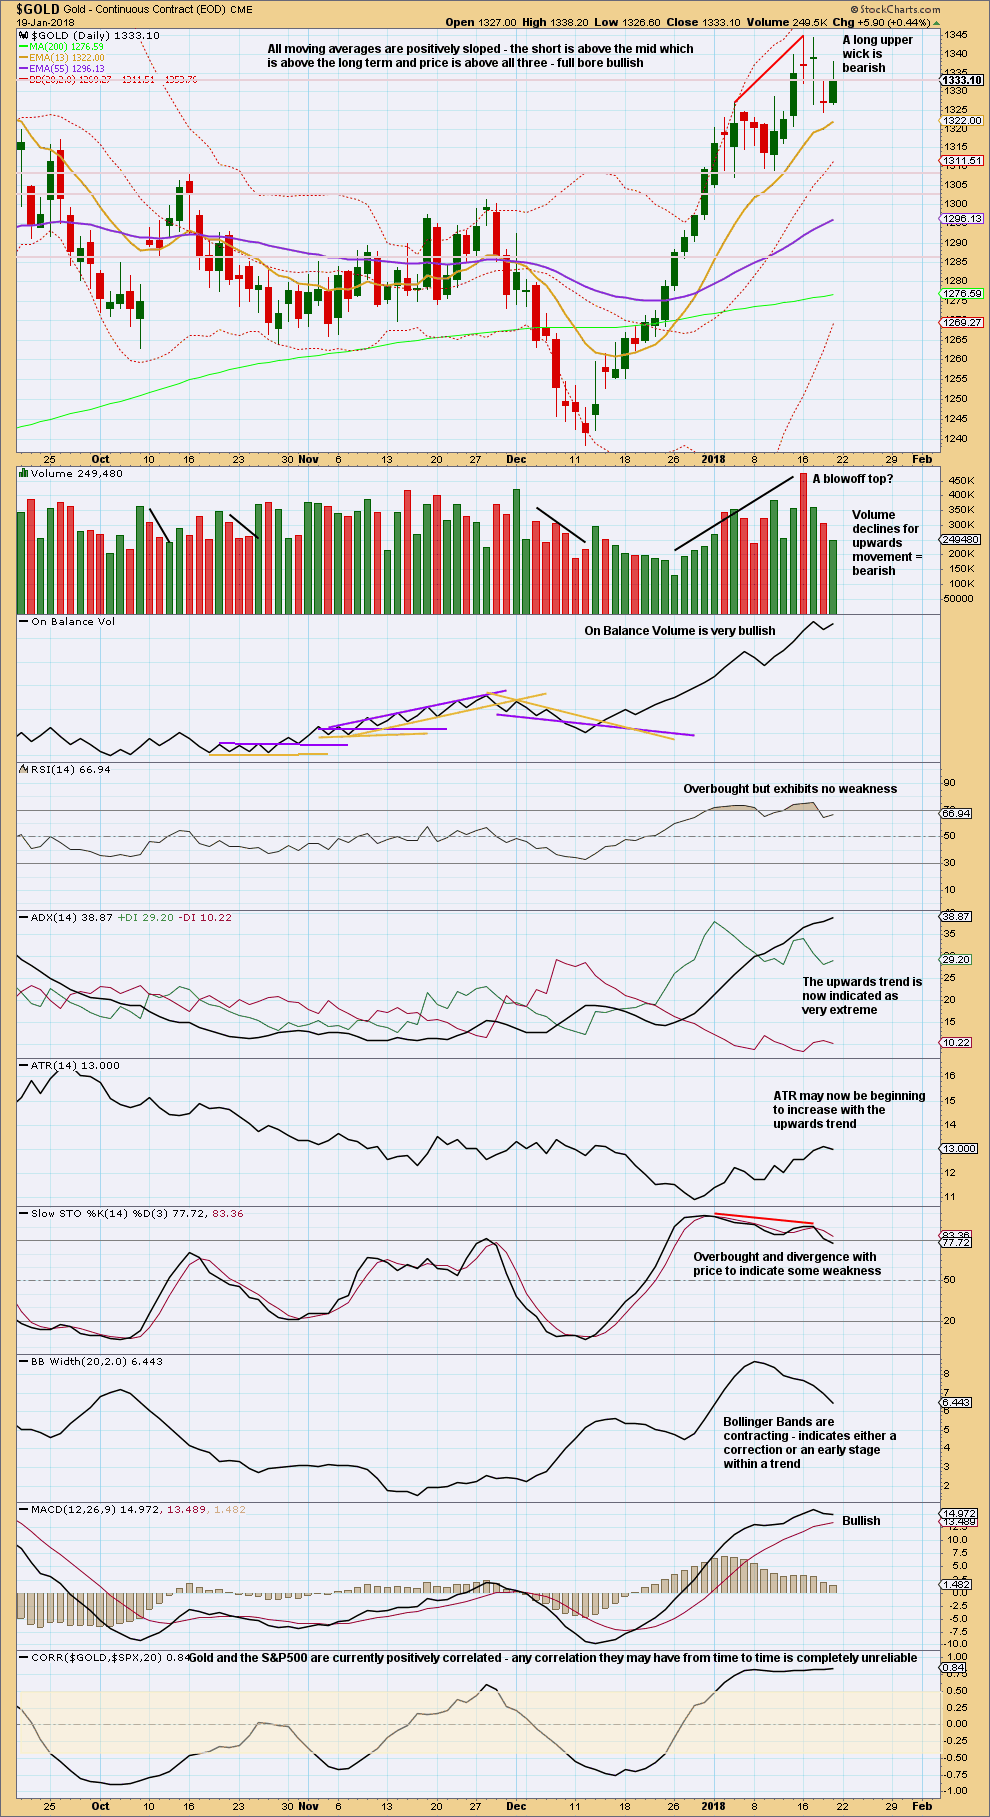
Click chart to enlarge. Chart courtesy of StockCharts.com.
Three doji in a row and three sessions on declining volume all suggest a consolidation here within an upwards trend. This favours the second weekly wave count at this stage.
GDX DAILY CHART
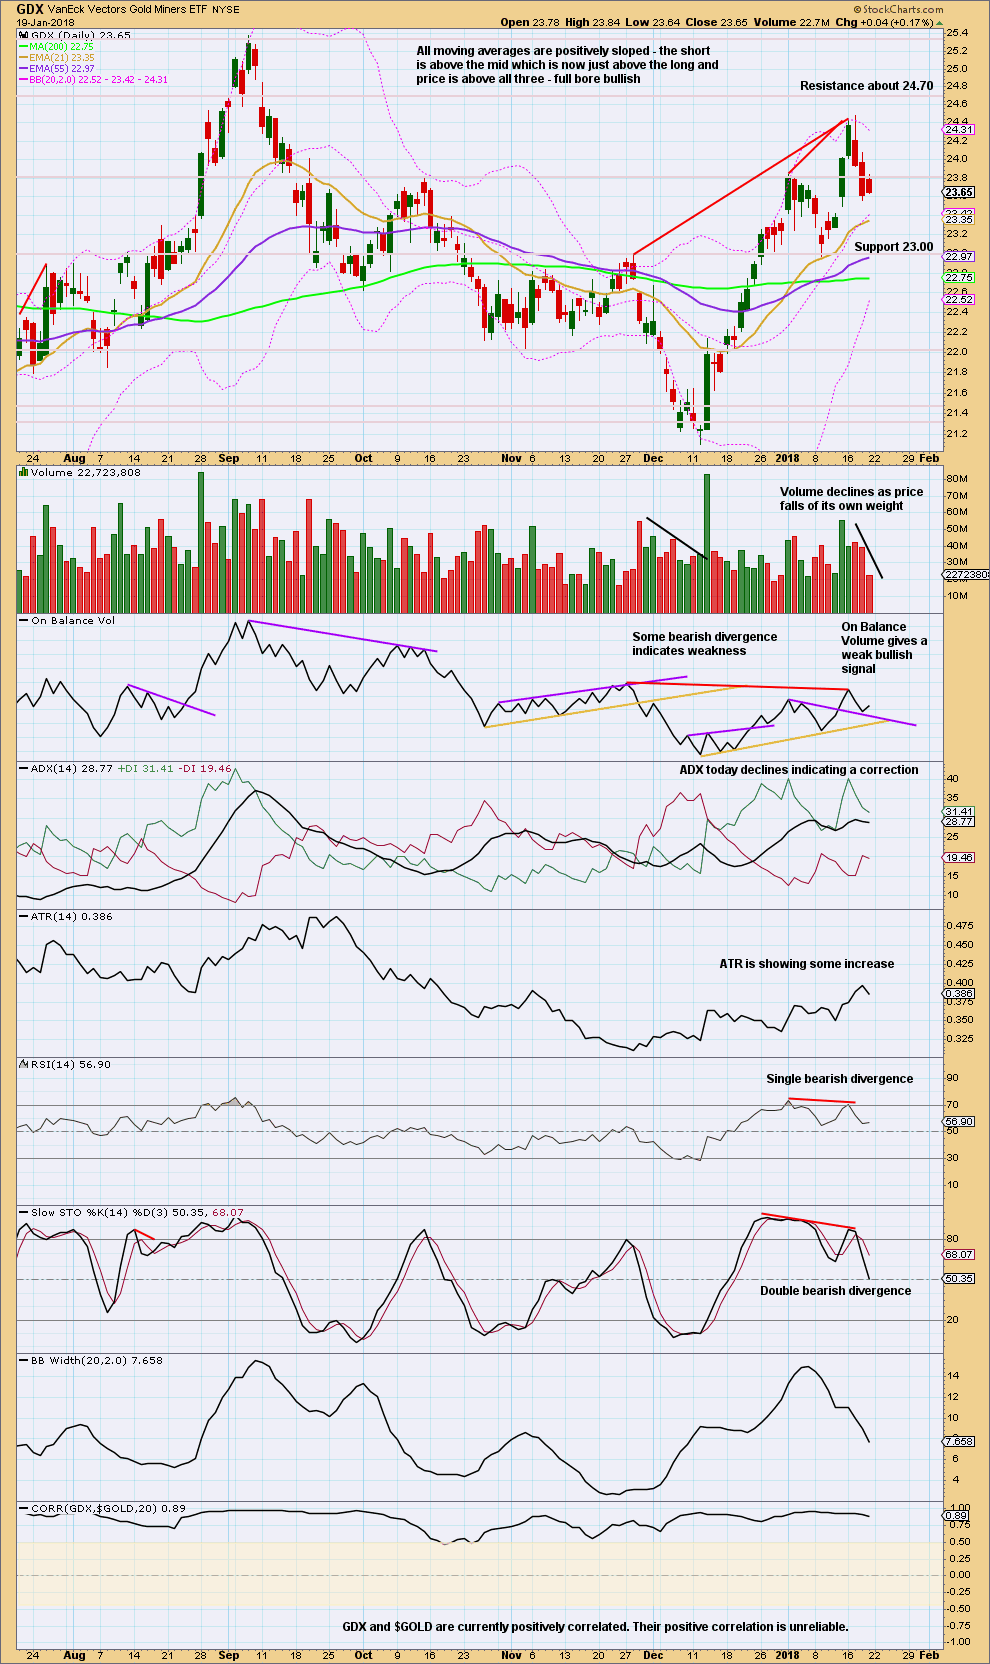
Click chart to enlarge. Chart courtesy of StockCharts.com.
It looks like price may have turned for GDX. Look for price to move lower to support while Stochastics moves lower towards oversold.
Published @ 05:11 p.m. EST on 20th January, 2018.
Can social mood grow in a vacuum, divorced from the happenings around us? Is it possible for social mood to be totally unaffected by Events, News, Narratives and suchlike?
The core of EW theory is that it is social mood that creates events, news and narratives.
Not the other way around.
It’s an important distinction, and actually rather difficult to wrap ones head around. It’s a very unpopular view. Common consensus is that news and events drive markets and our behaviour.
Hi Lara,
sorry to ask this again but could you please do another video on how to get the cash data into Motivewave because my FXCM futures charts in Motivewave looks different in several important respects to your chart below which leads to incorrect wave interpretation.
No worries.
I need to update my BitCoin analysis so I’ll do that later today and video it for you 🙂
Sideways movement looks like and fits as a triangle. That would be for a B wave.
I’m adjusting the short term wave count to this today.
I’ve checked the subdivisions of minuette (iii) within minute i on the five and one minute charts. I’ll publish the five minute chart if anyone requires it here in comments. It will fit as an impulse, that weird spike up to 1,337.4 and waterfall down right after on the 17th of January makes it problematic, but it does all fit.
Very good read on the USD & Gold
https://goldtadise.com/?p=421781#comments
Dreamer, it might be an interesting read but it is worthless. I have been a subscriber to Rambus Chartology for years and according to my experience his “chartology” method is hopelessly behind the curve. He actually gives trade recommendations too, which I never followed but have been watching the outcomes. He enters trades at “breakouts” when a trend is “confirmed”, that is, going on for weeks or months. Well, shortly thereafter in most of the cases the “confirmed trend” actually happens to reverse and he either runs for the exit (closes the trade with a loss) or in some of the cases with a very small profit, which could have been substantial if his method was able to identify turning points and thereby capture most of the swings. His writings might be interesting, but he is doing nothing but commenting on past market moves from his own perspective. There is nothing an actual trader, investor or even analyst could use to identify market turns or direction of future trends. Just a caveat for other members here… By the way, less than two months ago he was very bearish on the PM complex and bullish on USD, this writing only reflects the market changes since the last interest rate raise.
Fair enough, I respect your opinion. I have never been a Rambus member. I just like some of the posts on the Goldtent forum.
This idea assumes a “relationship” between USD and Gold.
There isn’t one.
I know that this is a really unpopular view, but I have to keep going back to the correlation co-efficient. The two sets of data are not reliably correlated.
At the weekly chart level the correlation co-efficient spends far too much time in the shaded area of “no correlation” for any analysis of one market to rely upon the other.
The comments and charts you link to seem to be allowing for this by saying “the relationship changes”. Well yes, of course it can be interpreted to change. Because there is no reliable relationship.
Trying to see a pattern in the changes… on very shaky ground there IMO.
I’d rather stick with the math.
And at the monthly chart level its even clearer that these two markets simply have no reliable correlation.
That’s what the math shows.
Yes, the math tells the true story. Thank you.
From Stockcharts website:
“Gold and the Dollar are the first two securities that come to mind for a negative correlation. The chart below shows Spot Gold Spot ($GOLD) with the US Dollar Index ($USD). Although the Correlation Coefficient spends a fair amount of time in positive territory, it is negative the majority of the time. In general, anything below -.50 shows a strong negative correlation. “
Lara, thank you for the SPX and US Oil videos and analysis! 😊 🤩 😀 I’m a little unclear… was this a one-off for promotional purposes? (I see that you made it public with a link from Stocktwits, although it’s not categorized as public) or is this a new addition to EWG that we can expect weekly in the future? 👍
Also, any general themes from your recent member survey that you can share with us? I know, too many questions 🤐 Thanks!
General themes: our pricing looks about right, and most members are pretty happy.
Someone made a comment a while ago (I think it may have been Rodney over at EWSM) that a once a week offering might attract longer term traders / investors.
And so I’m going to trial a once a week offering of Gold, S&P500 and Oil (as those are the three most popular markets I analyse) to gauge interest.
This first post was to see how I could put it together and see how much extra work it would be. Cesar and I have yet to make a decision on whether or not we will add this as an extra service. Not sure yet.
The idea is to offer something that longer term, buy and hold kind of investors, might like. Focus on the bigger picture, ignoring short term volatility.
It will not change what I’m already doing for you all. That would remain exactly the same.
I’ll add that I really like the idea of focusing on a bigger picture.
I rarely watch video of market analysis (I find it tedious, I’m a reader not a video watcher) but there is one person I will watch and thats Chris Ciovacco. His weekly videos almost always teach me something new (and he doesn’t muck around with um and ah, he’s concise and to the point).
One thing he keeps saying is there is volatility to ignore. And he’s right. And I get concerned that my provision of daily analysis leads or encourages members to focus on the short term swings. We don’t see the forest for the trees.
But one other trend from our survey is that almost everyone here is reading the analysis five times a week, so I have no plans to stop doing that. Even though I don’t think it is always in everyone’s best interests.
I, maybe most other members here as well, would certainly like to know who you follow in the market, please. The “mentor” of my “mentor” must be “follow-able” !!
Only Chris Ciovacco.
And a bunch of textbooks: Magee, Kirkpatrick and Dhalquist, Nison, Pring and occasionally Aronson.
CMTs here may notice I’m not listing Kaufman 🙂 I find him exceedingly difficult to read.
I do not read other market analysis online, nor watch videos. For me that would be just too much noise. I stick to what I learned when I did my CMT.
Chris Ciovacco is the sole exception because I find his presentation concise and he focusses on solid technical analysis.
Thanks for sharing some of the survey themes. Yes, that may be a good format for long term investors. Thanks for sharing it with us!
You’re welcome 🙂
This could really change the trading world for the retail trader. Trade GLD and SLV and others 24/5!
https://www.cnbc.com/2018/01/22/investors-can-trade-the-stock-market-24-hrs-a-day-with-td-ameritrade.html
Congrats Lara!!
New Zealand Just Became The 11th Country To Send A Rocket Into Orbit
https://www.huffingtonpost.com/entry/rocket-lab-orbit-new-zealand_us_5a646ecae4b0dc592a098f5d?ncid=inblnkushpmg00000009
LOL
There’s some most excellent surf down in Mahia Peninsula. And the rocket lab.
Lara,
When an invalidation point is breached by “any amount” on “any time frame”, it would invalidate that specific wave count on “all time frames”.
This is my understanding from your weekend video. Is my understanding correct, please?
Thank you kindly.
Lara,
Kindly disregard the above question, please. I was not thinking through it , sorry.
Thank you kindly.
Lara is very clear about main and alt wave count (bullish) for invalidation.
If gold violates 1357.09 by any amount the main wave count will be violated and the alt wave count will be become main count (bullish vount).
Invalidation for alt wave count is 1236.24. That will make the main count validated.
Watch two price points 1357.09 and 1236.24??
Thank you Papudi.