
Yesterday’s classic technical analysis summary warned of possible upwards movement. Today’s upwards movement invalidated the main Elliott wave count and now two valid Elliott wave counts remain.
Summary: While price remains within the channel on the daily charts, assume the upwards trend remains. A target is now at 1,432.
If price breaks out below the lower edge of the channel, then expect a time consuming consolidation or a deeper pullback has arrived. Targets for it to end would be either 1,314 or 1,284 (favouring neither).
The two remaining wave counts now expect that Gold is in a bull market which may not make a new low below 1,236.54.
New updates to this analysis are in bold.
Last historic analysis with monthly charts is here. Video is here.
Another alternate monthly chart is here.
Grand SuperCycle analysis is here.
MAIN ELLIOTT WAVE COUNT
WEEKLY CHART
Click chart to enlarge.
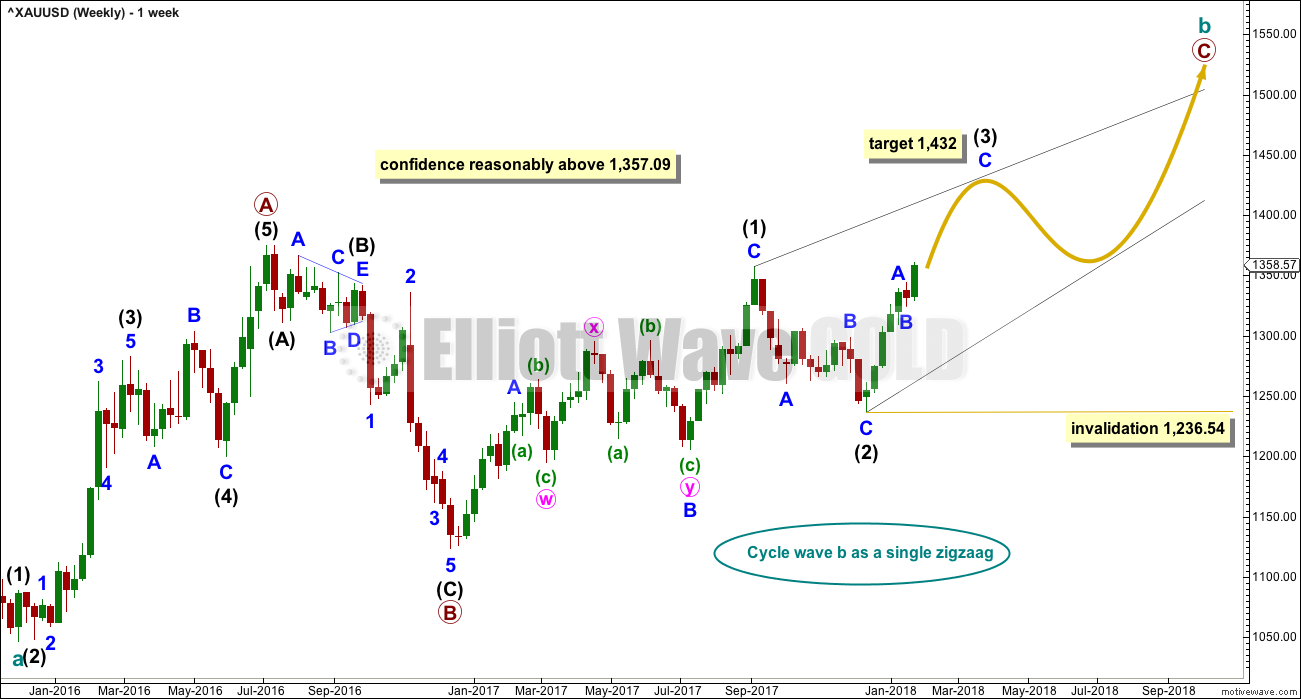
All main wave counts will expect that Gold completed a five wave impulse down to the low labelled cycle wave a in December 2015. An historic alternate wave count looks at the possibility that the downwards wave was a double zigzag (this is linked to above). The weekly charts are the same for both ideas at this time.
Cycle wave b may be a single zigzag. Zigzags subdivide 5-3-5. Primary wave C must subdivide as a five structure and may be either an impulse or an ending diagonal. Overlapping at this stage indicates an ending diagonal.
All sub-waves must subdivide as zigzags within an ending diagonal. Intermediate wave (4) must overlap intermediate wave (1) price territory, and may not move beyond the end of intermediate wave (2) below 1,236.54. The classic pattern equivalent here is a rising wedge.
This wave count has two problems, which have up to this stage reduced its probability:
1. This wave count must see the upwards wave labelled primary wave A as a five wave structure. There is a problem within it of disproportion: intermediate wave (2) lasted only two weeks, but intermediate wave (4) lasted twelve weeks, six times the duration. This is unusual for Gold. Gold will fairly and commonly have disproportionate fourth and second waves, but it is commonly the other way around: a more time consuming second wave correction and a quicker fourth wave correction.
2. Within the upwards zigzag of intermediate wave (1), minor wave B is seen here as a double flat correction. These are not common structures.
If price continues higher from here to move reasonably above 1,357.09, then this wave count would be the main wave count by a simple process of elimination. All other wave counts at the weekly chart level would be invalidated. Low probability does not mean no probability. When low probability outcomes occur, as they sometimes do, they are never what was expected as most likely.
DAILY CHART
Click chart to enlarge.
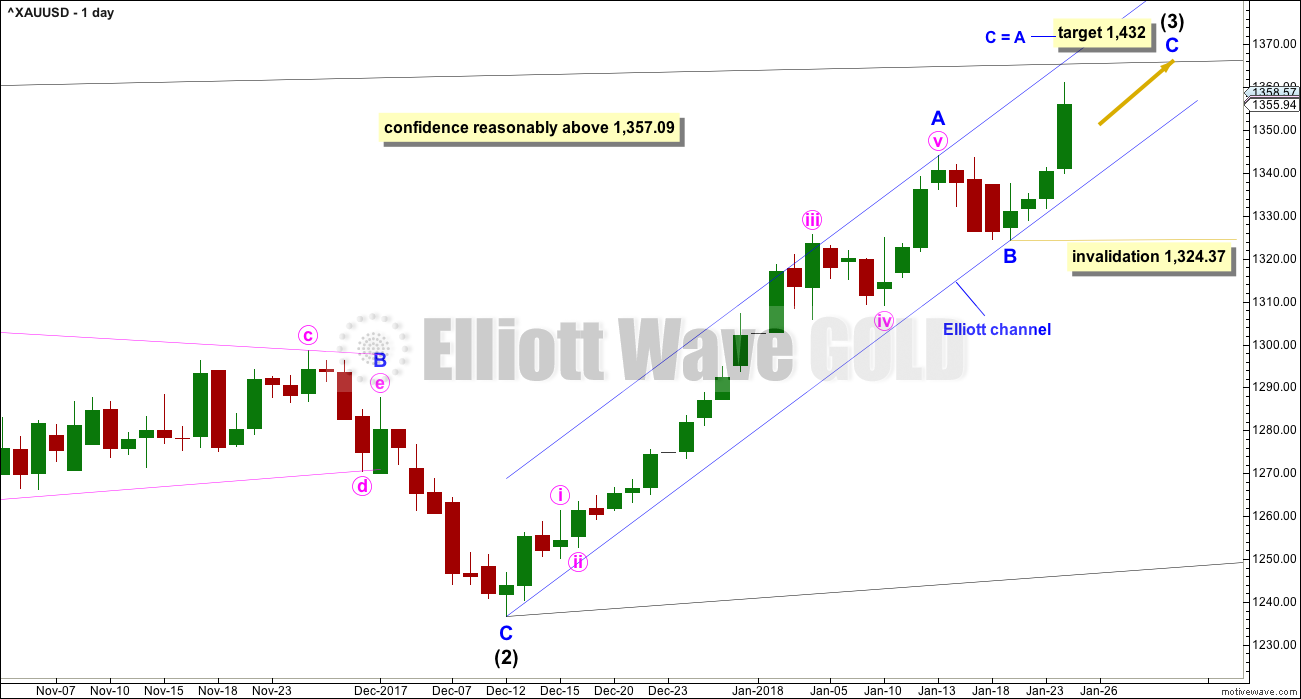
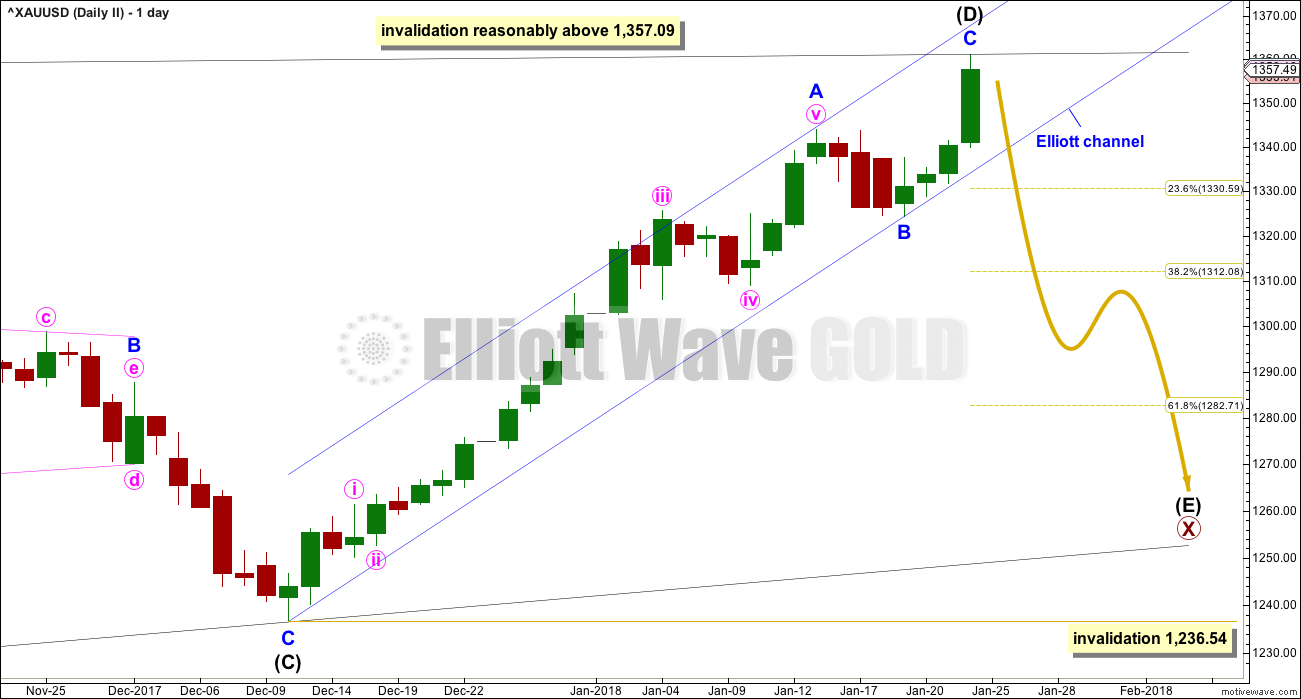
Within the ending diagonal, intermediate wave (3) must sub-divide as a zigzag.
Within the zigzag, minor waves A and B may be over already and minor wave C upwards may have begun. The target assumes the most common Fibonacci ratio between minor waves A and C.
Minor wave C must subdivide as a five wave structure, either an impulse or an ending diagonal. It would most likely be an impulse.
Within minor wave C, no second wave correction may move beyond the start of its first wave below 1,324.37.
HOURLY CHART
Click chart to enlarge.
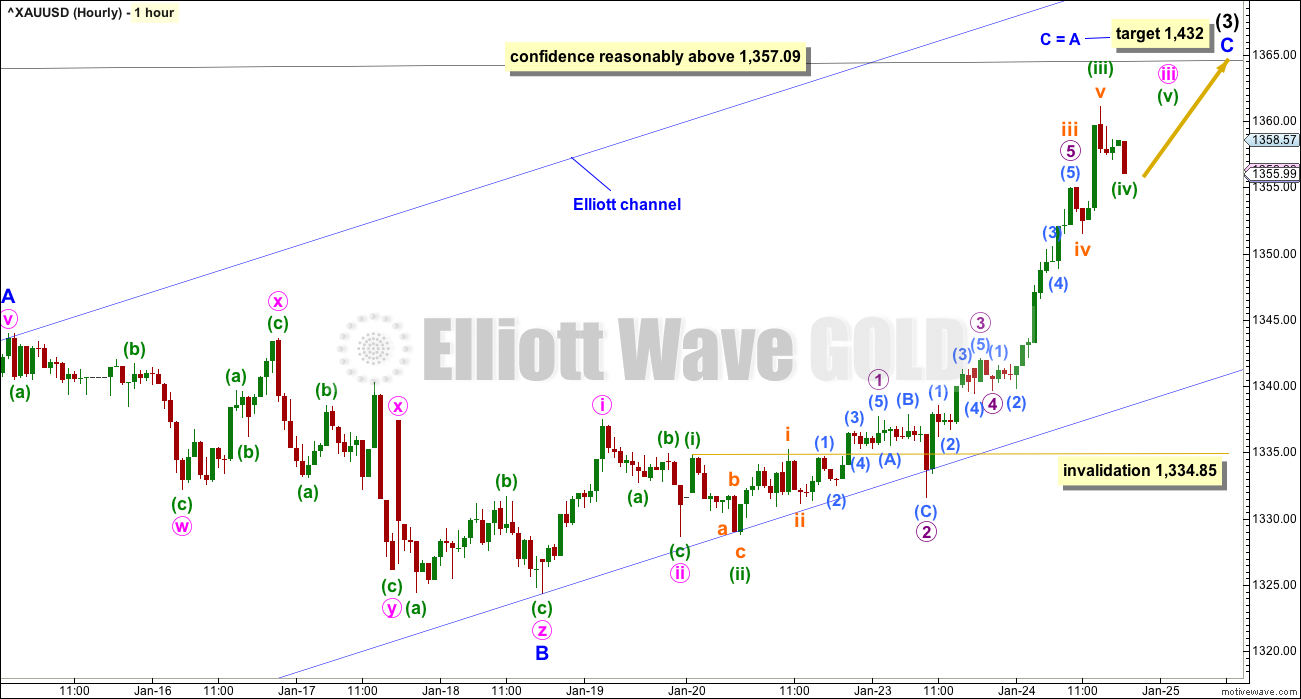
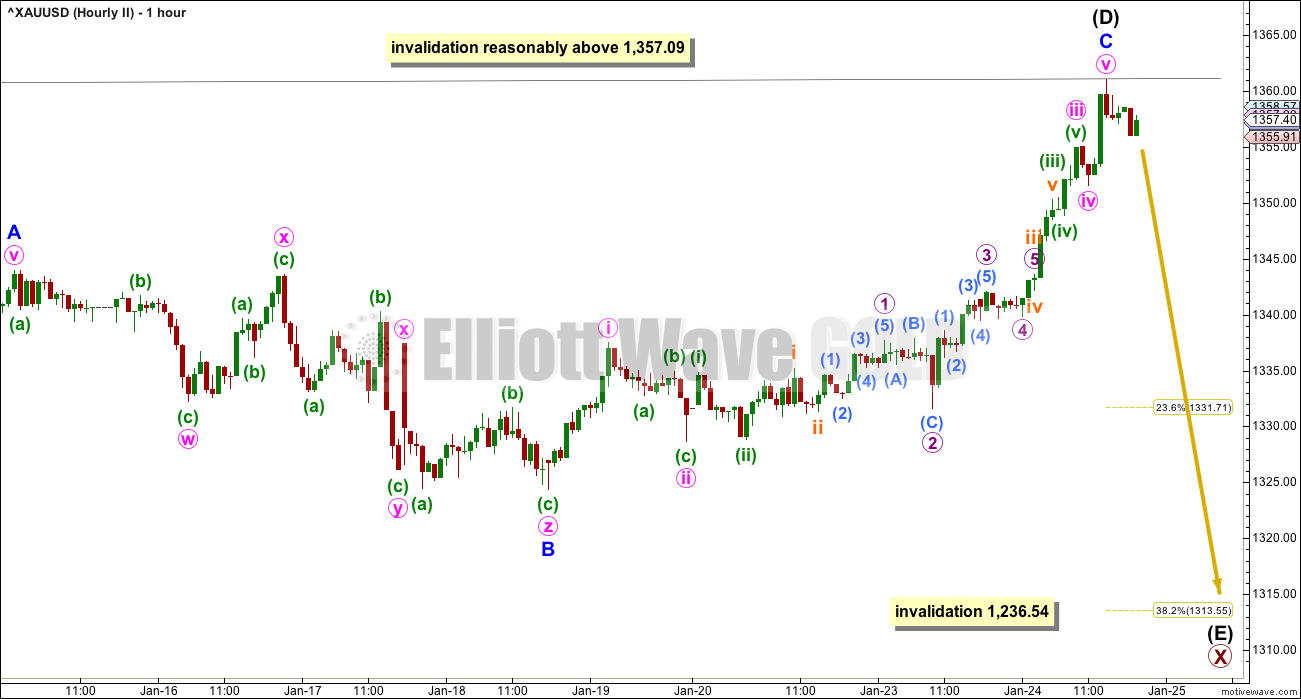
A wave count which sees the structure of minor wave C incomplete has the best fit.
Within minor wave C, minute waves i and ii may be complete. Minute wave iii may have passed its middle. The target at the daily chart level expects that minute wave v would be a long extension. This would fit common behaviour for a commodity.
Minute wave iii may only subdivide as an impulse. Within the impulse, minuette waves (i), (ii) and now (iii) may be complete. Minuette wave (iv) may not move into minuette wave (i) price territory below 1,334.85.
However, this hourly wave count would be discarded prior to a breach of the invalidation point if price breaks below the lower edge of the blue Elliott channel. If that happens, then the alternate daily wave count below would be used.
ALTERNATE DAILY CHART
Click chart to enlarge.
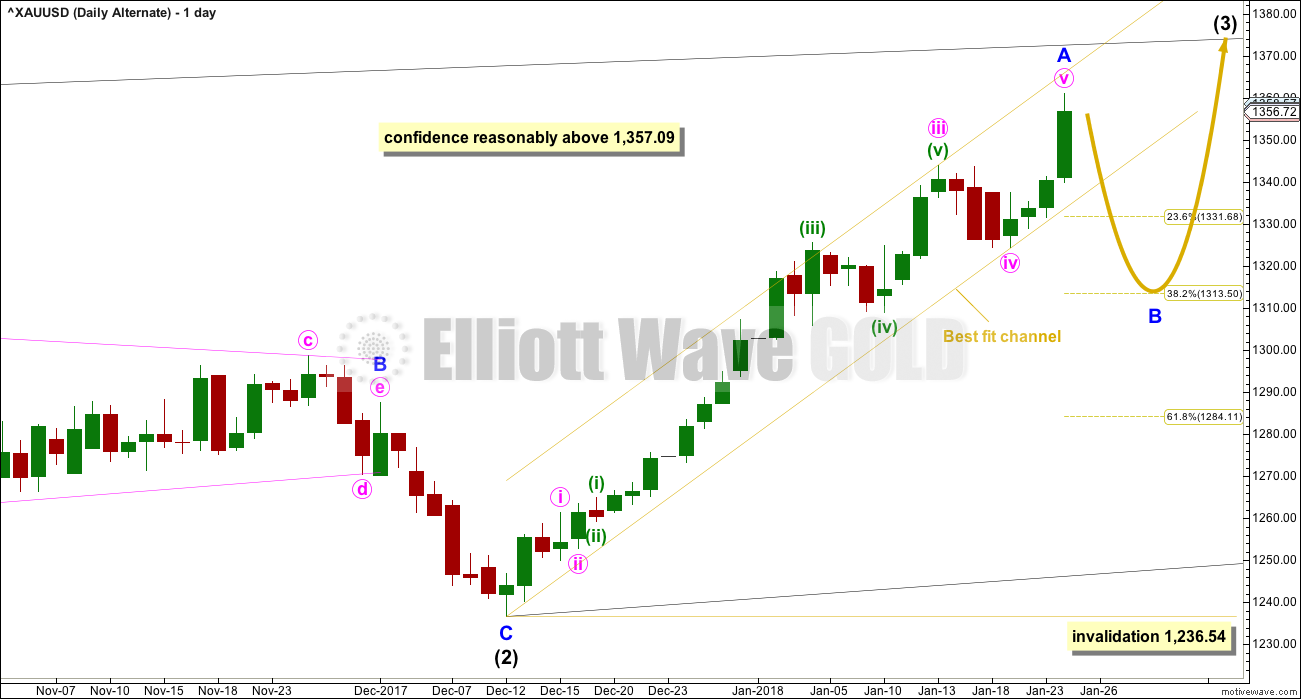
It is also possible that only minor wave A has just completed at today’s high. A breach of the yellow best fit channel (which is drawn the same on all daily charts) would see this alternate daily chart become the only daily chart for the first wave count.
Minor wave B may be a reasonably time consuming consolidation or a quicker sharper pullback within the upwards trend, and it may end about either of the 0.382 or 0.618 Fibonacci ratios (neither may be favoured).
Minor wave B may not move beyond the start of minor wave A below 1,236.54.
SECOND WAVE COUNT
WEEKLY CHART
Click chart to enlarge.
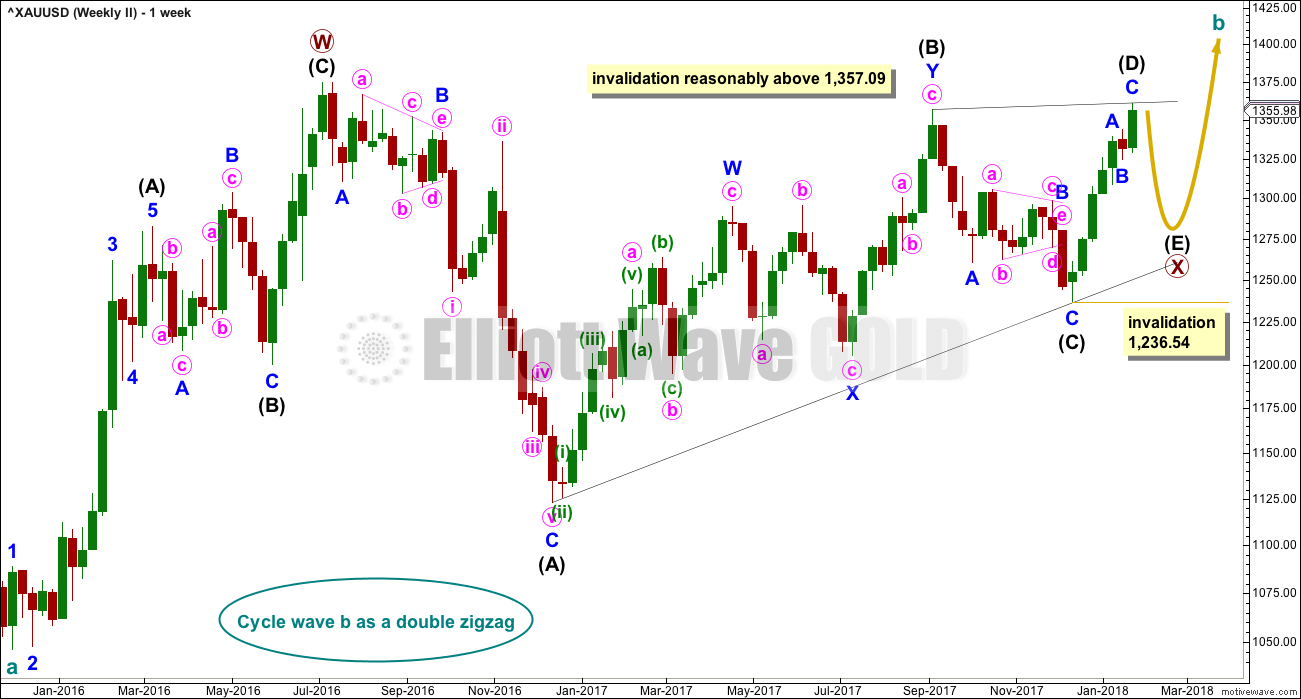
Cycle wave a is still seen as a completed five wave structure. This second wave count looks at cycle wave b as a possible double zigzag.
Now the upwards wave labelled here primary wave W is seen as a zigzag. This has a better fit than the first wave count.
Within the double zigzag, the first zigzag is labelled primary wave W. The double is joined by an incomplete correction in the opposite direction labelled primary wave X. When primary wave X is complete, then a second zigzag would be expected to move price substantially higher and would be labelled primary wave Y.
Double zigzags are fairly common structures. The purpose of the second zigzag in the double is to deepen the correction when the first zigzag does not move price deep enough.
The triangle for primary wave X may be a regular barrier triangle. Within a barrier triangle, intermediate wave (D) should end about the same level as intermediate wave (B) at 1,357.09. This triangle and this wave count will remain valid as long as the (B)-(D) trend line remains essentially flat. At this stage, the trend line still looks essentially flat.
A final zigzag downwards now for intermediate wave (E) may be expected. It would most likely fall short of the (A)-(C) trend line. It should last at least a week, and possibly longer.
Intermediate wave (E) may not move beyond the start of intermediate wave (C) below 1,236.54.
DAILY CHART
Click chart to enlarge.
The blue channel is drawn in exactly the same way on all daily charts today. If this channel is breached, then this wave count would be indicated as very likely.
HOURLY CHART
Click chart to enlarge.
The subdivisions within minor wave C here are seen differently. In order for this wave count to remain valid price should turn here or extremely soon.
If minor wave C is complete, then a very small correction within the middle of the third wave must be counted. This is labelled subminuette wave iv. This does not have as good a fit as the first hourly chart.
TECHNICAL ANALYSIS
WEEKLY CHART
Click chart to enlarge. Chart courtesy of StockCharts.com.
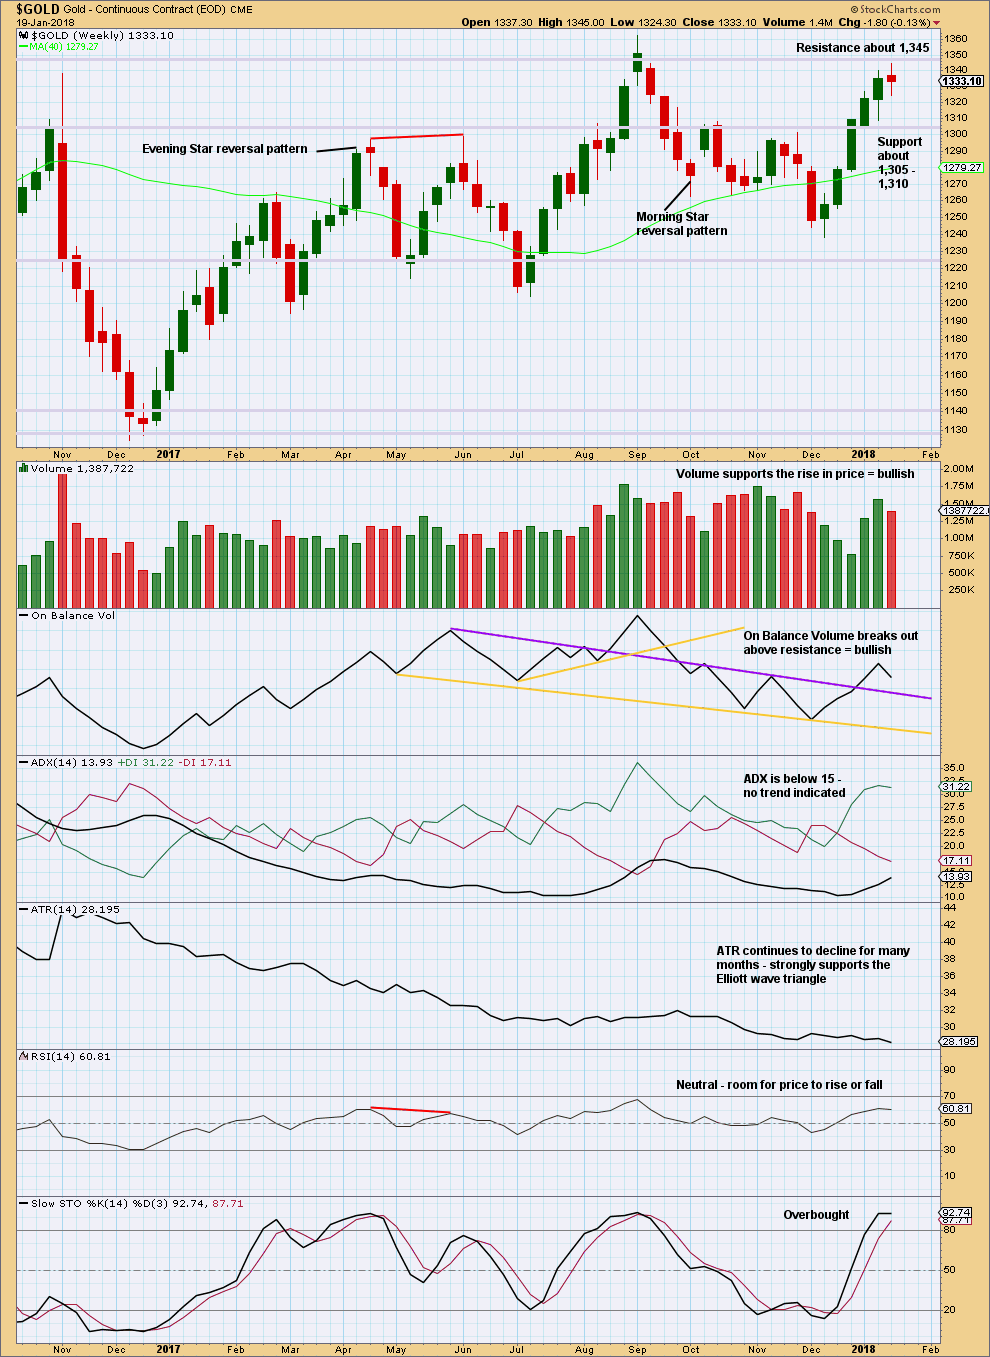
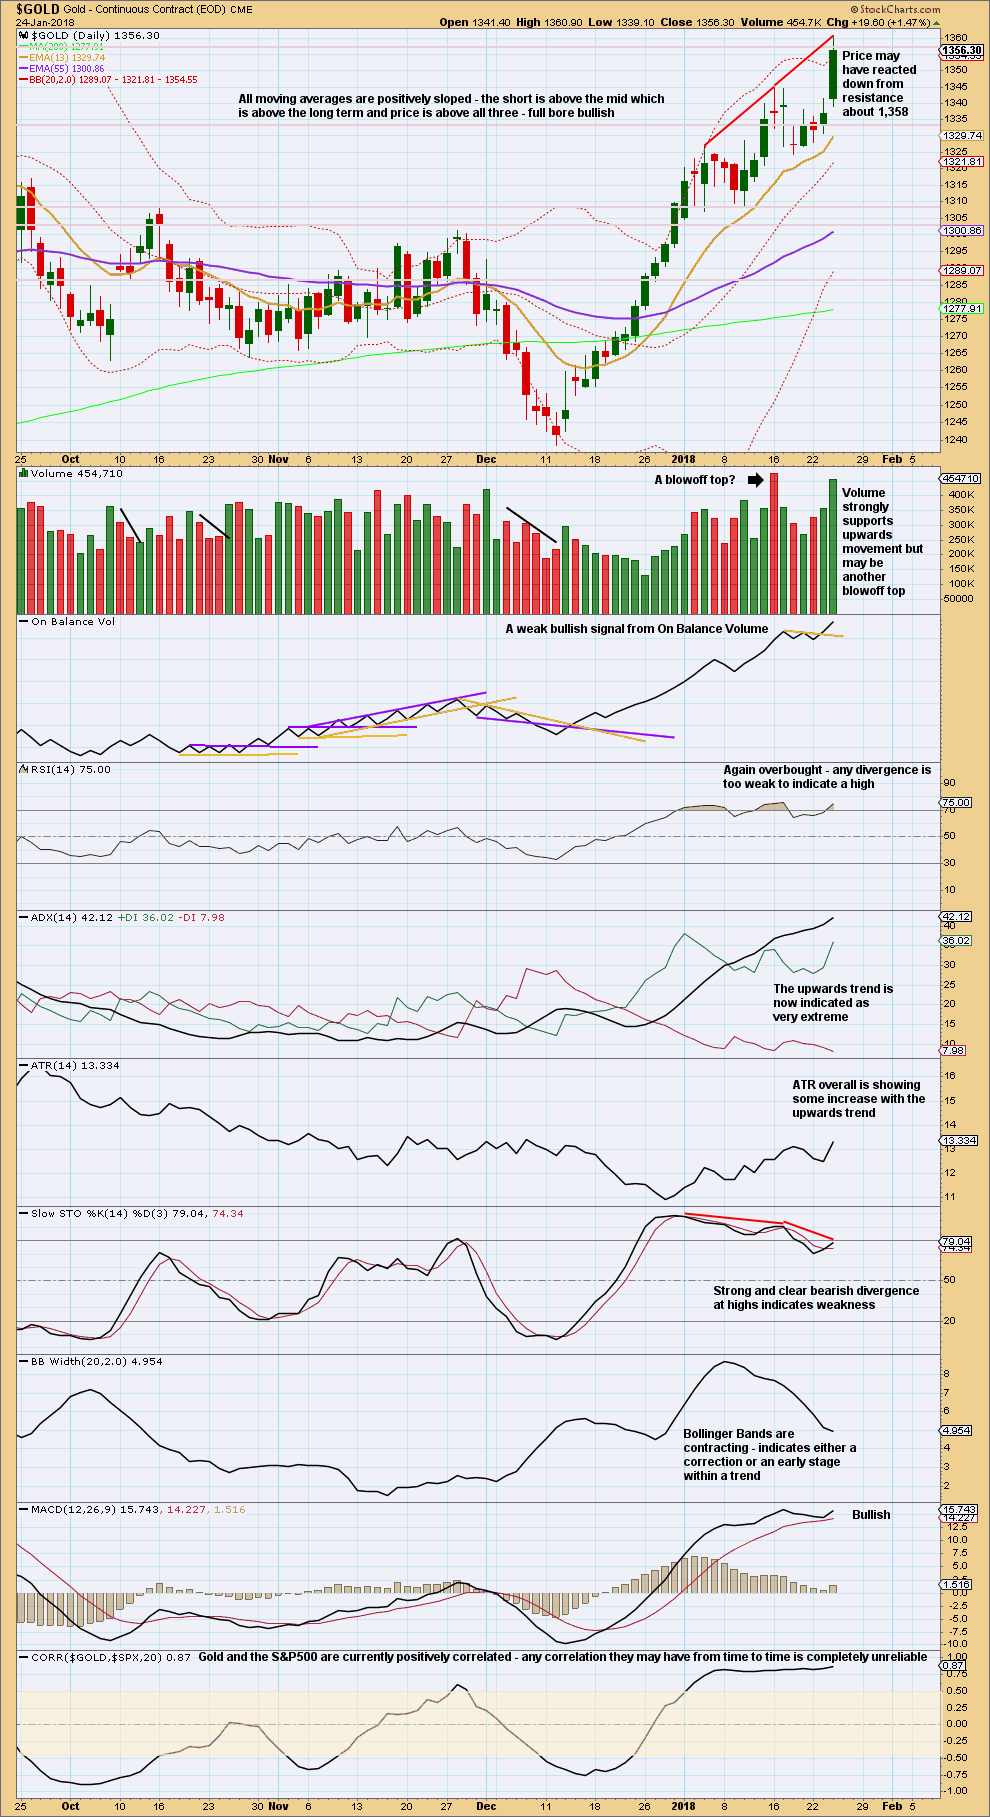
Price found resistance last week, at about 1,345.
The small spinning top candlestick and decline in volume suggest a pause within an upwards trend, or a weak end to the upwards trend.
Stochastics may move further into overbought territory before price turns.
DAILY CHART
Click chart to enlarge. Chart courtesy of StockCharts.com.
Price has broken out from a small consolidation and the upwards trend resumes.
When Gold has a strong bullish trend, ADX may remain extreme for a reasonable period of time while price continues higher and RSI may reach extreme and then exhibit clear and strong divergence with price before the trend ends.
At this stage, there is only very slight divergence between price and RSI.
Strong volume today looks like another blowoff top. Another consolidation or pullback may be expected about here.
The trend is still up until proven otherwise. At this stage, proven otherwise would be a breach of the channel on the daily Elliott wave charts.
GDX DAILY CHART
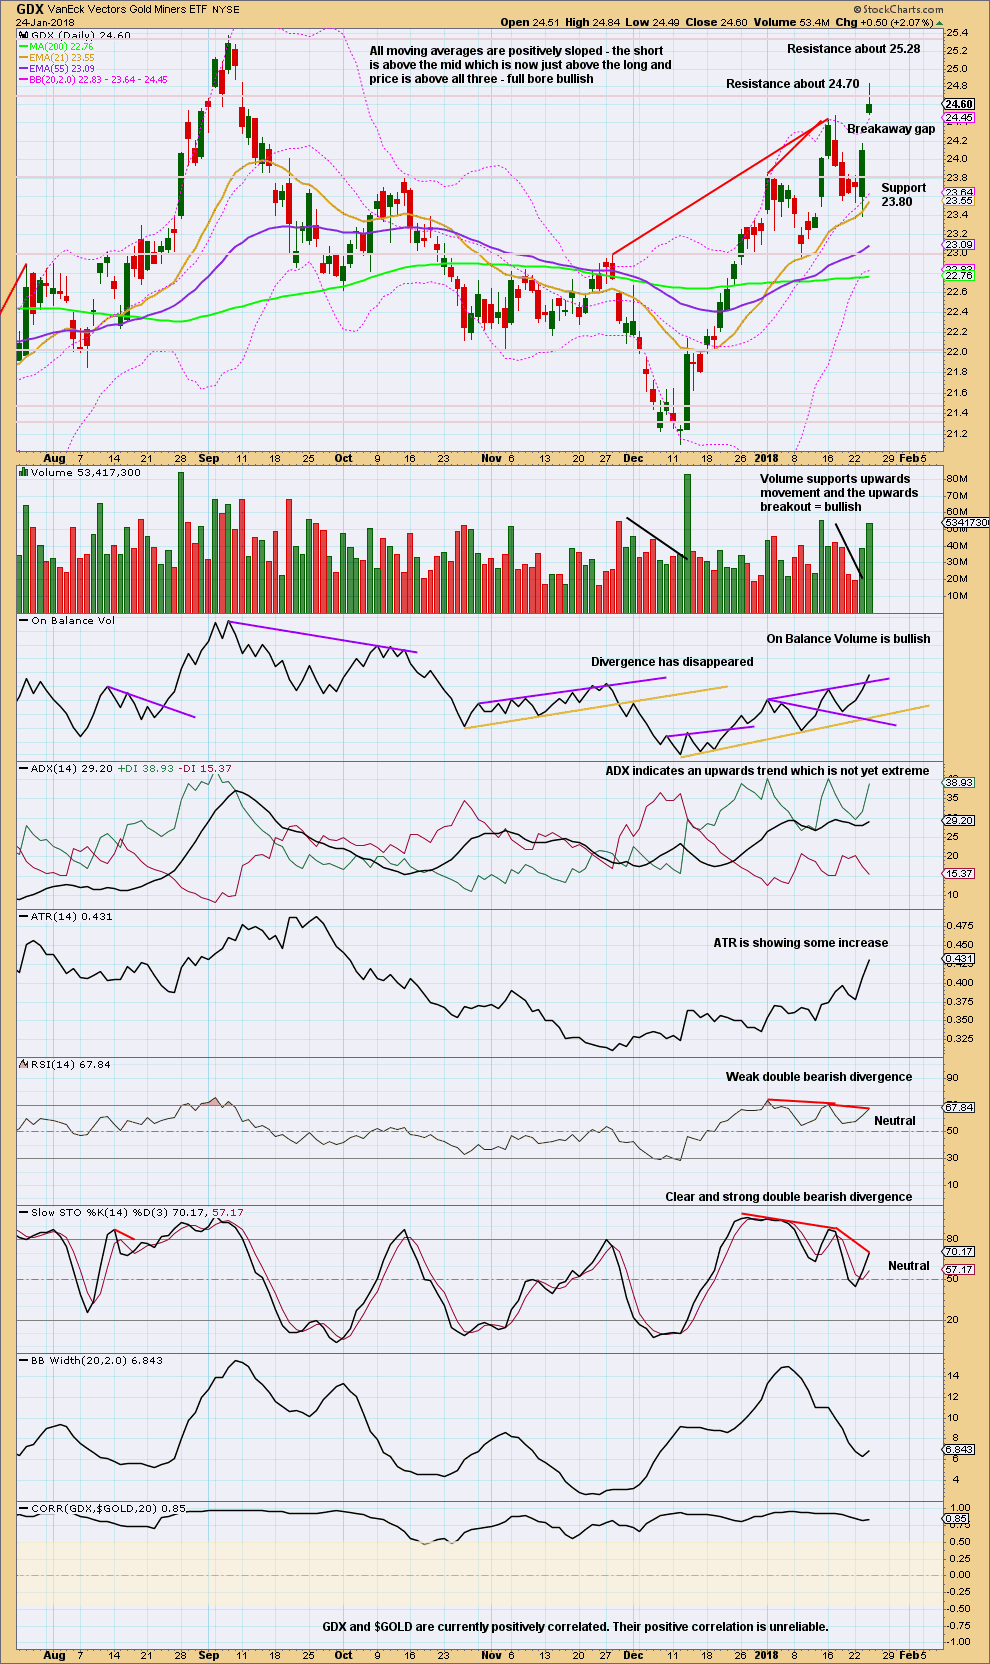
Click chart to enlarge. Chart courtesy of StockCharts.com.
GDX today has broken out above a small consolidation. If this gap is a breakaway gap, then it should offer support; stops may be set just below it. If the gap is closed, then it would be an exhaustion gap and a larger pullback or a trend change would be expected.
The upwards trend is not yet extreme for GDX. However, it is concerning for this trend that Stochastics exhibits clear and strong divergence with price, which indicates reasonable weakness.
A target calculated using the length of the last rise added to the low of today being the upper edge of the gap yields 26.01.
Published @ 08:58 p.m. EST.
Main hourly chart updated:
If minor A and B are complete then minor C should continue upwards. This count expects a long strong extended fifth wave.
Lets see what volume has to say today. If the session closes in NY with lighter volume then I’d expect a high may be in temporarily and the alternate may be correct.
But if volume remains strong then this count may be correct.
This trend is extreme and overstretched, but when Gold has a strong bull run it can remain like this for a few days and price can continue to move strongly. I have a TA chart of the last strong run for Gold from December 2015 upwards which looks at how extreme indicators can get, I’ll add that again today.
The second wave count is now also invalidated. Despite a big triangle having the best fit and best look, a triangle now no longer works. By a simple process of elimination we are left now with only a very bullish wave count.
Lara. Is it possible to see all the movement of Minor C as being down one degree, that is, we are now only finishing Minute 1? So, Minute 1 on the graph is actually Minuette 1 etc. In this way, we don’t need to see a very extended fifth wave.
Yes, that’s certainly another valid idea.
My Two Pence worth – I think gold is in the final throws of an E wave up and is set for a fall.
I think the USD index is in a final fifth of an C wave down and then will reverse.
Even though USD index may reverse, CNY may find the top and CNY may start to fall vs USD, then the CNY fall may support the next gold’s up on the other way around.
I think Gold price may still frustrate for a little bit longer time before it completely exit the big triangle
Except that does not fit EW rules for triangles. What would be wave E of a big triangle is now beyond the end of wave C.
Wave C would be at 1,357.09. Wave E may not move beyond the end of wave C, not even by the tiniest fraction. It’s now well above that point.
Even the barrier triangle for an X wave is invalid now. The B-D trend line now has a positive slope, enough to say it no longer looks flat.
I simply can no longer see an EW triangle in this huge sideways chop that meets all EW rules.
BUT
if it’s a pullback or consolidation you’re expecting here to relieve extreme overbought conditions before price can then continue on upward, look to the new alternate which I’m putting up again here.
and I’ll add again that any assumption that Gold and USD are negatively correlated is on shaky ground
the math shows that correlation is unreliable
I’m at a bit of a loss as to why members keep expecting there to be a relationship when the math shows it absolutely does not always exist?
and I just don’t know how else to try and explain it….
Hi Lara. It is true that when you use the correlation feature on stockcharts, it will show certain periods of time when they are not negatively correlated. However, it may not describe the bigger picture. And although there may be certain periods where they are not, there are indeed long periods when they are negatively correlated. In addition to the correlation indicator, you can use stockcharts to also plot the price of USD behind the price of GOLD. Doing that, while it’s not a day to day correlation, you can see that a lot of the time there is a general negative correlation. I think it’s fair to say that while it is not perfect, it is more of a rule rather than an exception.
From a fundamental standpoint, it’s possible to explain by noting that sometimes the dollar rises against other currencies and makes gold less attractive. But other times, it may rise at a time that all currencies are unattractive relative to gold, and at those times they may be positively correlated. I don’t’ think the latter is happening at the moment
i’m attempting to post a chart of what i am describe hope it works
The bigger picture at the monthly chart level is these two markets are very often not correlated. And it’s not just occasionally, its very often.
While they are currently negatively correlated and that relationship certainly may continue, it also may not. And we have no idea when the correlation will weaken or break down entirely.
And so I cannot base my analysis of Gold on what members think USD is doing, or what my analysis of USD expects it to do.
I would prefer to use simple math rather than do a visual overlay of two price charts, because that is more subjective. The correlation co-efficient is objective.
I guess we shall have to leave it at that and agree to disagree.
Yeah , Lara, I understand the USD index does not hold the correlation in math, with very low possibility correlation, however, the gold price did affected by the currency moves, the countries currency battle moves, bond prices moves from times to times the market moves and people’s wills are vary, that makes in different duration, the Gold/usd may have positive correlation or negative to USd index, sometimes Gold may positive correlation to USD/CNY but sometimes not, in long term it has no correlation in math I know, but the country acts, especially on the currency, they have a more powerful momentum to affect the market, country must have a band width to let the its currency frustrate, and mostly when tbe currency comes to the critical boundary, the Gold price may comes to a invalidation point at the same time. So at that time I would consider to take into account at that moment on certain correlated uncertainties, not all the time but in very moment likes important resistance level. As at different stage, markets and countries will adpot diffferent action, that is why making Gold price not have a positive correlation in math, your members must know about this, but as gold is somehow looks as a kind of currency as well, it must affect by currency battle, bond battle from time to time.
It is not plainly strict not correlation in math, that is why we use the EW to interpret the market moves, the peoples moves, because EW is the only tools could intrepret the market price at what stage to cohere with to the reality world market.
Thanks Lara.
It is good enough for me already to know gold price breaks another invalidation point 1357, I understand it is not EW triangle anymore, I think it may have a pullback before the price blowoff, I just feels that prices often bouncing vigoursly at the acute angle of triangle before it blwoff.
I know you being as a host, every words should be precise, concrete, correct with solid ground, as to responsible yo your members.
Please excuse us sometimes share some irresponsible thoughts in this forum, I know you want to maintain inside this forum the information are precise.
I think you are right. Huge capitulation volume on UUP today and although USD and GOLD are not ALWAYS correlated, we could be witnessing a turning point in both.
At CMP 1358ish Gold price is coasting (ambling) above the upper band whilst 1356-53 appears to be holding. Given the bullish momentum and MACD in bullish territory, rising ADX etc., won’t be surprised for move up later today targeting 1368-1377 price zone. Lets see.
I declare today a day of celebration for the bulls!
The Big bearish triangle has been the main count since June of last year and today, it was finally invalidated!
Disclosure: I hate big triangles. Small ones for a few days are great!
Yeah! Me too. The price combate for a long time. Finally invalidate most of the bearish hypothesis.
Spot Silver similarly give the bullish look
Dreamer, just to let you know that I am stealing this image 😀
My! What plump cheeks you have! 🙂
Something’s not right. Gold is setting up for a fall, despite the move up?
The miners! If gold moves a mile, they seem to move an inch. GDX is still below last year’s highs, let alone the highs of 2016.
Gold 430 it is.
Yes, the miners appear somewhat weak. I like to quantify the miner to Gold relationship with this chart.
RSI, MACD, and Volume are showing that the Miners (GDX) are showing some strength vs Gold since December. Yet, miners are not close to their 2016 highs like gold is.
OBV is a huge concern. No support for miners yet. Look at OBV in 2016. Boom!
Why?
1) Maybe the miners will start to play catchup with gold very soon?
2) The 2016 move up in miners was so strong (much more than gold) that it is taking more time to consolidate.
3) Or maybe this helps to confirm that this is not the start of a new bull market in Gold and Miners, but rather a cycle degree B wave as Lara’s counts show?
Time will tell
Looks like it was an exhaustion gap…. 🙂
It’s not just the miners lagging. Silver is also not up to par as golds big move up… these 2 things definitely make this bull run much different than past moves…
If that’s a breakaway gap on GDX today, get ready for a very powerful move up. The gap won’t fill. We should know very soon.
There is a triangle forming in Silver (see weekly chart attached). It has the right look, it meets all the requirements and its wave E may top before the end of this week. Note that the upper Bollinger band sits exactly on the top rail of the triangle. In sideways markets the Bollinger bands have a tendency of containing price swings. Upper BB is now at 17.75, not far from the current level. Needless to say, the implications are bearish…
Lara, you wrote in a previous response to me that “The problem will always remain that zigzags and impulses can look very similar.”
For this reason, I am wondering why there is no alternate count that would consider the move from the 2015 bottom to the 2016 top as a 5-wave impulse. I think we should keep at least some open mind here. What makes you insist on that wave being a three, and deduce everything else from that assumption?
Look at the first wave count. The weekly chart. It’s the very first one in this analysis.
That sees the wave up from December 2015 to June 2016 as a five.
Sorry, I missed that one… It was late and I was functioning at a very low level.
? The new Main count does see that move up as a 5 wave impulse.
It’s also possible that the 2016 top is Cycle 1 (another 5 wave impulse count) instead of Primary A and that we are now in a Primary 1 of Cycle wave 3 up which would be much more bullish than the contracting ending diagonal. Lara will switch this to the main count if it proves itself. I included the chart for that count here. The link to the analysis is at the top of today’s analysis labeled “Another alternate monthly chart”
Thanks Dreamer. Yes, that’s another possibility that sees that upwards wave as a five.
That was my thought too, have this idea in July.