
Upwards movement continued to begin the last session, as the new main wave count expected. Downwards movement so far remains contained within the channel and above the short term invalidation point.
Summary: The target for a third wave to end is at this stage still 1,432. Assume the upwards trend remains intact while price remains within the blue channel on the main daily and hourly charts. An alternate would be invalidated above 1,356.63, which would add confidence to this view.
If price breaks below the lower edge of the channel (which is drawn the same way on all charts), then expect a consolidation or pullback to last a few weeks has begun.
New updates to this analysis are in bold.
Last historic analysis with monthly charts is here. Video is here.
Another alternate monthly chart is here.
Grand SuperCycle analysis is here.
MAIN ELLIOTT WAVE COUNT
WEEKLY CHART
Click chart to enlarge.
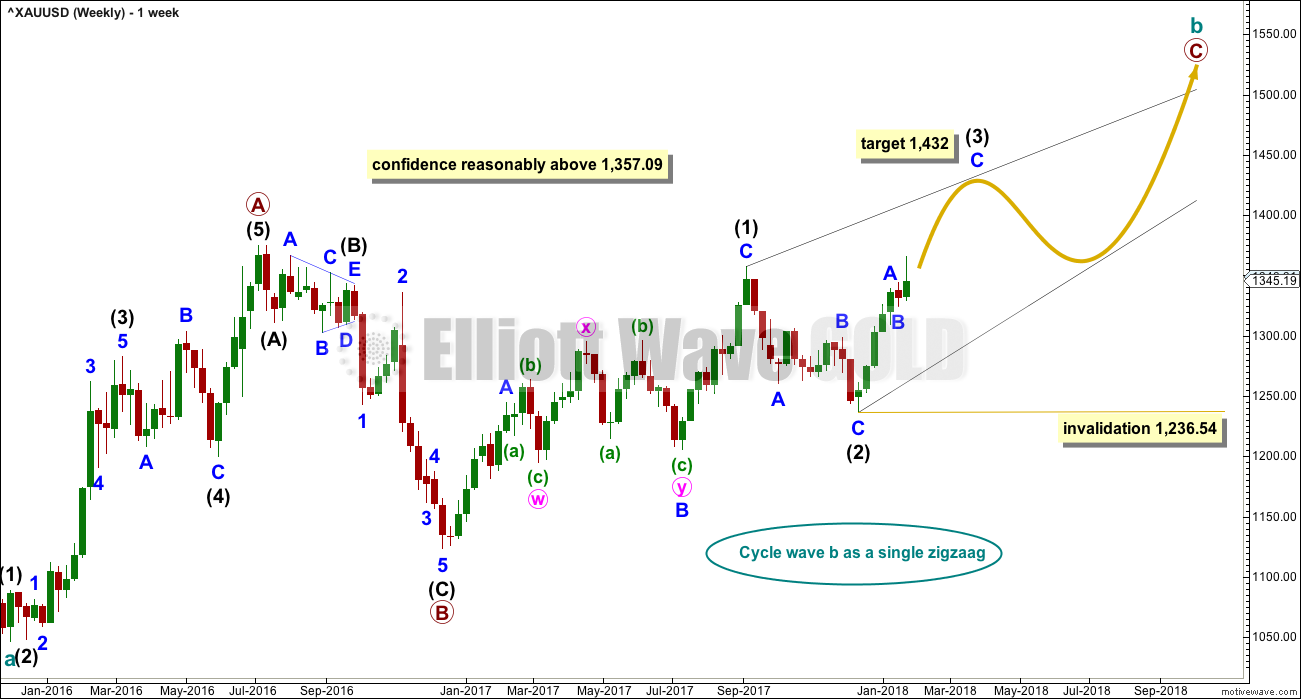
All main wave counts will expect that Gold completed a five wave impulse down to the low labelled cycle wave a in December 2015. An historic alternate wave count looks at the possibility that the downwards wave was a double zigzag (this is linked to above). The weekly charts are the same for both ideas at this time.
Cycle wave b may be a single zigzag. Zigzags subdivide 5-3-5. Primary wave C must subdivide as a five structure and may be either an impulse or an ending diagonal. Overlapping at this stage indicates an ending diagonal.
All sub-waves must subdivide as zigzags within an ending diagonal. Intermediate wave (4) must overlap intermediate wave (1) price territory, and may not move beyond the end of intermediate wave (2) below 1,236.54. The classic pattern equivalent here is a rising wedge.
By a simple process of elimination this is the only remaining wave count today at the weekly chart level.
Attention now turns to the structure of intermediate wave (3), which may only subdivide as a zigzag. Within the zigzag, it would have the most typical look if minor wave B were to last a few weeks.
Within the zigzag of intermediate wave (1), minor wave B lasted 22 weeks, one longer than a Fibonacci 21. Within the zigzag of intermediate wave (2), minor wave B lasted a Fibonacci 8 weeks. Minor wave B within intermediate wave (3) may reasonably be expected to last a Fibonacci 5 or 8 weeks. This would give the zigzag of intermediate wave (3) an obvious three wave look at the weekly chart level.
DAILY CHART
Click chart to enlarge.
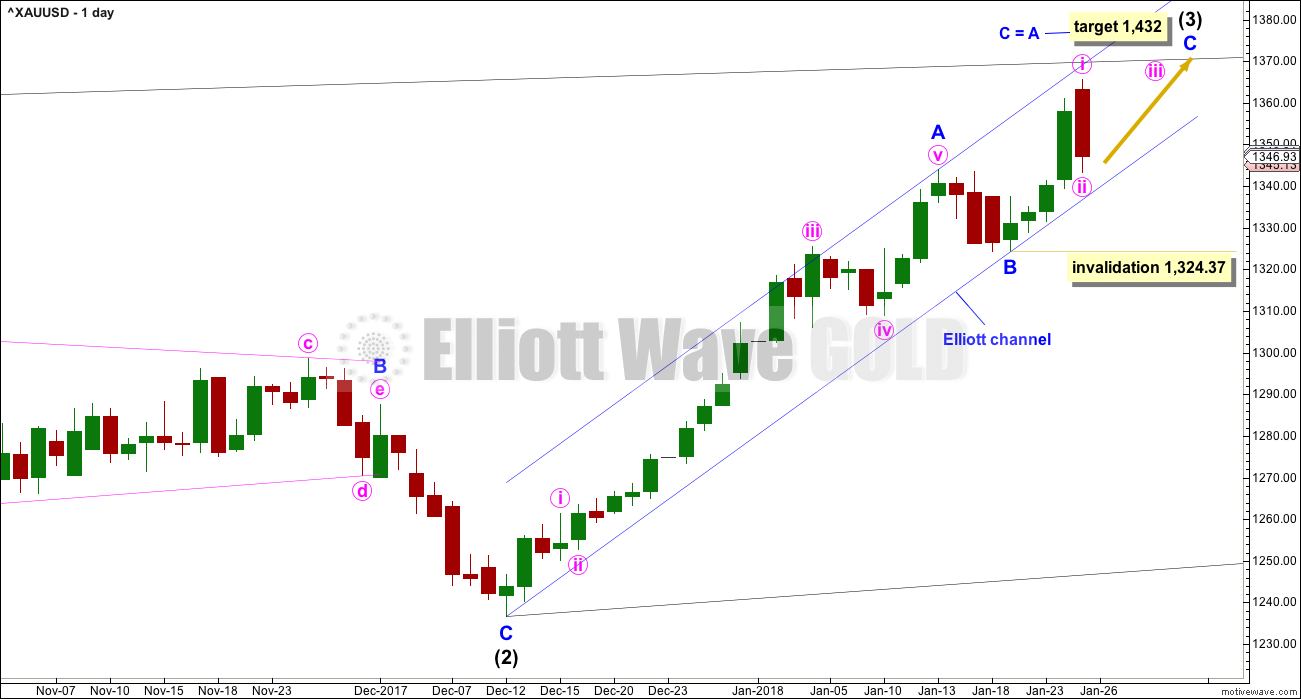
Within the ending diagonal, intermediate wave (3) must sub-divide as a zigzag.
Because we should always assume the trend remains the same until proven otherwise, it would be safest at this time to assume the upwards trend remains intact while price remains within the blue channel. This is still the main wave count today for this reason.
Within the zigzag, minor waves A and B may be over already and minor wave C upwards may have begun. The target assumes the most common Fibonacci ratio between minor waves A and C.
Minor wave C must subdivide as a five wave structure, either an impulse or an ending diagonal. It would most likely be an impulse.
Within minor wave C, minute wave ii may not move beyond the start of minute wave i below 1,324.37.
HOURLY CHART
Click chart to enlarge.
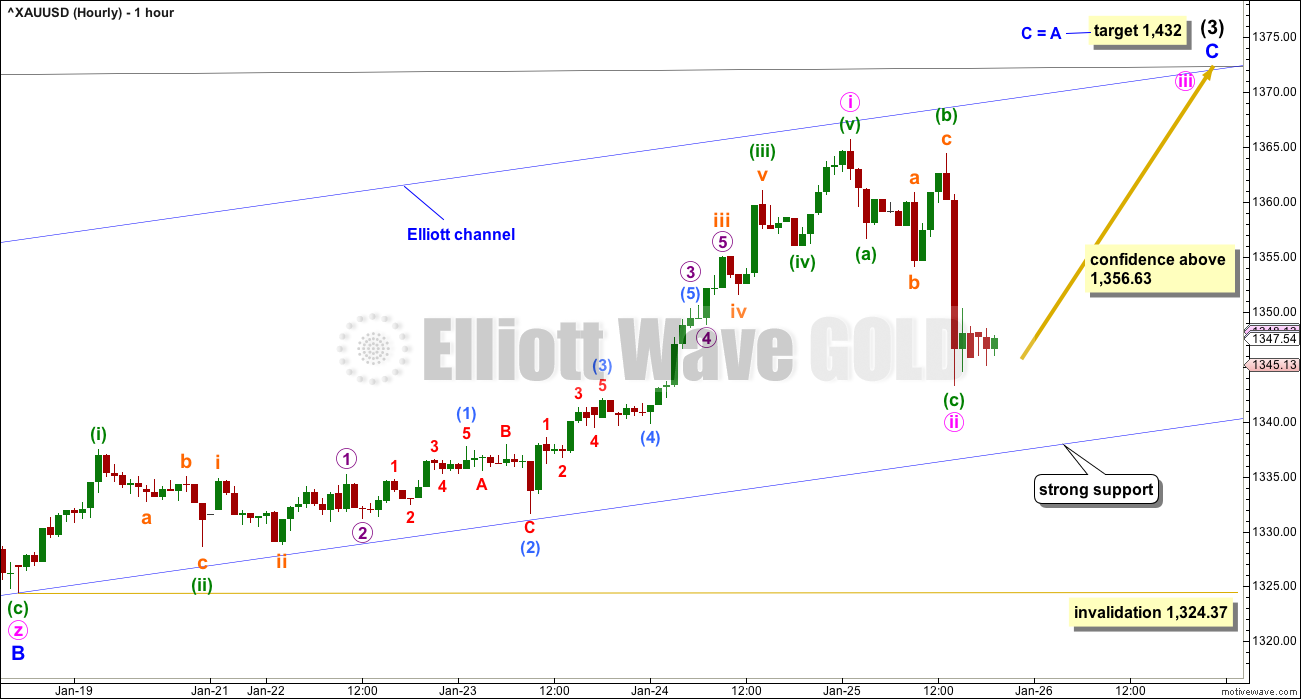
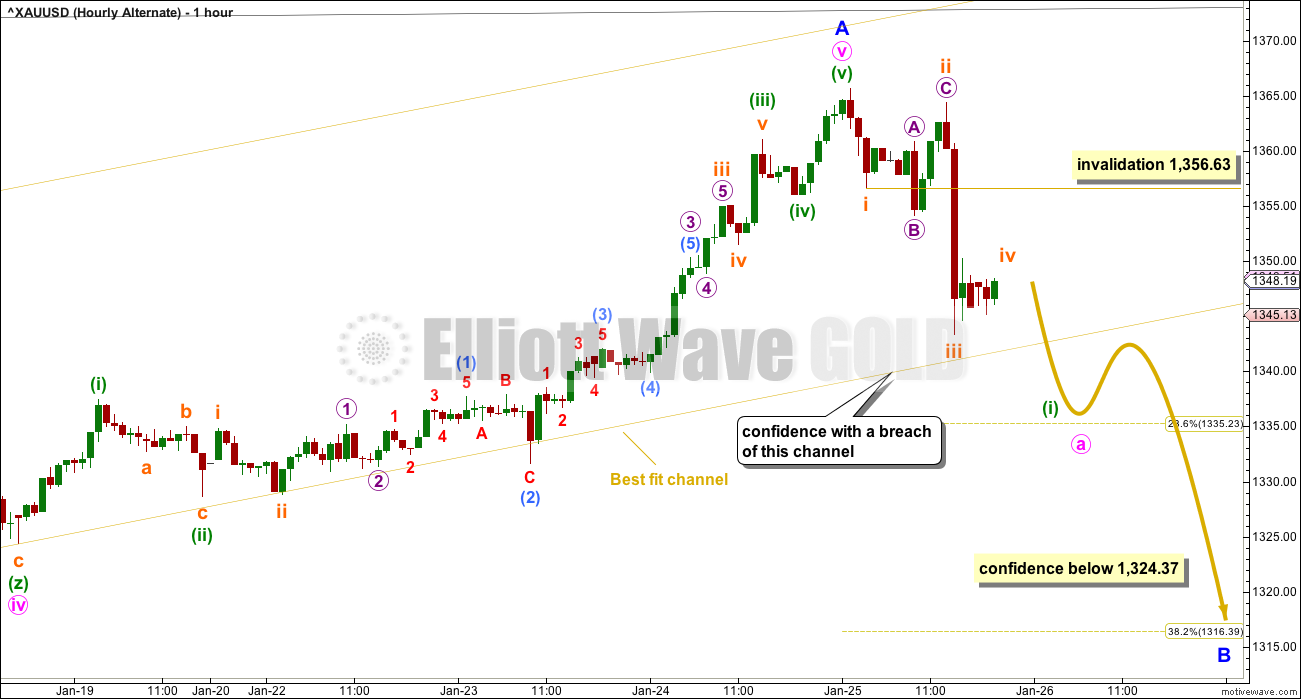
This analysis is changed slightly to see only minute wave i within minor wave C over at the last high. This fits better with the target calculated for minor wave C to end.
Minute wave ii may not move beyond the start of minute wave i below 1,324.37. However, prior to invalidation this wave count would substantially reduce in probability if price were to break below the lower edge of the blue channel.
If minor waves A and B are already both complete, then minor wave C should continue to find support at the lower edge of the Elliott channel. It may overshoot the upper edge, but it may not move below the channel.
ALTERNATE DAILY CHART
Click chart to enlarge.
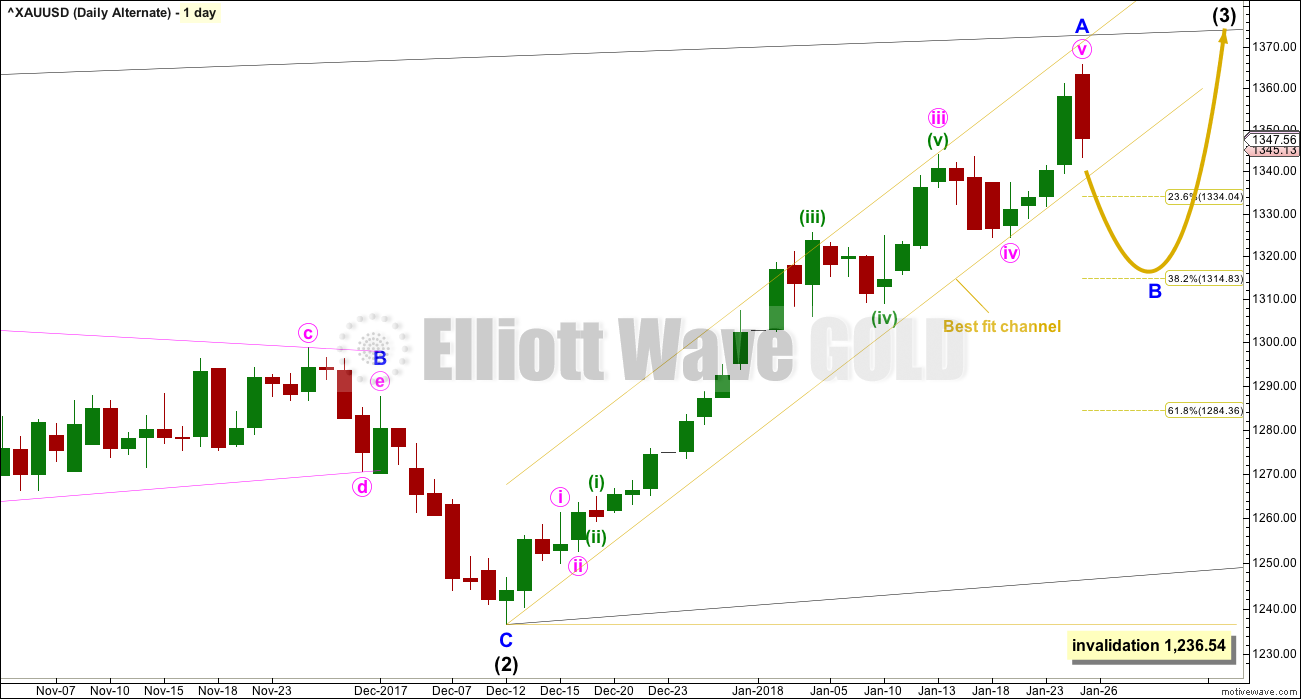
It is also possible that only minor wave A has just completed at today’s high. A breach of the yellow best fit channel (which is drawn the same on all daily charts) would see this alternate daily chart become the only daily chart.
Minor wave B may be a reasonably time consuming consolidation or a quicker sharper pullback within the upwards trend, and it may end about either of the 0.382 or 0.618 Fibonacci ratios (neither may be favoured).
Minor wave B may not move beyond the start of minor wave A below 1,236.54.
ALTERNATE HOURLY CHART
Click chart to enlarge.
If minor wave B has begun, and if it is to last a few weeks, then it should begin with a clear five down at the hourly chart level. That would be incomplete so far.
Within the first five down, here labelled at minuette degree, the correction for subminuette wave iv may not move into subminuette wave i price territory above 1,356.63.
If this alternate is correct, then subminuette wave v downwards should bring price below the lower edge of the yellow channel. That would add confidence to this alternate wave count. A new low below 1,324.37 would add substantial confidence and invalidate the main wave count.
TECHNICAL ANALYSIS
WEEKLY CHART
Click chart to enlarge. Chart courtesy of StockCharts.com.
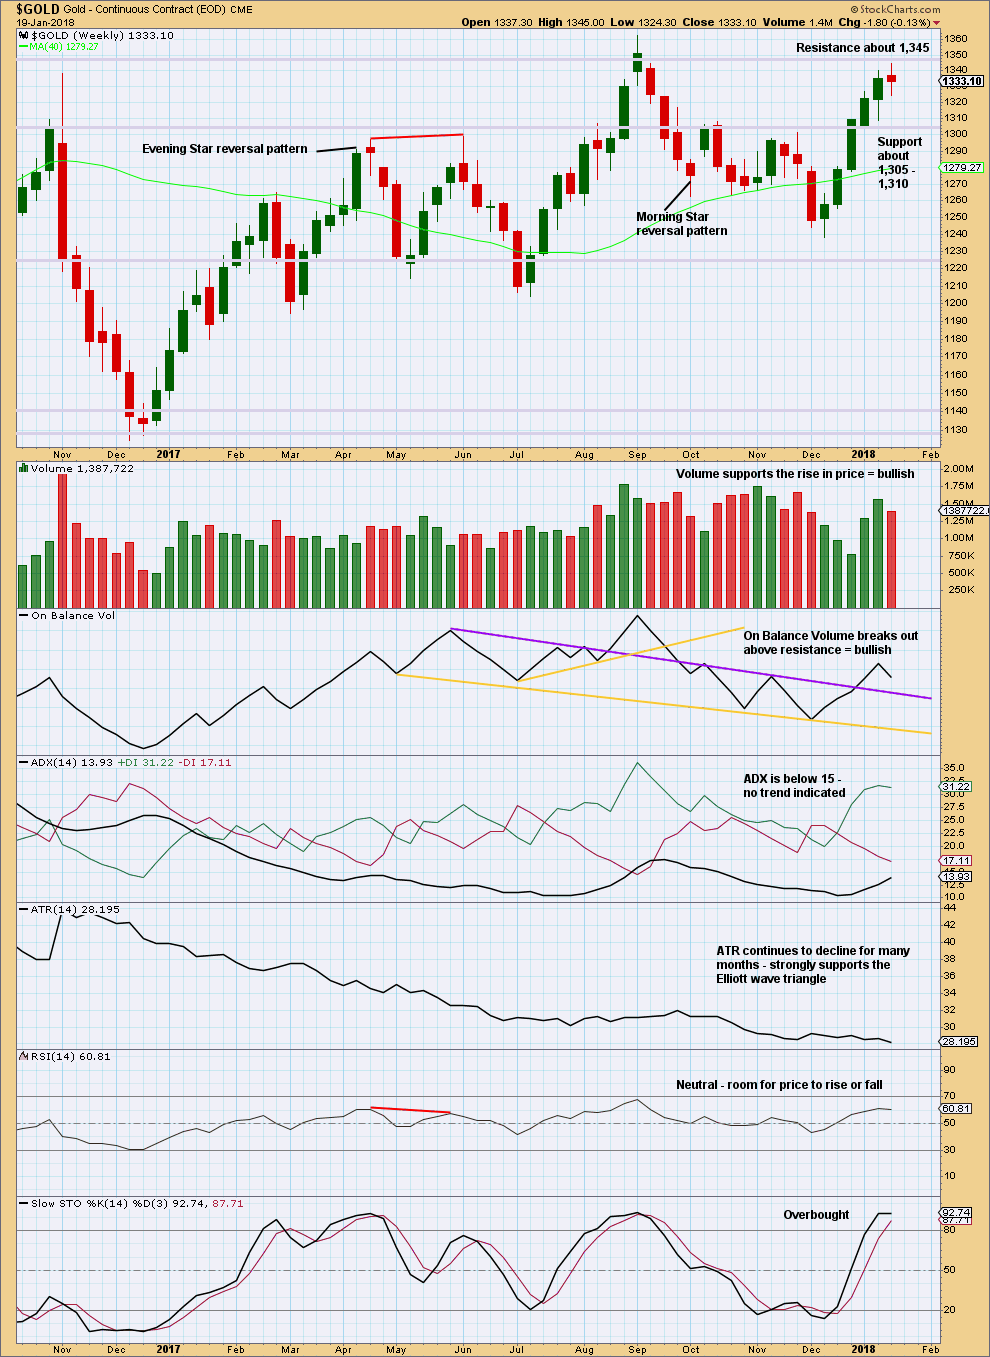
Price found resistance last week, at about 1,345.
The small spinning top candlestick and decline in volume suggest a pause within an upwards trend, or a weak end to the upwards trend.
Stochastics may move further into overbought territory before price turns.
DAILY CHART
Click chart to enlarge. Chart courtesy of StockCharts.com.
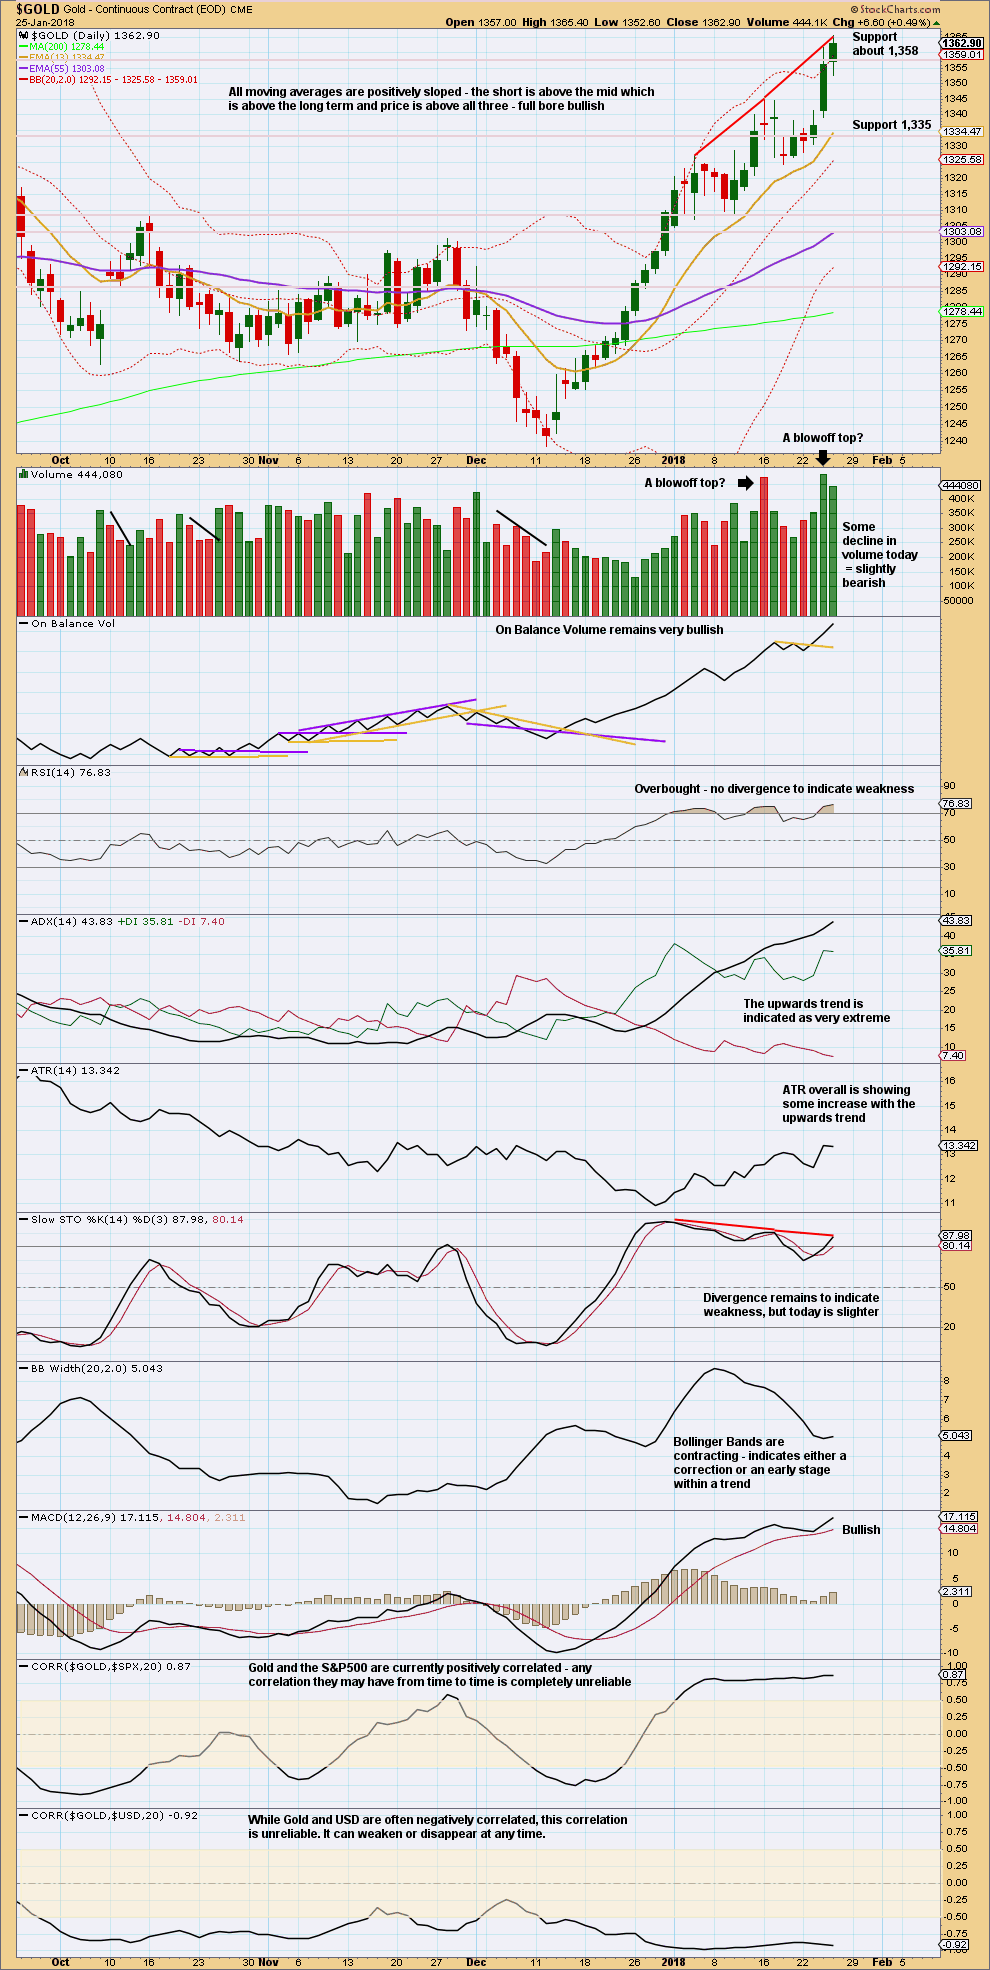
This upwards trend is extreme, but that may continue for several days and price may move strongly higher before the trend ends or enters a reasonable consolidation. Overbought conditions may persist for a reasonable time when Gold has a strong bullish trend.
At this stage, there is still not enough weakness to indicate a consolidation or pullback should begin about here. That does not mean it cannot happen, only that weakness does not indicate it.
DAILY CHART – EXAMPLE OF A STRONG BULLISH TREND
Click chart to enlarge. Chart courtesy of StockCharts.com.
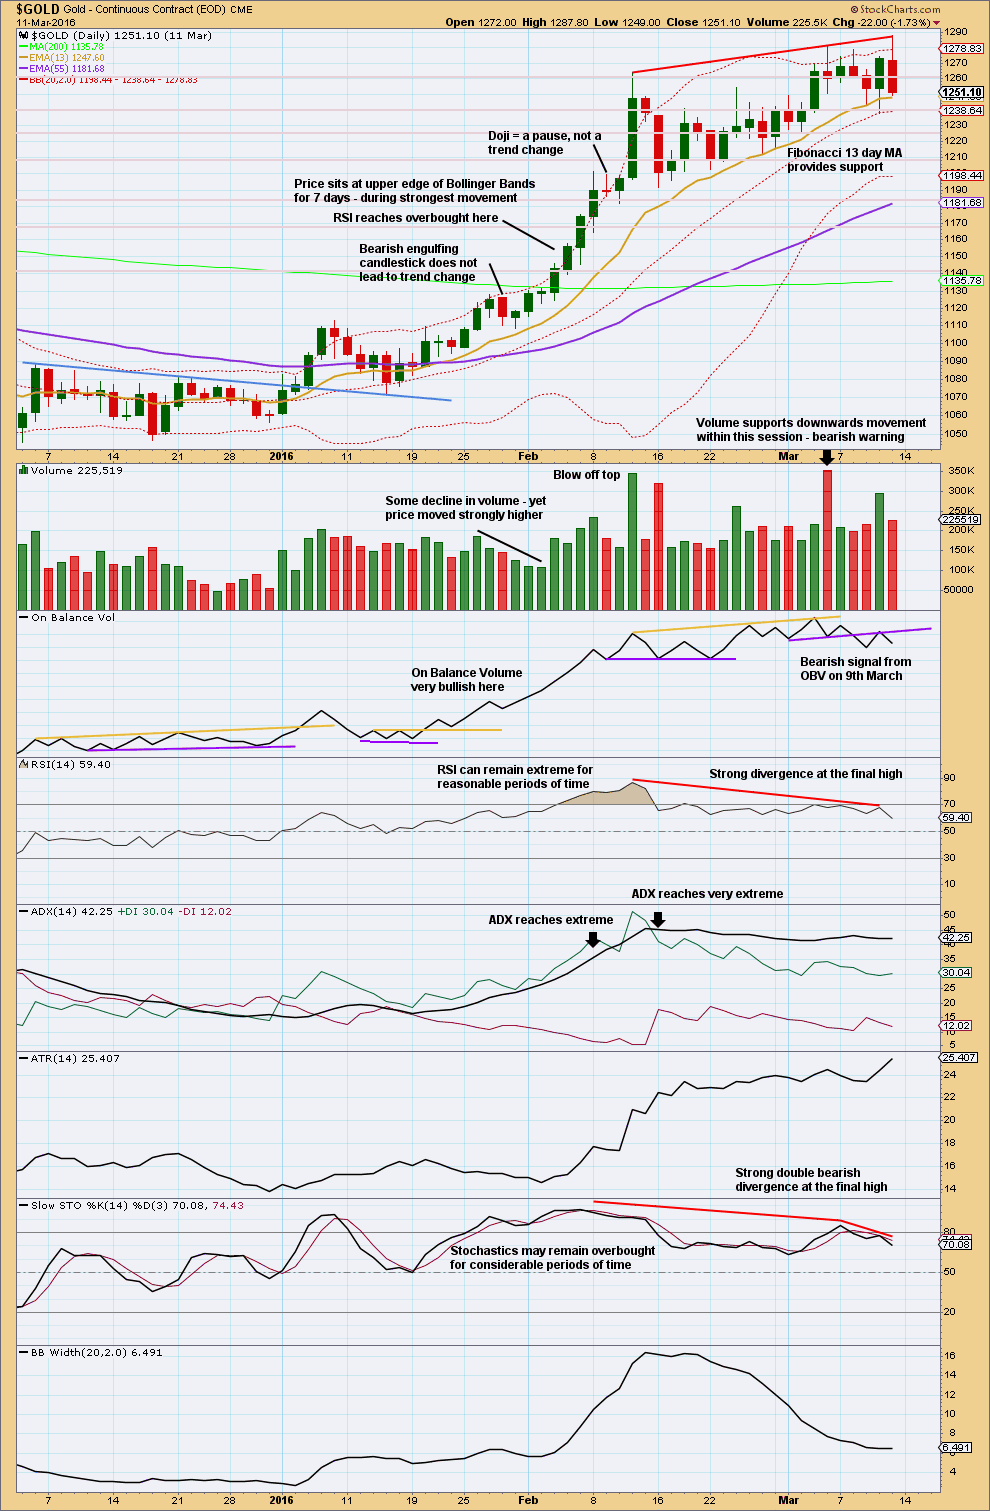
This chart is provided to illustrate how indicators used may behave when Gold has a strong bullish trend.
The strongest portion of the trend saw seven green daily candlesticks in a row; this may have been the middle of a third wave. The trend does not end until some volatility returns in the form of corrections.
Indicators may remain at extreme overbought levels for a reasonable period of time. The trend only ended when they exhibited strong divergence with price.
On Balance Volume was an excellent indicator to offer a bearish signal on the last day of the trend.
Please do not interpret this analysis to mean that the current bullish trend must look the same. It will not. This analysis is added only to illustrate how extreme a bullish trend in Gold may be.
GDX DAILY CHART
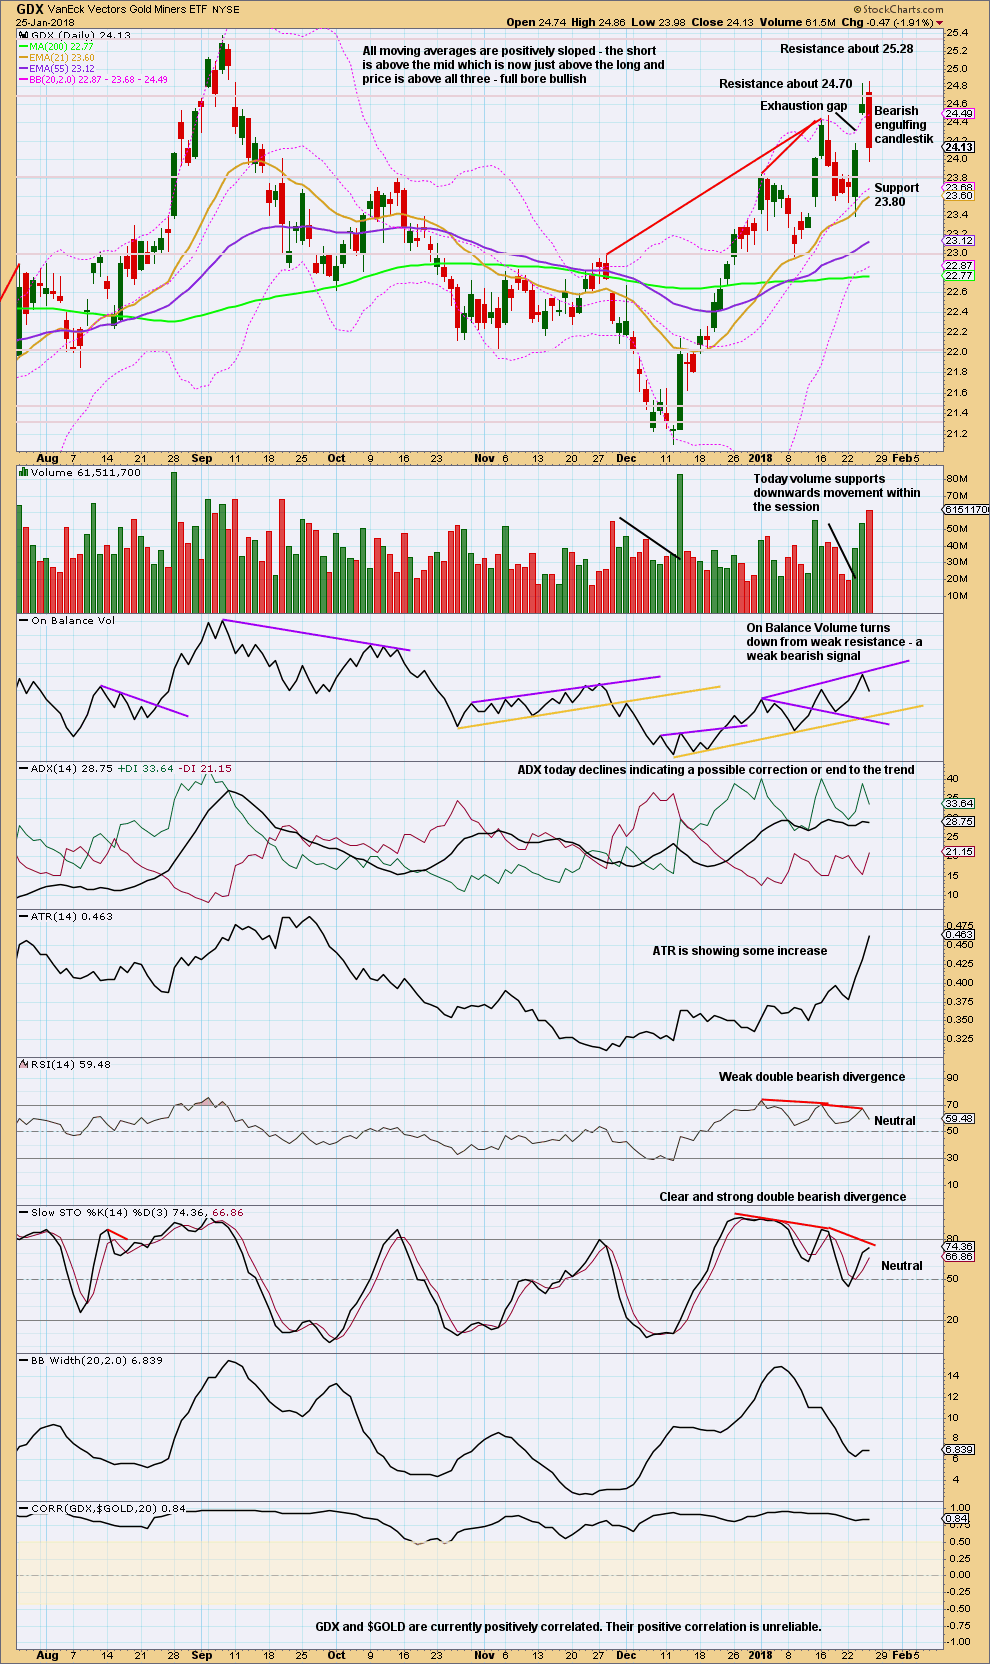
Click chart to enlarge. Chart courtesy of StockCharts.com.
The strong bearish engulfing candlestick today must change the analysis of GDX from bullish to neutral or bearish.
Published @ 08:44 p.m. EST.
Thank you Lara.
I love tranquil and peace.
Thank you kindly.
You’re welcome.
However, I’m not going to be doing that again. It’s taken almost all weekend to do just Gold. The video is almost 40 minutes, its too big and unwieldy for members IMO.
In all fairness, you should not be expected to either.
Going forward, maybe new members would watch this to realize the thought process behind each of your wave counts.
Thank you kindly.
It took all day yesterday for me to do the Gold analysis. That’s the longest ever! And that’s not including the video.
This is the reason for your analysis being published later this weekend, because it turned out I didn’t do my volunteer work for Kiwi yesterday.
Will record the video now and your analysis should be published within a couple of hours or so. Thank you all for your patience.
And be prepared for a massively long and complicated analysis. I’m aiming to make it understandable and as simple as can be.
Thank you very much, Lara.😃
Masterpiece? Would absolutely love to see the process behind deciphering the long term outlook.
Thank you kindly.
I did record the bit where I looked for alternate wave counts. That’ll be uploaded and published shortly too as an extra. Because a couple of people said they’d find it useful.
I’ll be redoing monthly charts for Gold this week.
The main monthly chart which saw cycle wave b as a triangle has been invalidated with the new high this week above 1,357.09.
So cycle wave b cannot be a complete regular contracting EW triangle.
I’ll be spending some time today looking for a more bearish wave count for Gold. Would members like me to video that thinking process? I’ll be starting with a blank monthly chart for Gold.
Yes please Lara- that would be very informative.
That would really be wonderful Lara, please and thank you.
Updated main hourly wave count:
If this main count is correct then minor wave B was rather brief. I still have a problem with that, it doesn’t look right on the weekly chart. Both of the minor B waves in the last two zigzags lasted several weeks.
Anyway, the bottom line remains that Gold is still within the channel, there is still an upwards trend and it is continuing. Assume the upwards trend remains at least for the short term while price is in the channel. Expect support at the lower trend line until price breaks below that support line, then it may provide resistance.
Updated alternate hourly wave count:
The very slight new high above 1,356.63 cannot be a fourth wave of an unfolding impulse down, because it has overlapped back into first wave price territory. That tells us that the last wave down is now most likely to be a three and most likely to be complete.
Upwards movement from the last small swing low labelled now minuette (a) looks like a five. If that’s correct, then a new impulse or zigzag upwards should continue to move price higher.
It is still possible that minor wave B has begun at the January 25th high. It may be a flat, combination or triangle. The first wave within those structures needs to be a three, it is labelled minute wave a. This may be a flat correction.
Annapanna
You wrote: “The currency charts, including, but not limited to, USDJPY or NZDUSD, and UUP are all screaming an imminent dollar rally.”
Not on my currency charts!!!!!!
USD may correct slightly up after such a huge fall before starting long term down tend.
Try this site for chartology of markets. You will get a different picture on charts.
https://goldtadise.com/?p=422292
Dollar going down and gold bullish currencies going higher.
Lara’s current EW count confirms that gold is in bullish trend.
Lara’s EW counts are based on EW rules and guidelines other no other reasonining influences her to change the EW probability. Thats what I like.
USD going down and gold going higher may be true but it is not a perfact relationship.
Look at the chart below: USD to Gold from 1970 to 2016. Even though in 1976 to 1985 USD was in up trend gold managed to make biggest rally of its time which is not even matched today. Gold price went from 100 to $800 in 1980.
If you had traded gold short while USD was in uptrend god help any one who did it????
At the bottom of 1976 EW projected gold’s bull market while completing flat and USD was in uptrend.
Read “Elliott Wave Principle” by Frost and Prechter page 178 to 179.
I am here to for Lara’s excellent analysis which no one can provide out there.
The chart from Fully on Goldtent.
Papudi, I do not really understand your point. The USD chart that you are referring to from Goldtent is more than one year old (Jan 6 2017) and if you compare it with the current stand of the Dollar Index chart you can see how wrong their prediction was. During last year the dollar did nothing but drop and Gold went up. This supports the theory of existing negative correlation.
I always have the EW Principle on my desk. In fact, I own and have read all books Prechter has written so far, most of them several times. I can read nothing in the referred pages that would contradict my theory. The second half of the seventies was an inflationary period, with the USD losing purchasing power, which in turn resulted in Gold’s rise to 850 in 1980. That, again, supports my opinion.
I recommend that you read my previous comment about Rambus Chartology. I have been their subscribers for years and I have been following (on paper) their trading records in PM complex instruments including, GLD, SLV, DUST, NUGT, JDST, JNUG, DSLV, DGLD, etc. etc. Rambus, Sir Fullgoldcrown, Plunger et al, the same guys that are apparently behind Goldtadise as well are full of BS, and the chartology theory simply does not work. Believe me, you do not want to follow them. If you enjoy losing money, for not so cheap thrills go to casino instead. They are very good writers, though, so you can read their publications for entertaining purposes.
EW can be a great trading tool, but not as a stand-alone one, rather in the context of other TA such as trendlines, support&resistance, candlestick analysis, intermarket analysis, etc. If you rely solely on the EWP, you may expose yourself to the risk of not being able to see the forest for the trees.
I have the impression that you are trying to defend Lara. There is no need, because I am not attacking her. I very much respect her work, that is why I subscribed to her service in the first place: in order to get more input from yet another perspective, to improve my own success rate in trading. I am merely presenting different ideas and apply constructive criticism if I disagree with her analysis. As you could see so far, I always support my comments and my ideas with visual presentation (charts) and well-articulated, detailed arguments based on available facts and my own experience. Unless Lara wants to build a cult-like following of blind and obedient subscribers, my contributions should be welcome as they are intended to improve the knowledge base of everybody involved here.
“Unless Lara wants to build a cult-like following of blind and obedient subscribers, my contributions should be welcome”
This is unnecessarily rude to Papudi.
this is not a cult and I am always open to new ideas.
It is better taken though when ideas are presented simply as ideas, and not as instructions for how I should conduct my analysis.
You seem to be very certain of the next direction in price for Gold. You may be right and I may be wrong. But I have learned the hard way over the years that a high level of confidence in market direction will often be shown to be wrong.
Neither of us know. We can only base our analysis on probability. Not certainty.
It does looks like UUP has put in at the very least an interim bottom with that hammer yesterday. A break-away gap in the next few sessions would greatly increase the odds.
Lara, may I ask why you are not considering the idea of wave B within Super Cycle b being a flat? You have so far considered the triangle or the zigzag as a possible pattern for the pending correction, why not exploring the possibility of a flat? Especially considering that based on today’s analysis you already have scrapped the triangle idea entirely, with only the zigzag remaining. I thought that it is important always having an alternate. I am aware that there is an alternate count on the daily level, but both are part of the same bigger pattern, therefore are not real alternates.
If we assume that the first wave from the 2015 low to the 2016 top (wave A) was a five, then the price action so far fits as a regular flat for wave B. If we assume that wave A was a three, then it may fit as an expanded flat. Either way, now a very sharp and extended C downwave should be imminent, more precisely, already underway. The dollar appears having been bottomed in an expanded flat C wave as I suggested yesterday, therefore a 5-wave impulse fifth should follow. While you disagree with the negative correlation between Gold and USD on the basis of historically available long-term market data, in the present environment the negative correlation undeniably does exist and IMHO not giving it a proper weighting would be foolish.
I have already posted the regular flat idea and the UUP dollar bottoming charts in previous comments, respectively. In order to avoid superfluous repetition, now I am attaching to this one the expanded flat chart only.
At this stage the idea actually would not diverge from either of the wave counts published today. I try to keep charts to a minimum to keep the analysis more understandable.
Your comment seems to be confusing the idea of a flat correction with the degrees. Are you referring to the idea of cycle wave b in its entirety as a flat?
Or only primary wave B within it a flat?
The short term issue, and the reason why there is no divergence at this stage, is intermediate (B) would very likely be incomplete. It fits as a double zigzag. The second zigzag is incomplete and should continue higher, along the way it may have a time consuming minute wave b.
As you can see this is pretty much the same situation for the wave counts published in this analysis.
A zigzag upwards is incomplete.
And so the idea does not add anything to the analysis in terms of invalidation points, confidence points, trend channels… the whole lot.
I keep several ideas charted. When they diverge then I publish them, if they still fit.
In the regular flat idea I posted previously only wave B is a flat, while cycle wave b itself is a zigzag, since the flat is a 3-3-5 structure and if we assume that wave A from the 2015 bottom was a five, then cycle wave b can only be a zigzag.
However, as you are correctly observing, in the expanded flat idea both wave B and cycle wave b are expanded flats. According to other indicators the downwave, if we get one, should last about 6-8 months. The leg C of the flat, however, is expected to be swift and strong, without much grinding. For such a wave and for a regular flat with limited magnitude (ending somewhere between 1050 and 1120) such a timeframe is simply too long, therefore wave C should drop much further, and make a new low somewhere between 800 and 900 in XAUUSD.
I respectfully disagree with you developing alternate counts other than the ones that you are eventually publishing, but withholding them. It is reassuring that you also see the flat as a viable alternative to either the current zigzag count, or the previous, but in the meantime negated triangle. I see the flat as the most likely outcome, and if I am right, then you are putting forward to your members a count with a lower probability as your main one.
With regards to the statement that my ideas do not add anything to the analysis in terms of invalidation points, confidence points, trend channels, etc., thereby implying that my ideas have no value, with all due respect, I think that I leave elaborating those details to you. I do not claim to be either an analyst or an EW expert. I have been trading the markets for more than 10 years and EW is one of my analytical tools, but by far not the only one. I will probably never know about EW as much as you do, therefore I do not even attempt suggesting anything in terms of those details. I do think, however, that it is my moral obligation to be involved and keep you and the members here on the right side of the market. The currency charts, including, but not limited to, USDJPY or NZDUSD, and UUP are all screaming an imminent dollar rally. Even if the negative correlation between the dollar and Gold is as weak as you claim to be, it is still a huge headwind for gold. I think that Gold’s future and with that the EW predictions should be reassessed in the light of the big picture, by accepting the reality of a strengthening dollar. The triangle concept would have aligned nicely with such a big picture, but not the zigzag concept or Gold going to the moon. The only viable scenario we left with is the flat, the expanded one being the more likely.
To me,the Grand Supercycle chart give me a lots of info.
Supercycle (a) ended at Jan 2016 in w_x_y .
So the Supercycle (b) very possibly running in flat
Supercycle abc in 335, then Supercycle (b) very likely up to 2000 USD
Supercycle (b) also running in abc in cycle grade. It is up to us to interpret cycle a as 3 or impluse 5, then it affects the follow cycle b pattern.
So mostly Lara simply saying Wave A running abc, if wave A running in 5 later wards, Lara will update,it further. No matter cycle wave a 5 or 3, it is up, lets the wave tell us what is it looks like, we can easily draw the channel and calculated our target upon our view
That is what I am understand from here, I may be wrong, but I just use this style to communicate in this forums.
Lara, I agree with Annapanna right your monthly chart are still interpret it as inside supercycle a running, we are in cycle b of supercycle (a), then we are still target to run down to cycle c to 400 something.
And cycle b (up)of supercycle a is much different to in cycle a of supercycle b. You may need to clarify what is your opinions on your present briefings. Those monthly chart, weekly chart seems not coherent to SuperGrand chart you posted. Please correct me if I am wrong.
Annapanna has not offered one single viable EW alternative.
She is telling me that is my job, to conjure up EW counts as she demands.
That is not acceptable to me.
The main monthly chart is invalidated now that the triangle for cycle b is invalid.
But the problem for the EW analysis remains right now that I am not able to see a complete structure for cycle wave b. Which means it may be expected to move either up or sideways before it is done.
The end of week video will again go over monthly charts.
You seem to be telling me that I must accept which direction you expect the market to go, and conjure up an EW count for Gold that will see it move in that direction.
I have not stated that the correlation between Gold and USD is weak. They are currently strongly negatively correlated. I have stated the correlation is unreliable. The difference is important. I am very careful with the words I choose in market analysis.
This statement:
“I do think, however, that it is my moral obligation to be involved and keep you and the members here on the right side of the market.”
is completely unacceptable. It is presumptuous. It assumes you know better than I what direction the market will take. And you’re telling me I need to adjust my analysis to agree with you.
This membership is not for you. I will ask Cesar to refund your last membership payment and cancel your membership.
Thank you Lara. That was getting ridiculous!
When I’m hesitant to open up comments and dread what I may see…. then yes, that person will be removed.
Because that’s now how I want to begin my working day.
I’m serious about my comments guidelines. It’s about an exceptionally polite and respectful tone.