
More downwards movement for the short term was expected to a target at 1,333. Price moved lower to reach 1,334.53 before bouncing higher.
Summary: A consolidation looks likely to have begun, and it may be as time consuming as a Fibonacci 13 or even 21 weeks. It is also possible it may be a quicker sharper pullback. When it is complete, the upwards trend may resume.
A new low below 1,236.54 would indicate Gold remains within a huge bear market. At that stage, new lows would be expected below 1,046.27.
New updates to this analysis are in bold.
Grand SuperCycle analysis is here.
Last in-depth historic analysis with monthly and several weekly charts is here, video is here.
There are multiple wave counts at this time at the weekly and monthly chart levels. In order to make this analysis manageable and accessible only two will be published on a daily basis, one bullish and one bearish. This does not mean the other possibilities may not be correct, only that publication of them all each day is too much to digest. At this stage, they do not diverge from the two possibilities below.
BULLISH ELLIOTT WAVE COUNT
FIRST WEEKLY CHART
Click chart to enlarge.
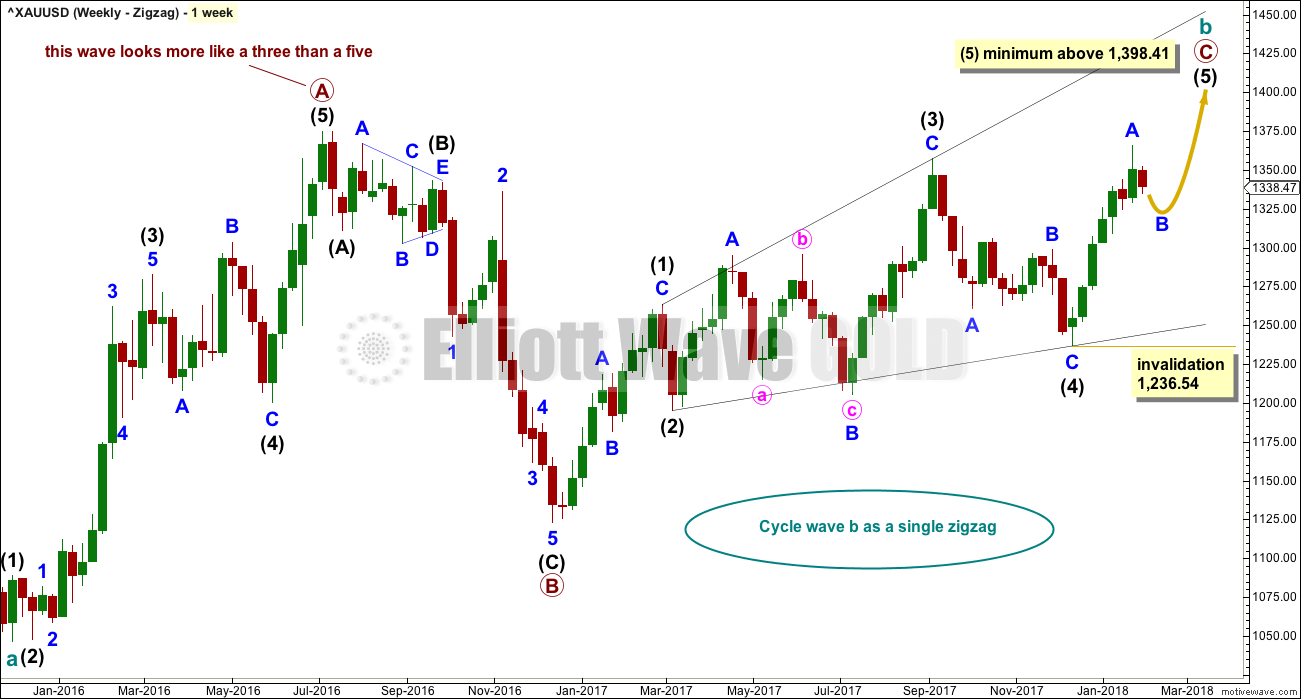
Cycle wave b may be a single zigzag. Zigzags subdivide 5-3-5. Primary wave C must subdivide as a five structure and may be either an impulse or an ending diagonal. Overlapping at this stage indicates an ending diagonal.
Within an ending diagonal, all sub-waves must subdivide as zigzags. Intermediate wave (4) must overlap into intermediate wave (1) price territory. This diagonal is expanding: intermediate wave (3) is longer than intermediate wave (1) and intermediate wave (4) is longer than intermediate wave (2). Intermediate wave (5) must be longer than intermediate wave (3), so it must end above 1,398.41 where it would reach equality in length with intermediate wave (3).
Within the final zigzag of intermediate wave (5), minor wave B may not move beyond the start of minor wave A below 1,236.54.
Within intermediate wave (1), the correction labelled minor wave B was over within one week. Within intermediate wave (2), the correction labelled minor wave B was too quick to be seen on the weekly chart. Within intermediate wave (3), the correction labelled minor wave B was over in 12 weeks, one short of a Fibonacci 13. Within intermediate wave (4), the correction labelled minor wave B was over in a Fibonacci 8 weeks. As each actionary wave is extending in time as well as price, the correction of minor wave B within intermediate wave (5) may be longer than that within intermediate wave (3). At this early stage, a Fibonacci 13 or possibly even 21 weeks may be expected. This expectation is a rough guideline; flexibility is essential when B waves unfold.
This first weekly chart sees the upwards wave labelled primary wave A as a five wave structure. It must be acknowledged that this upwards wave looks better as a three than it does as a five. The fifth weekly chart below will consider the possibility that it was a three.
FIRST DAILY CHART
Click chart to enlarge.
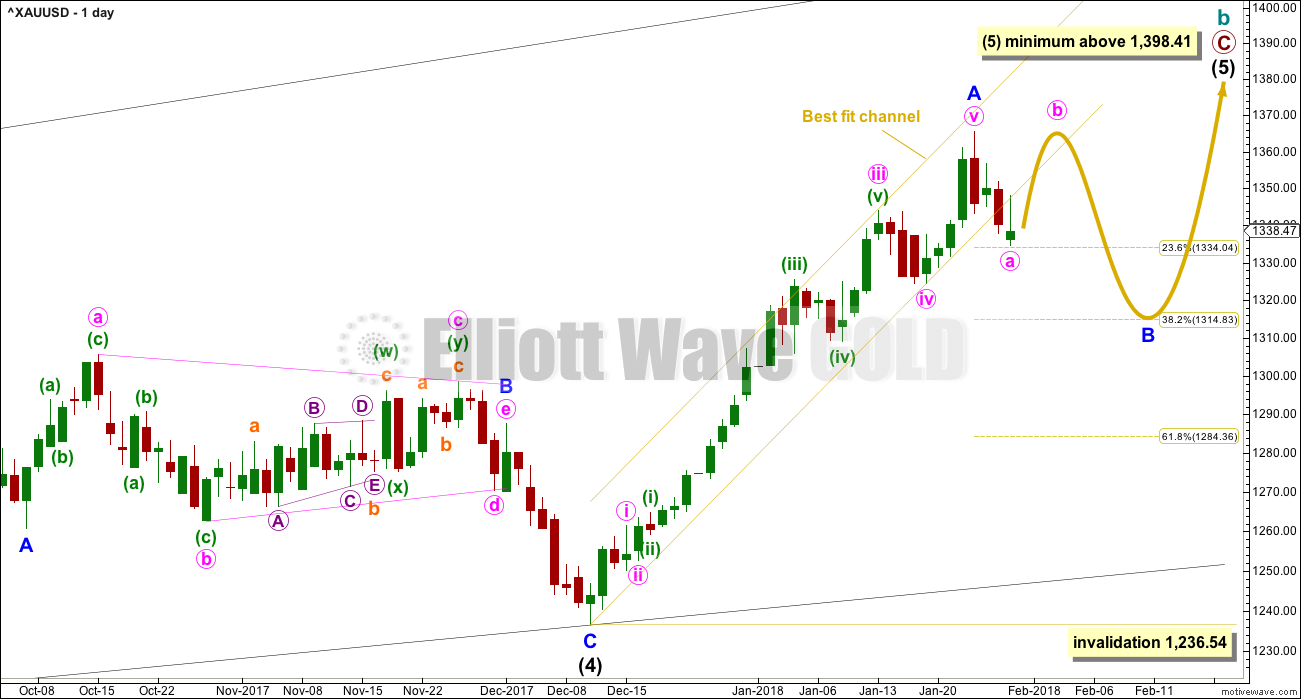
Within the ending diagonal, intermediate wave (5) must sub-divide as a zigzag.
Downwards movement has clearly broken below the yellow best fit channel. This indicates that the upwards wave labelled minor wave A should now be over and the next wave labelled minor wave B may now have begun.
Minor wave B may be a reasonably time consuming consolidation or a quicker sharper pullback within the upwards trend, and it may end about either of the 0.382 or 0.618 Fibonacci ratios (neither may be favoured).
There are more than 23 possible structures that minor wave B may take, and it is impossible until close to or at the end to have confidence which possibility has unfolded. When B waves unfold, it is essential that analysis is flexible. B waves are analogous to either range bound consolidations or sharp corrections. As minor wave B unfolds, the labelling on the hourly chart for its sub-waves will change and alternates will be required from time to time.
The yellow arrow today outlines one possibility for minor wave B, an expanded flat correction. Members are strongly advised that this outline is only one possibility of many. Expanded flats are very common structures. If minor wave B unfolds as an expanded flat, then minute wave b would make a new high above the start of minute wave a at 1,365.68. Minute wave c downwards may then take price down to about the 0.382 Fibonacci ratio of minor wave A at 1,315.
Minor wave B may also be a triangle, an overlapping sideways movement in an ever decreasing range.
Minor wave B may not move beyond the start of minor wave A below 1,236.54.
HOURLY CHART
Click chart to enlarge.
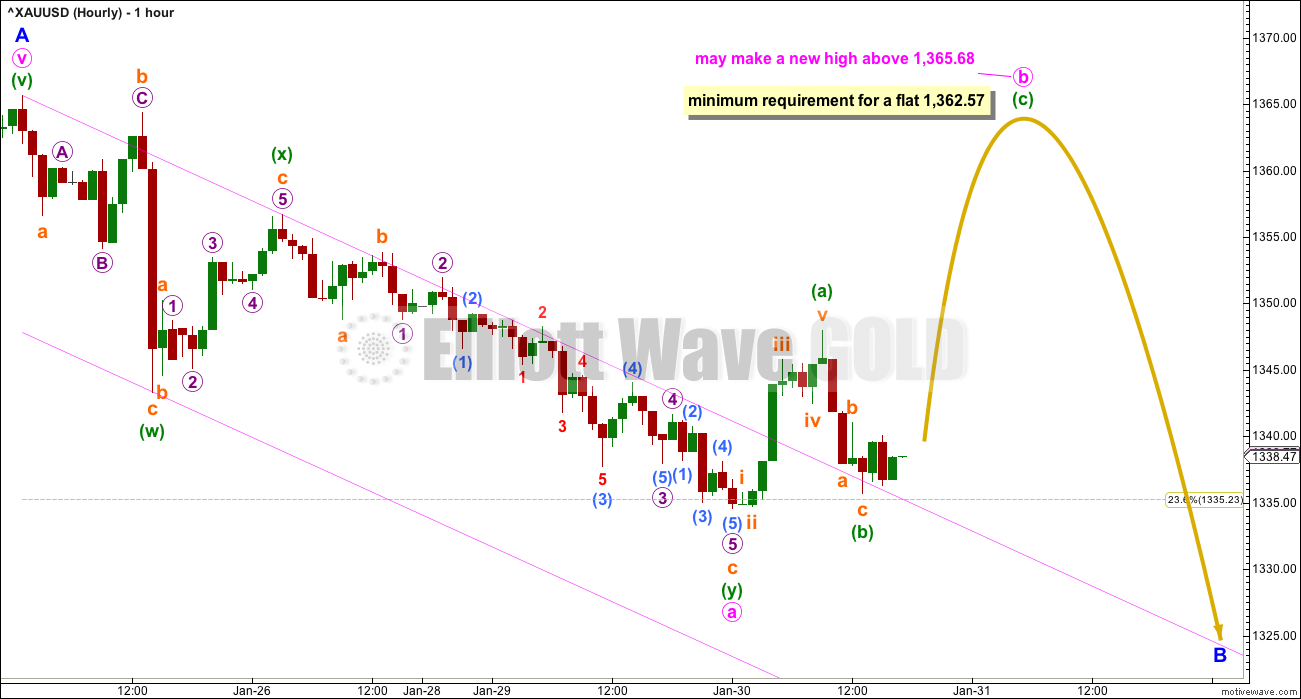
A double zigzag may now be complete at the last low labelled minute wave a. If this is correct, then minor wave B may be either a flat or a triangle, but it may not be a combination. The maximum number of corrective structures within a combination is three, and to label multiples within multiples increases the maximum beyond three violating an Elliott wave rule.
If minor wave B is a flat, then within it minute wave b must retrace a minimum 0.9 length of minute wave a. The common range for minute wave b within a flat is from 1 to 1.38 times the length of minute wave a, giving a possible range from 1,365.68 to 1,377.52.
If minor wave B is a triangle, then minute wave b would have no minimum requirement but does need to subdivide as a three wave structure.
It is possible that minor wave B could be over at the low labelled minute wave a if the degree of labelling within the double zigzag is moved up one degree. However, although this is possible, it is my judgement that the probability is too low to chart at this stage. Minor wave B looks very likely to continue further to be larger and longer lasting, so that it is in better proportion (daily and weekly charts) to minor waves B within intermediate waves (4) and (3).
BEARISH ELLIOTT WAVE COUNT
FIFTH WEEKLY CHART
Click chart to enlarge.
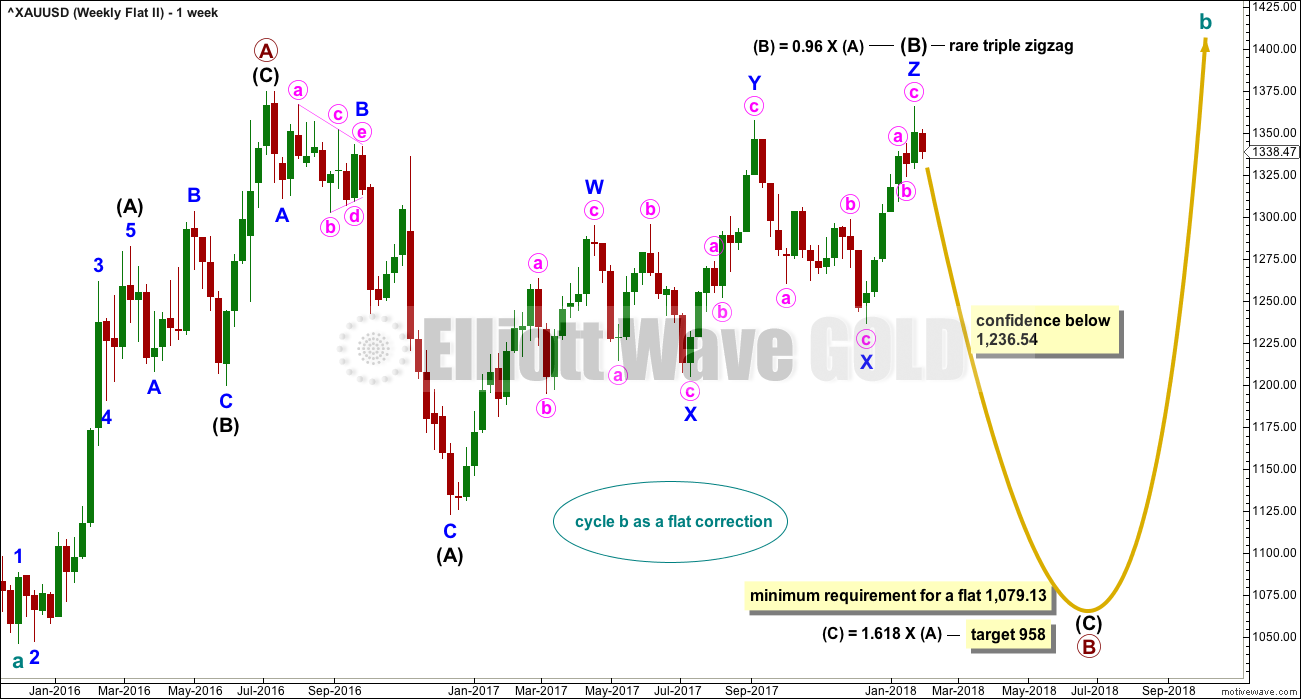
There were five weekly charts published in the last historic analysis. This fifth weekly chart is the most immediately bearish wave count, so this is published as a bearish possibility.
This fifth weekly chart sees cycle wave b as a flat correction, and within it intermediate wave (B) may be a complete triple zigzag. This would indicate a regular flat as intermediate wave (B) is less than 1.05 the length of intermediate wave (A).
If cycle wave b is a flat correction, then within it primary wave B must retrace a minimum 0.9 length of primary wave A at 1,079.13 or below. The most common length of B waves within flats is from 1 to 1.38 times the length of the A wave. The target calculated would see primary wave B end within this range.
I have only seen two triple zigzags before during my 10 years of daily Elliott wave analysis. If this wave count turns out to be correct, this would be the third. The rarity of this structure is identified on the chart.
TECHNICAL ANALYSIS
WEEKLY CHART
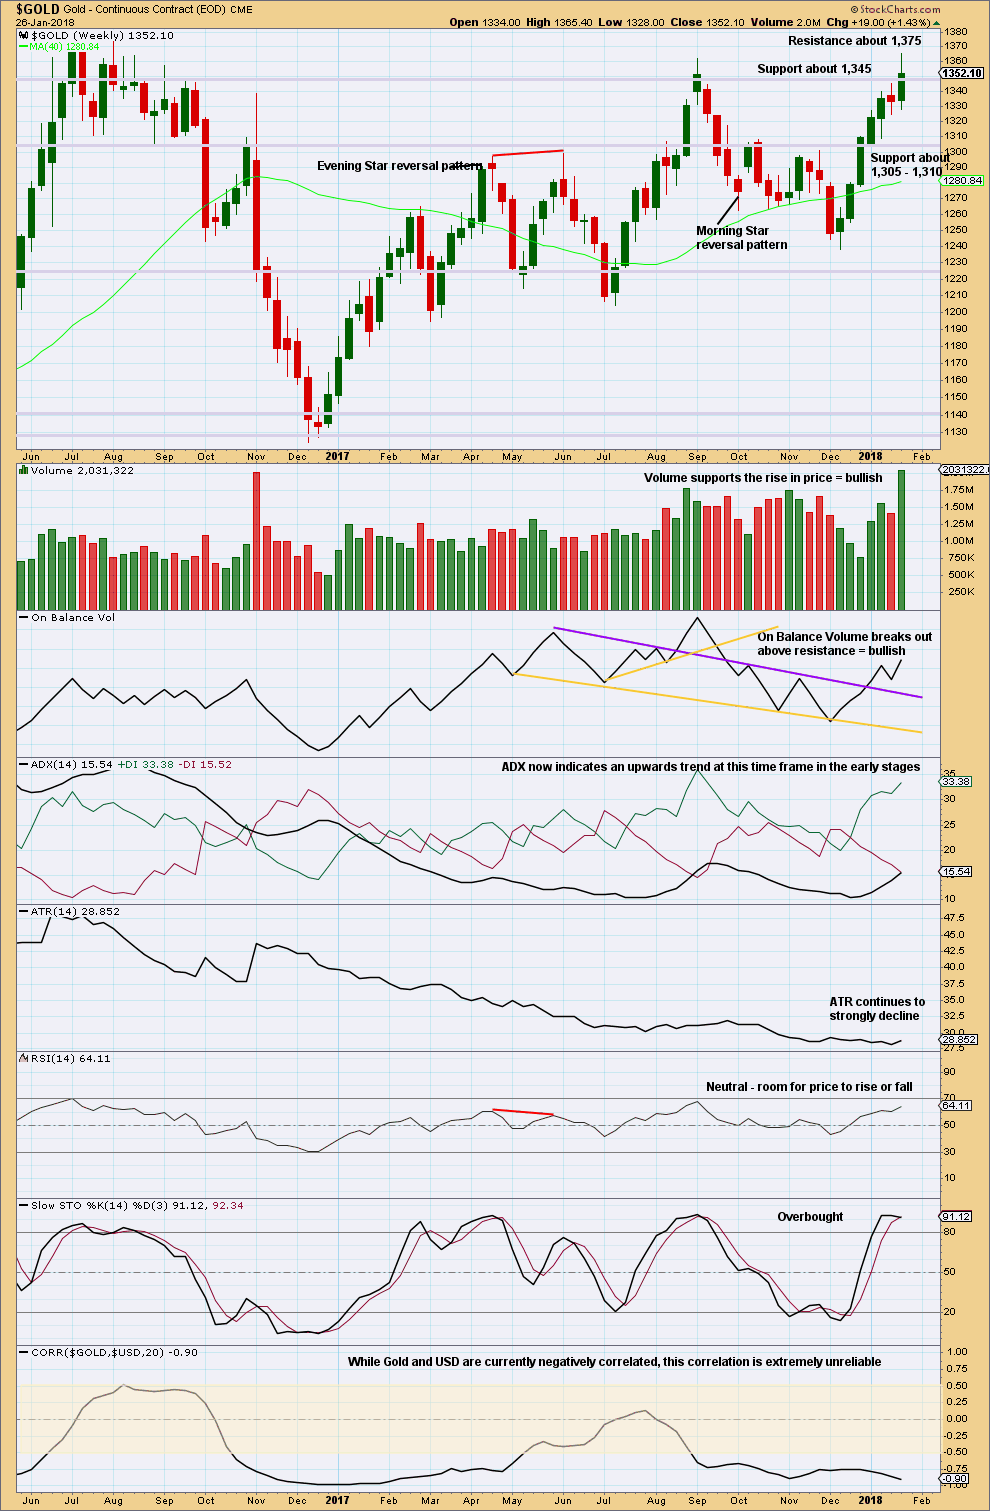
Click chart to enlarge. Chart courtesy of StockCharts.com.
Prior resistance about 1,345 may now be support. This upwards trend may still be in the relatively early stages.
Markets do not move in straight lines when markets trend; there are corrections and consolidations within the trend.
On Balance Volume, ADX and RSI all indicate more upwards movement is possible and looks likely.
The negative correlation between Gold and the USD was very weak for about four months as recently as early May 2017 to late August 2017. While these two markets are currently strongly negatively correlated, they may not be so in the near future. The correlation may disappear at any time. Looking at the correlation co-efficient on the monthly chart shows periods of up to a year where these two markets are not correlated, usually when Gold is consolidating.
Currently, Gold is still within a huge consolidation range delineated by resistance about 1,375 and support about 1,195 to 1,235. With price now closing in on a resistance zone and Stochastics overbought, a downwards swing or pullback is possible soon. If price can break above resistanace at 1,375, and if it does so with support from volume, then a classic upwards breakout would be indicated.
Within this large consolidation, it is now this completed upwards week that has strongest volume. This suggests an upwards breakout from the huge consolidation is now more likely than downwards.
DAILY CHART
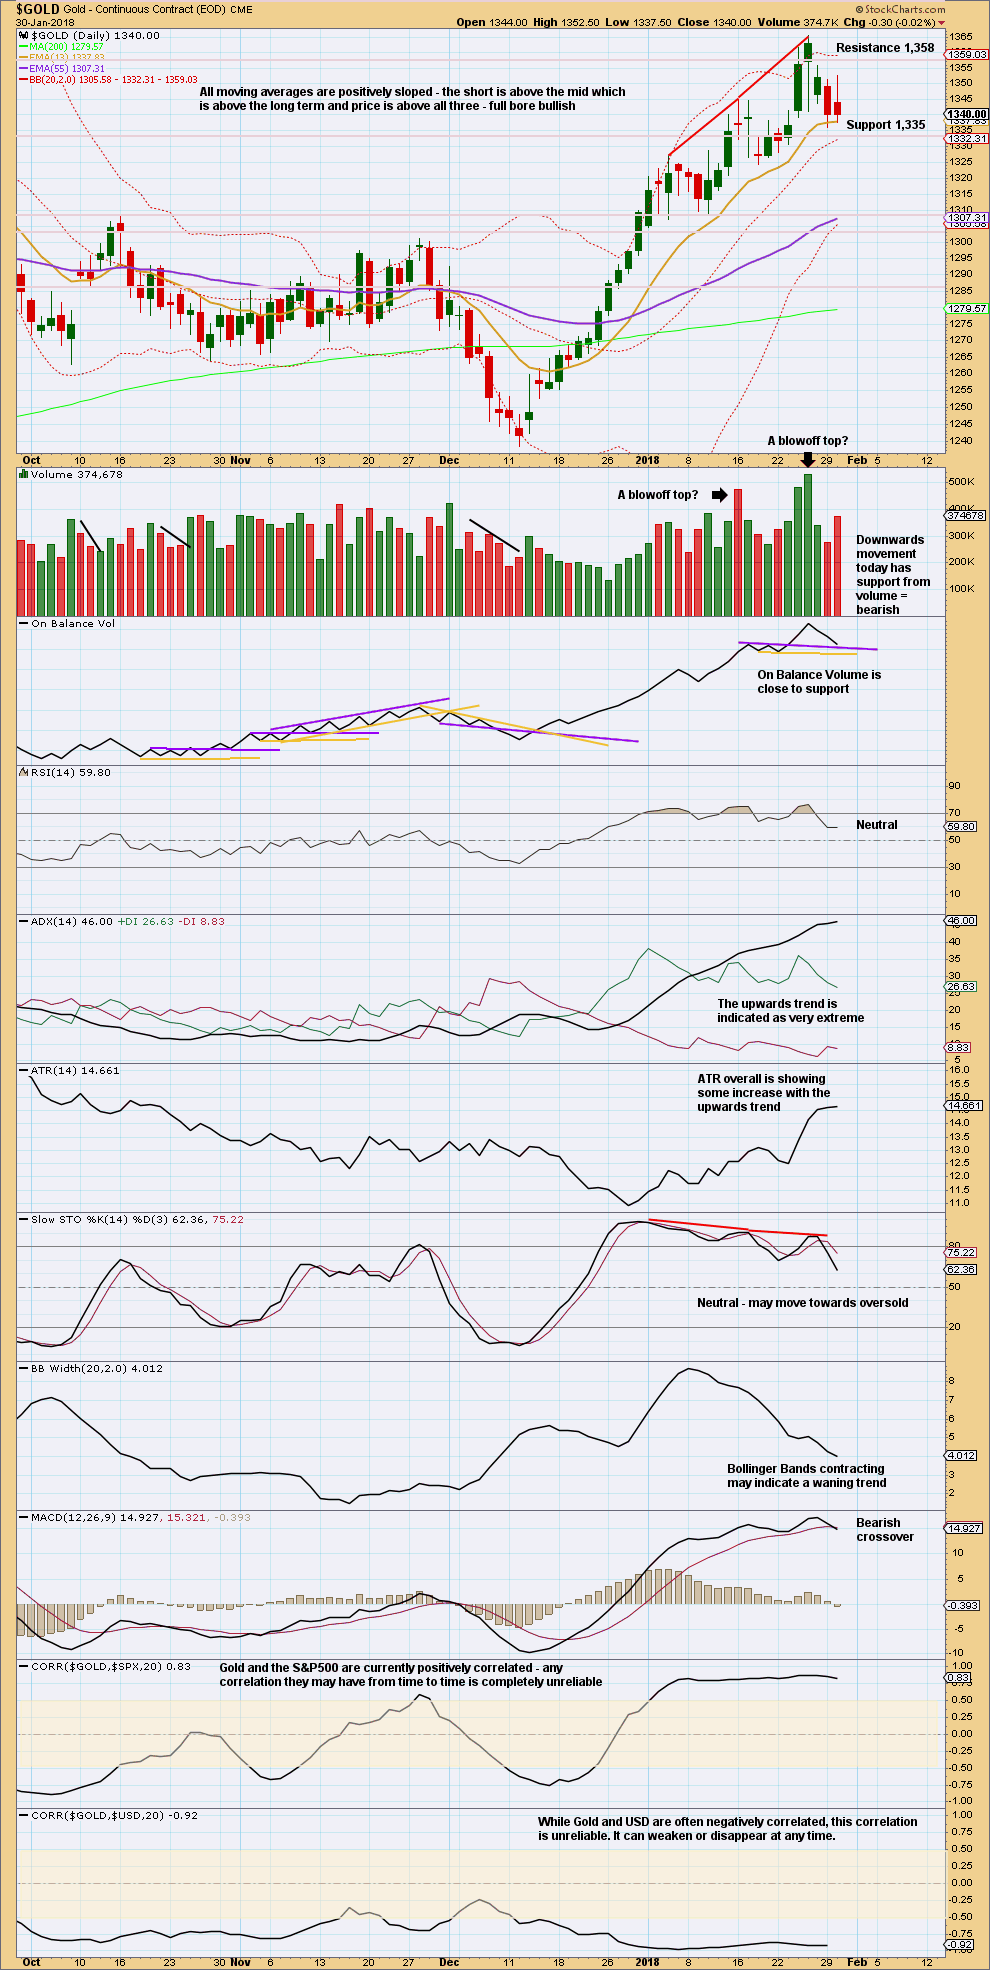
Click chart to enlarge. Chart courtesy of StockCharts.com.
Price is finding support about the short term Fibonacci 13 day moving average. The long upper wick on today’s candlestick is bearish. The short term volume profile is now bearish, but this is contradicted by On Balance Volume at support. A break below the purple trend line by On Balance Volume would be a bearish signal.
MACD today gives a bearish signal.
GDX DAILY CHART
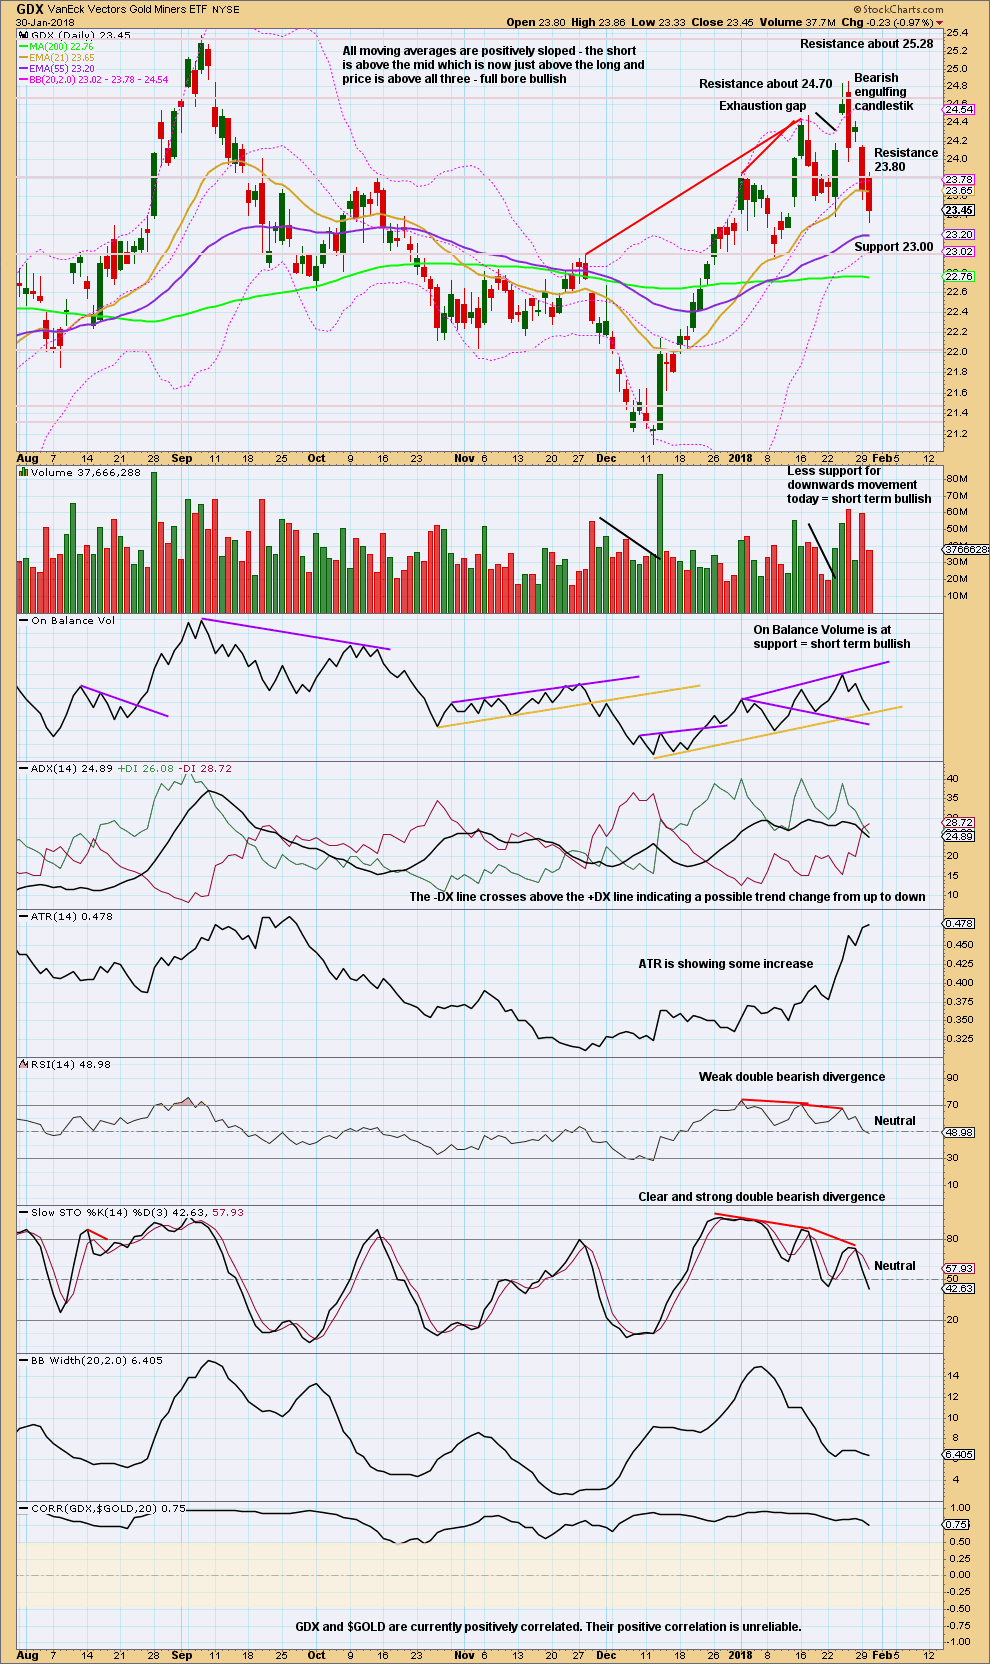
Click chart to enlarge. Chart courtesy of StockCharts.com.
GDX looks slightly clearer than Gold today. With weak volume and On Balance Volume at support, look out for a bounce here.
Published @ 06:15 p.m. EST.
hourly chart updated:
price may now be within a B wave…. of a B wave. Not the best opportunity
over the next few days volume may give us clues as to the breakout direction
Wow, the chat on this site is too much!
Confusing state of affairs really with Gold price; upside presently limiting under 1350 but needs to break below 1331 which does not seem to be happening. Most likely range bound sideways consolidation at best with no let up yet by the bulls although CCI and ADX on the daily seem to be hinting for some downside action. Best to be on the sidelines speechless! lol. GL.