
A strong breach of the channel on the hourly chart has indicated a low is probably in for Gold, at least for the short term. Upwards movement then has continued as expected after the breach.
Summary: Look for price to continue now in an upwards swing to end above 1,361.46. The target is at 1,375.
New updates to this analysis are in bold.
Grand SuperCycle analysis is here.
Last in-depth historic analysis with monthly and several weekly charts is here, video is here.
There are multiple wave counts at this time at the weekly and monthly chart levels. In order to make this analysis manageable and accessible only two will be published on a daily basis, one bullish and one bearish. This does not mean the other possibilities may not be correct, only that publication of them all each day is too much to digest. At this stage, they do not diverge from the two possibilities below.
BULLISH ELLIOTT WAVE COUNT
FIRST WEEKLY CHART
Click chart to enlarge.
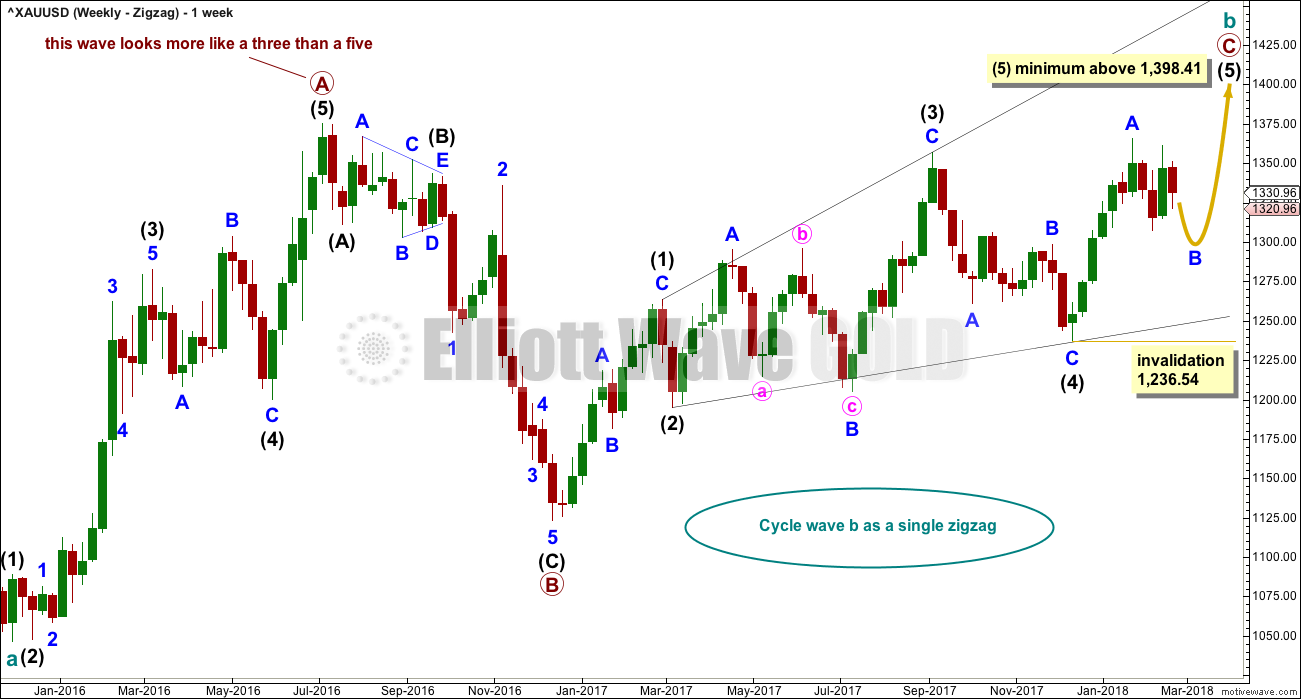
Cycle wave b may be a single zigzag. Zigzags subdivide 5-3-5. Primary wave C must subdivide as a five wave structure and may be either an impulse or an ending diagonal. Overlapping at this stage indicates an ending diagonal.
Within an ending diagonal, all sub-waves must subdivide as zigzags. Intermediate wave (4) must overlap into intermediate wave (1) price territory. This diagonal is expanding: intermediate wave (3) is longer than intermediate wave (1) and intermediate wave (4) is longer than intermediate wave (2). Intermediate wave (5) must be longer than intermediate wave (3), so it must end above 1,398.41 where it would reach equality in length with intermediate wave (3).
Within the final zigzag of intermediate wave (5), minor wave B may not move beyond the start of minor wave A below 1,236.54.
Within intermediate wave (1), the correction labelled minor wave B was over within one week. Within intermediate wave (2), the correction labelled minor wave B was too quick to be seen on the weekly chart. Within intermediate wave (3), the correction labelled minor wave B was over in 12 weeks, one short of a Fibonacci 13. Within intermediate wave (4), the correction labelled minor wave B was over in a Fibonacci 8 weeks. As each actionary wave is extending in time as well as price, the correction of minor wave B within intermediate wave (5) may be longer than that within intermediate wave (3). At this early stage, a Fibonacci 13 or possibly even 21 weeks may be expected. This expectation is a rough guideline; flexibility is essential when B waves unfold.
This first weekly chart sees the upwards wave labelled primary wave A as a five wave structure. It must be acknowledged that this upwards wave looks better as a three than it does as a five. The fifth weekly chart below will consider the possibility that it was a three.
FIRST DAILY CHART
Click chart to enlarge.
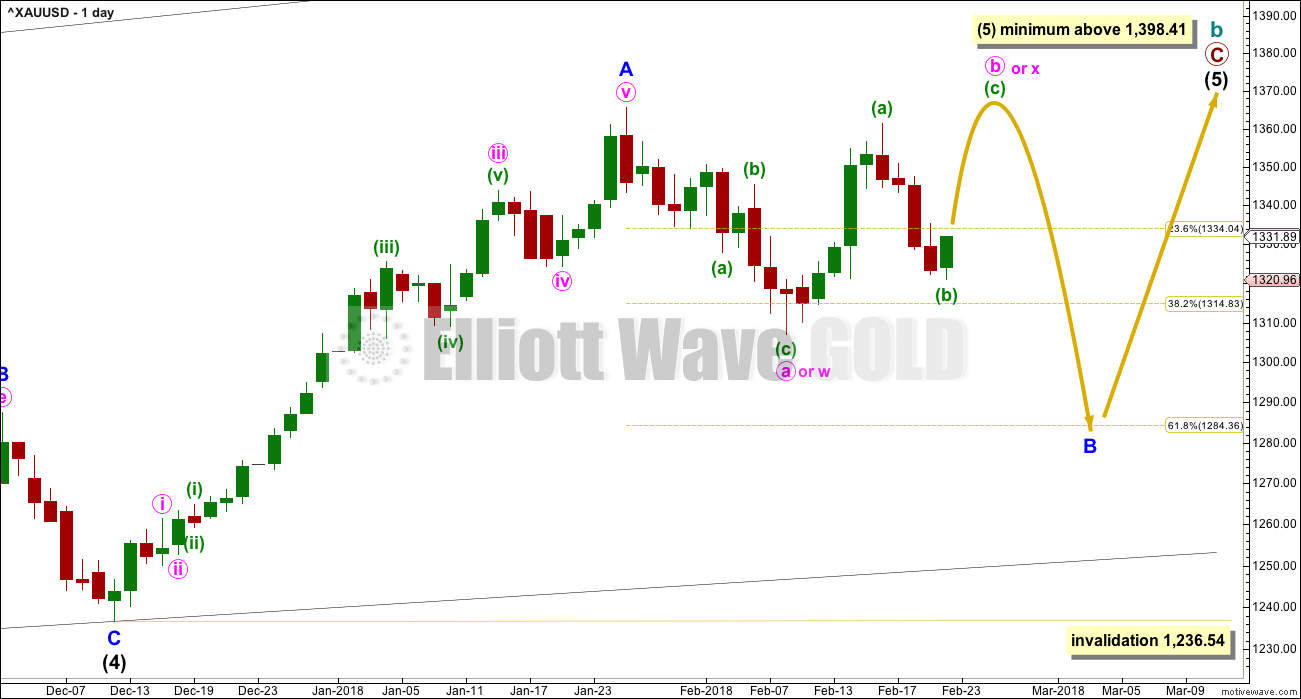
Within the ending diagonal, intermediate wave (5) must sub-divide as a zigzag.
Minor wave B may be a reasonably time consuming consolidation or a quicker sharper pullback within the upwards trend, and it may end about either of the 0.382 or 0.618 Fibonacci ratios (neither may be favoured). At this stage, it looks more likely that minor wave B may be a more time consuming sideways consolidation. Although it is possible that minor wave B could have been over at the last low as a quick shallow pullback, which is considered in the second alternate hourly chart.
There are more than 23 possible structures that minor wave B may take, and it is impossible until close to or at the end to have confidence which structure has unfolded. When B waves unfold, it is essential that analysis is flexible. B waves are analogous to either range bound consolidations or sharp corrections. As minor wave B unfolds, the labelling on the hourly chart for its sub-waves will change and alternates will be required.
The yellow arrows outline the possible pathway for an expanded flat for minor wave B. Members are strongly advised that this pathway is only one possible pathway of many. It is chosen to illustrate one of the most common structures for a B wave. This pathway may change as minor wave B continues further. If it does, then the labelling on hourly charts will change.
Minor wave B may still be a triangle or zigzag. All possibilities must still be considered.
Minor wave B may not move beyond the start of minor wave A below 1,236.54.
HOURLY CHART
Click chart to enlarge.
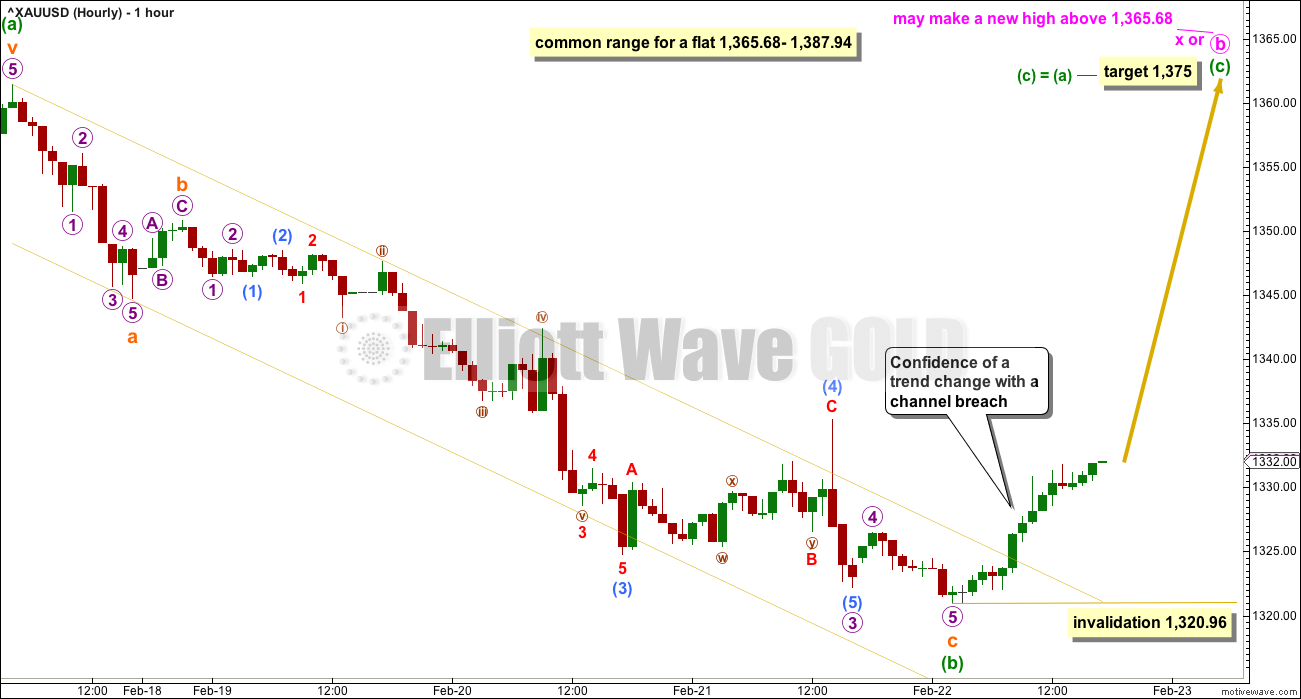
The consolidation for minor wave B continues. It may still be any one of a flat, combination, triangle or double zigzag. This first hourly chart looks at the possibility that minor wave B may be a flat, triangle or combination.
Within minor wave B, minute wave b may be incomplete. It may be unfolding as a zigzag.
Within the zigzag of minute wave b, minuette waves (a) and now also (b) may be complete. Minuette wave (c) would be very likely to make at least a slight new high above the end of minuette wave (a) at 1,361.46 to avoid a truncation. A target today is calculated for minute wave b to end, which expects minuette wave (c) to exhibit the most common Fibonacci ratio to minuette wave (a), that of equality in length.
A new high above 1,335.28 would still add some further confidence that a low is in place for the short term, even though this is no longer the invalidation point on the alternate hourly chart below.
ALTERNATE HOURLY CHART
Click chart to enlarge.
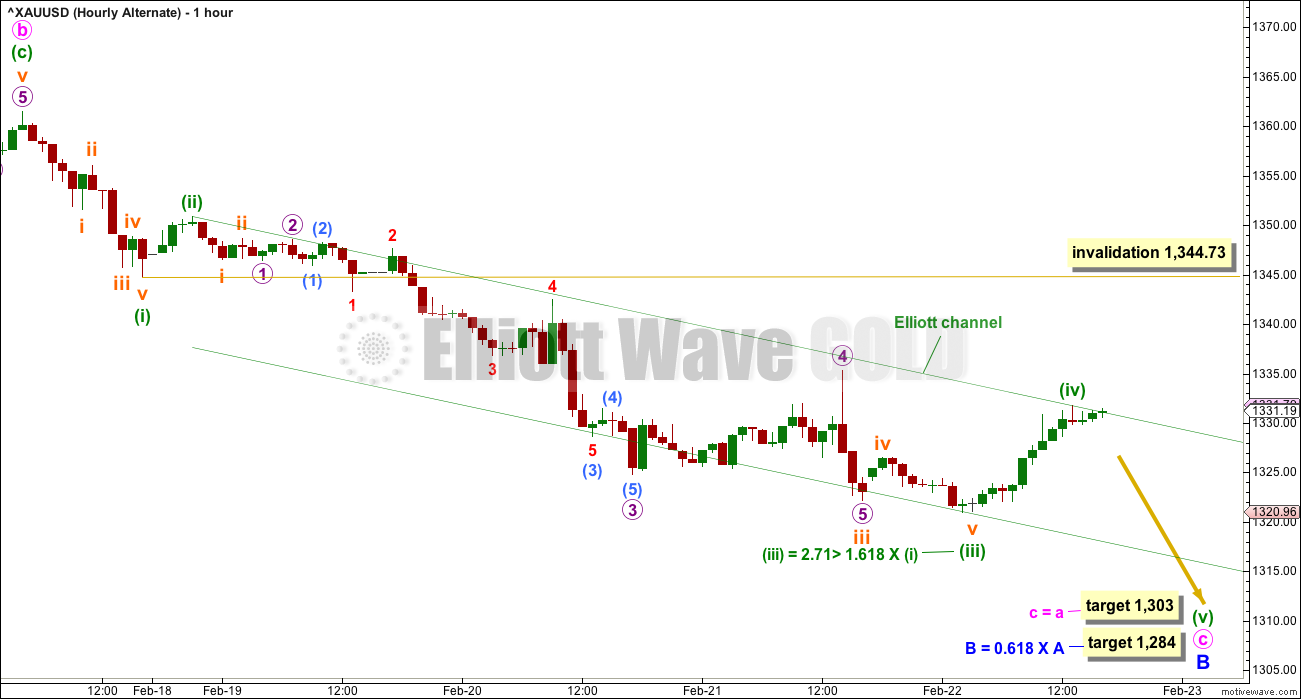
This alternate looks at the possibility that minor wave B is continuing as a zigzag.
Within the zigzag, minute wave a may be over as per the labelling on the daily chart. Minute wave b may have been over at the last high.
Minute wave c may now be underway. It would be extremely likely to move at least slightly below the end of minute wave a at 1,307.09 to avoid a truncation. The targets would see it achieve this.
At this stage, the labelling within minute wave c is adjusted. Upwards movement may be minuette wave (iv). Minuette wave (iv) may not move into minuette wave (i) price territory above 1,344.73.
However, the size of upwards movement looks too big to be minuette wave (iv). Although this wave count fits, it no longer has the right look and now has a low probability.
SECOND ALTERNATE HOURLY CHART
Click chart to enlarge.
Bullishness at the end of last week in classic technical analysis does offer some support for this second alternate hourly chart.
This wave count looks at the possibility that minor wave B was over as a relatively quick shallow zigzag at the low labelled minute wave a on the daily chart.
Downwards movement this week may be a second wave correction for minute wave ii. The next wave up may be a third wave.
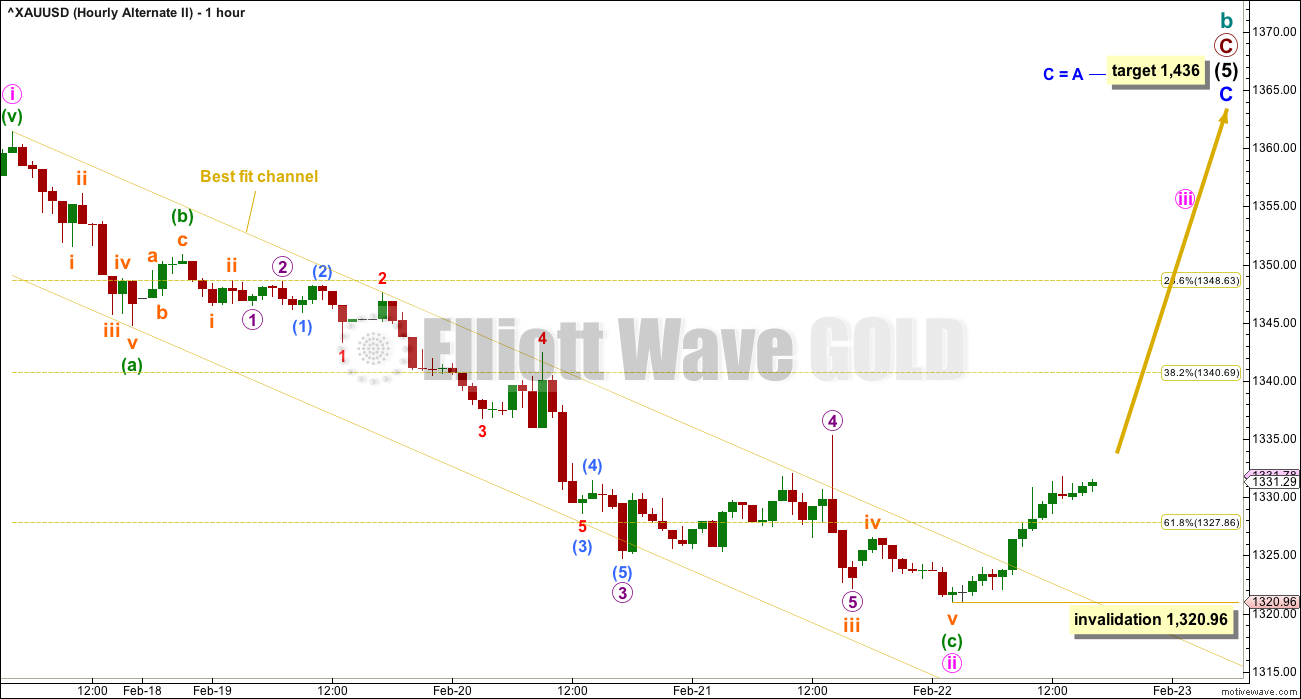
Now that upwards movement has clearly breached the best fit channel, which contains the prior wave down, minute wave ii may be assumed to be over and a third wave up may possibly be underway.
Within minute wave iii, no second wave correction may move beyond the start of its first wave below 1,320.96.
If this wave count is correct, then upwards movement should show an increase in momentum and should have support from volume. It does not have to begin with strength, but strength should build relatively quickly.
BEARISH ELLIOTT WAVE COUNT
FIFTH WEEKLY CHART
Click chart to enlarge.
There were five weekly charts published in the last historic analysis. This fifth weekly chart is the most immediately bearish wave count, so this is published as a bearish possibility.
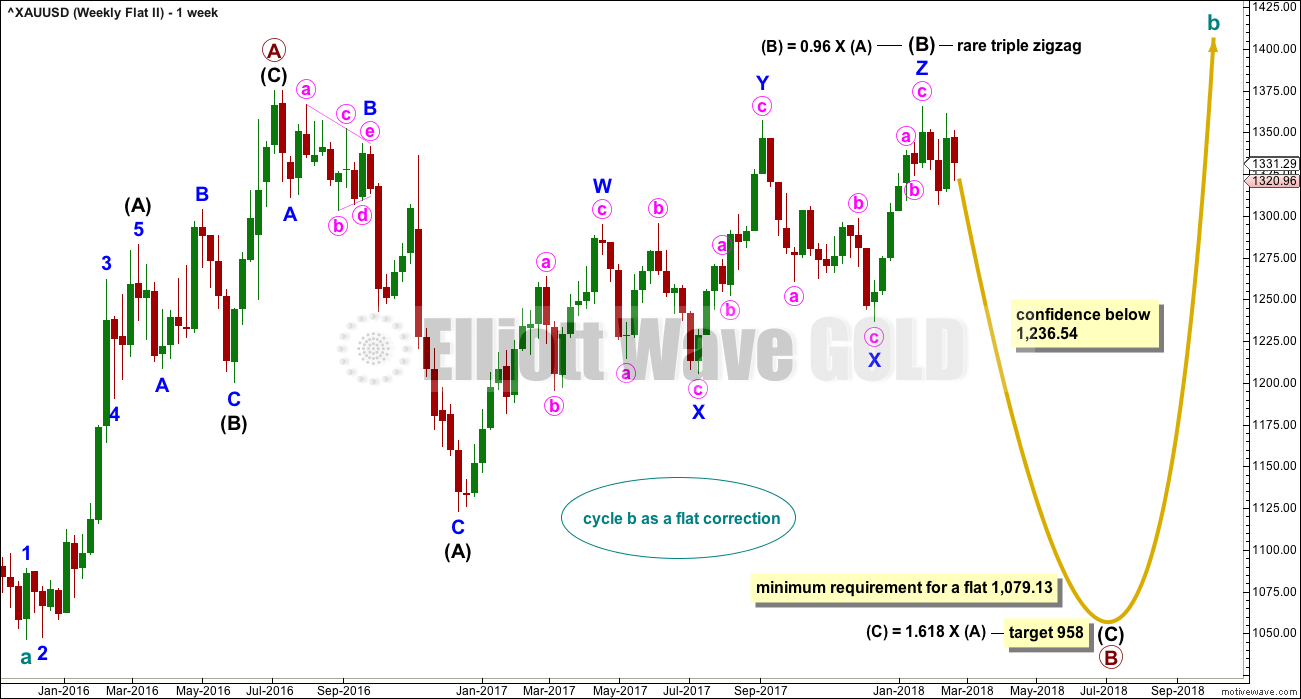
This fifth weekly chart sees cycle wave b as a flat correction, and within it intermediate wave (B) may be a complete triple zigzag. This would indicate a regular flat as intermediate wave (B) is less than 1.05 the length of intermediate wave (A).
If cycle wave b is a flat correction, then within it primary wave B must retrace a minimum 0.9 length of primary wave A at 1,079.13 or below. The most common length of B waves within flats is from 1 to 1.38 times the length of the A wave. The target calculated would see primary wave B end within this range.
I have only seen two triple zigzags before during my 10 years of daily Elliott wave analysis. If this wave count turns out to be correct, this would be the third. The rarity of this structure is identified on the chart.
TECHNICAL ANALYSIS
WEEKLY CHART
Click chart to enlarge. Chart courtesy of StockCharts.com.
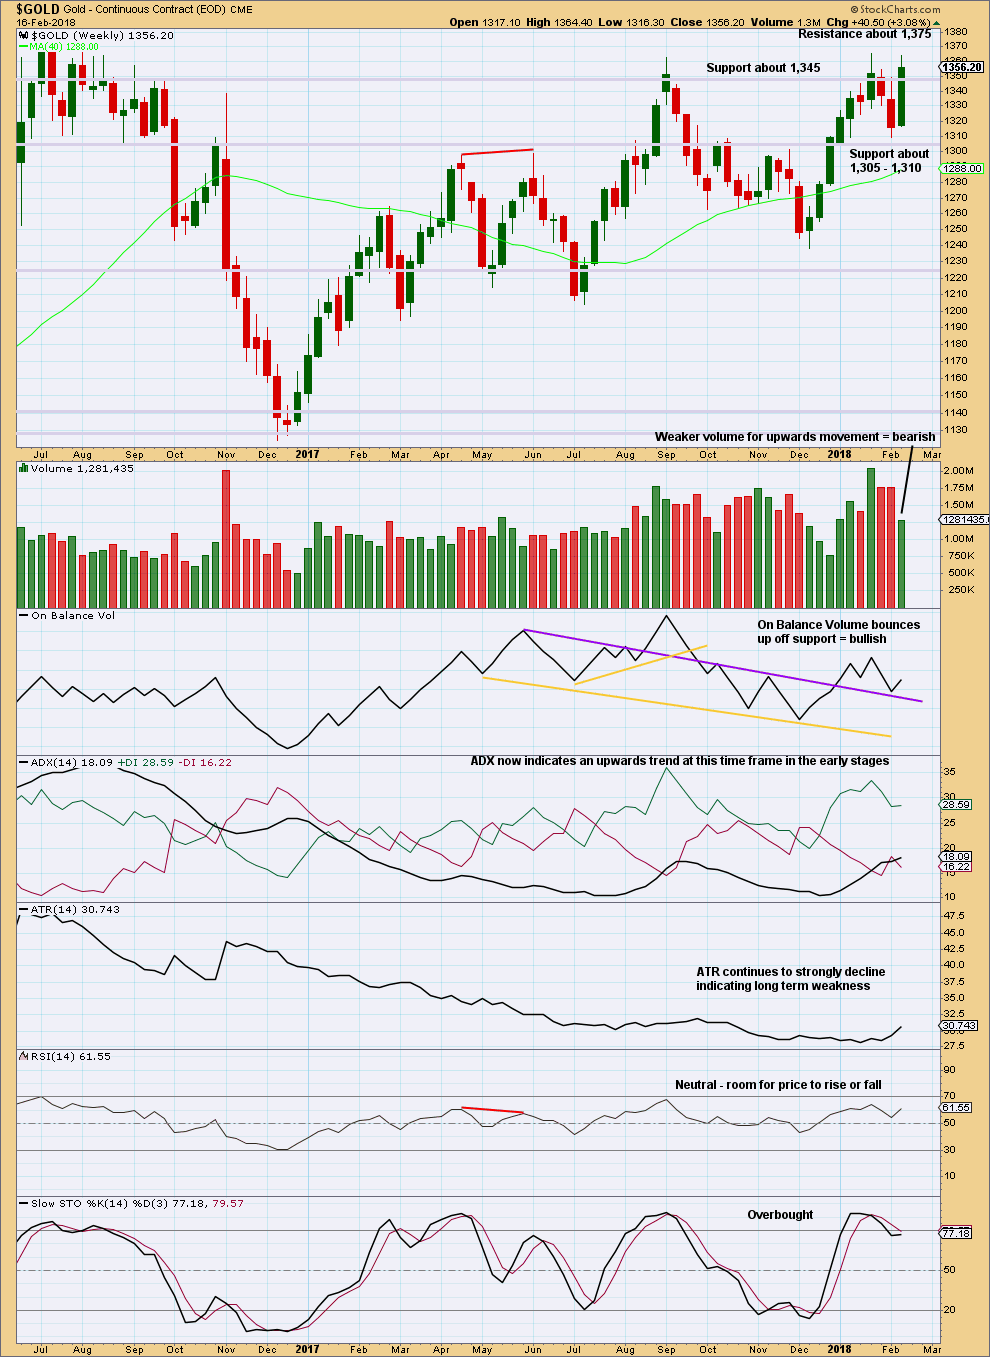
At the weekly time frame, ADX now indicates an upwards trend but price is still range bound with resistance about 1,375 and support finally about 1,225.
Strongest weekly volume of recent weeks is an upwards week, which is bullish. The last signal from On Balance Volume is bullish. This supports the main daily Elliott wave count.
DAILY CHART
Click chart to enlarge. Chart courtesy of StockCharts.com.
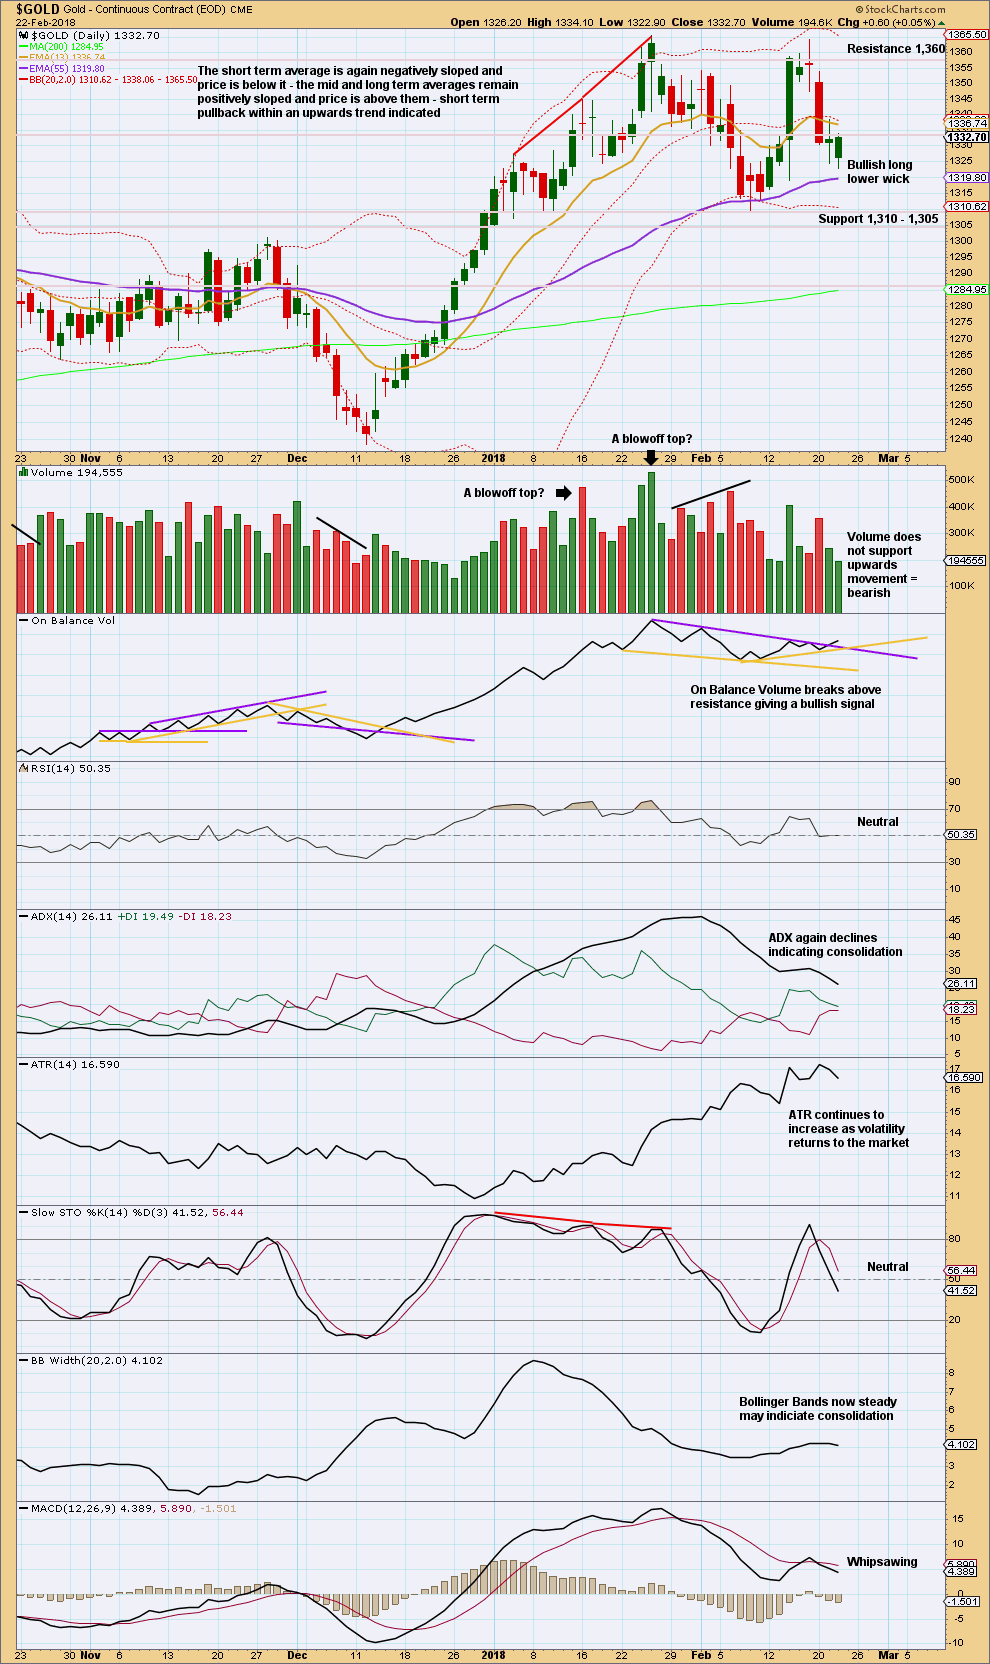
Weight is given in this analysis to the bullish signal from On Balance Volume. Expect now upwards movement to find resistance about 1,360 and then about 1,375 (from the weekly chart).
Both RSI and Stochastics are neutral, giving plenty of room for price to rise or fall.
GDX WEEKLY CHART
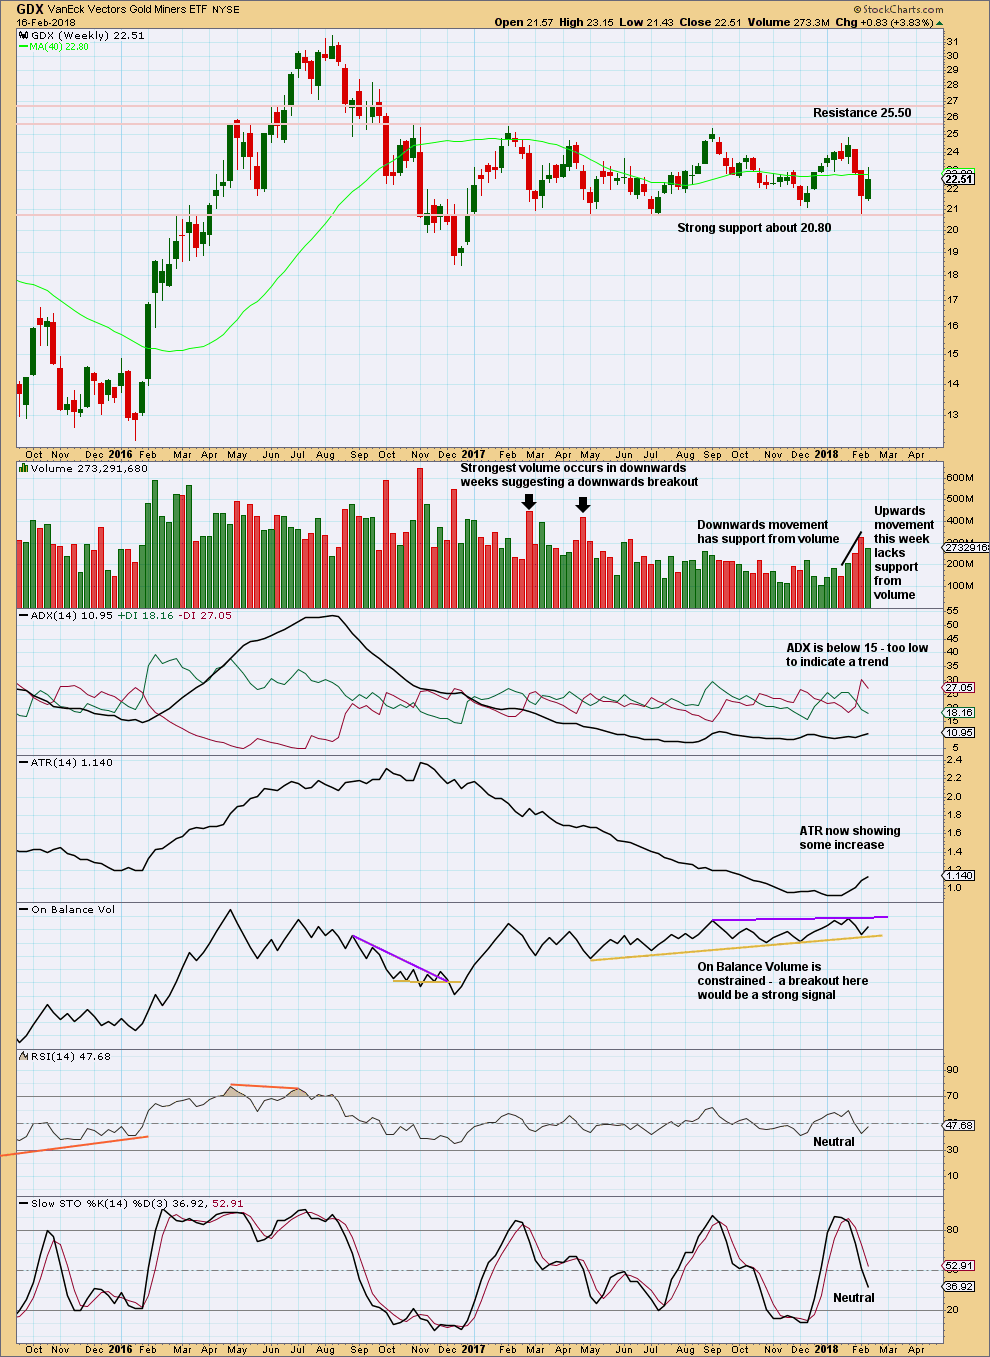
Click chart to enlarge. Chart courtesy of StockCharts.com.
Support about 20.80 has been tested about seven times and so far has held. The more often a support area is tested and holds, the more technical significance it has.
In the first instance, expect this area to continue to provide support. Only a strong downwards day, closing below support and preferably with some increase in volume, would constitute a downwards breakout from the consolidation that GDX has been in for a year now.
Resistance is about 25.50. Only a strong upwards day, closing above resistance and with support from volume, would constitute an upwards breakout.
The longer upper wick on this week and declining volume are both bearish.
On Balance Volume should be watched closely. A breakout there may signal the breakout direction for price.
GDX DAILY CHART
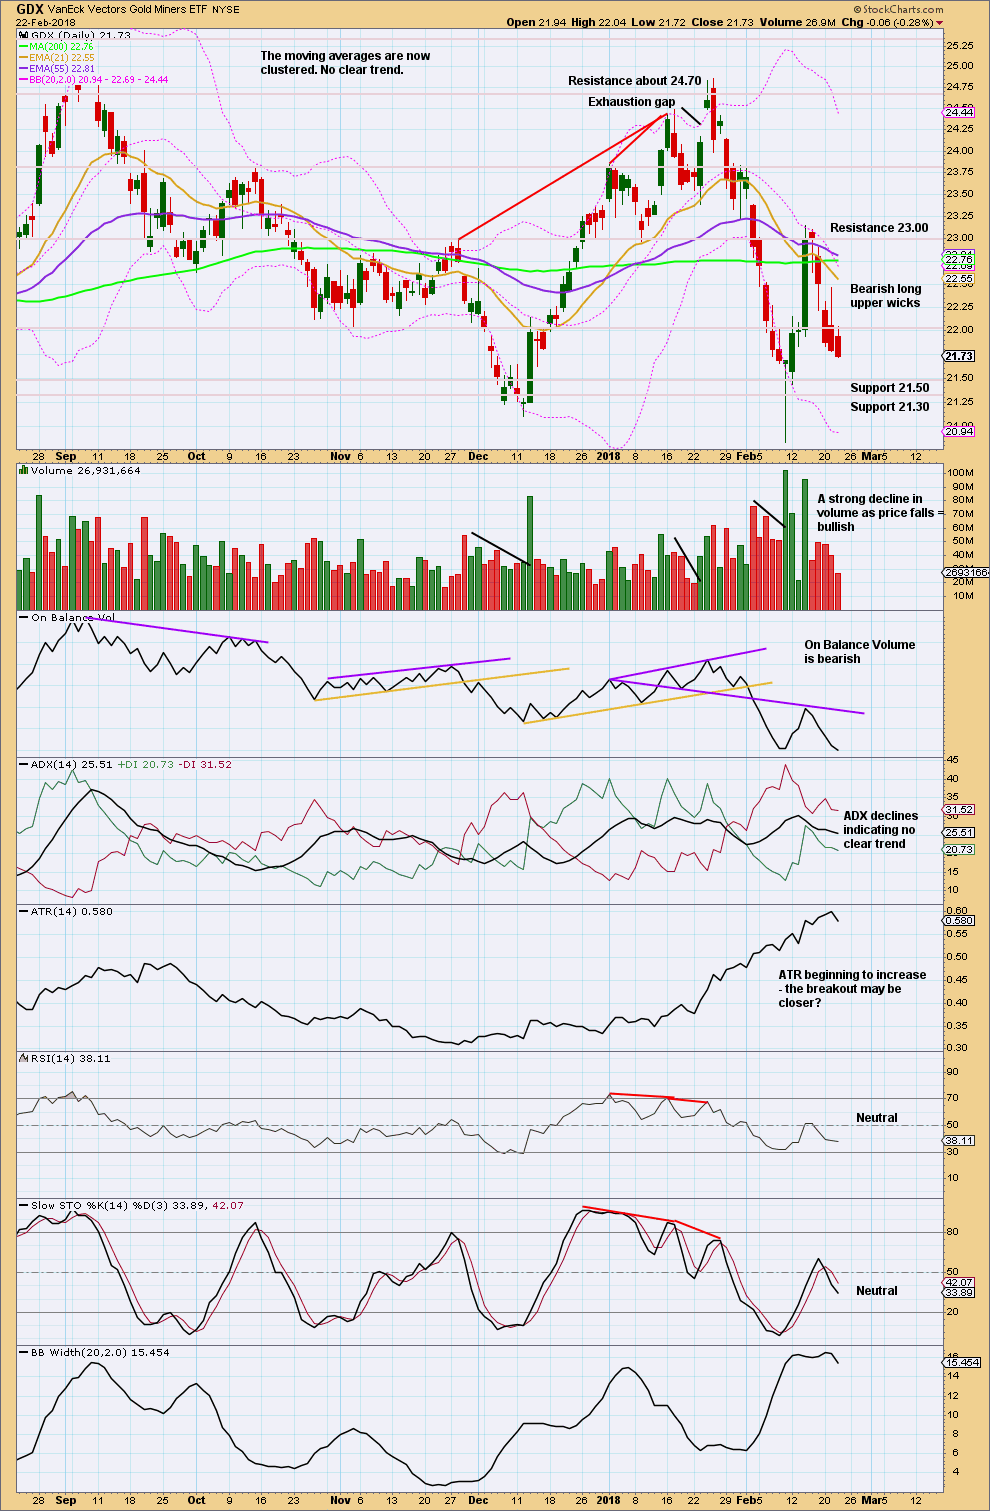
Click chart to enlarge. Chart courtesy of StockCharts.com.
Today’s upper wick is less bearish than yesterday’s, but it is still bearish. If On Balance Volume continues to move lower tomorrow, then it would be giving another bearish signal because it would make a new low below the prior swing low on the 9th of February, and that would be very bearish for GDX.
However, a strong decline in volume today should be given weight in this analysis. It looks like GDX may have found a low here.
Published @ 05:42 p.m. EST.
Any thoughts on this bullish count
Main hourly chart updated:
Alternate hourly chart updated:
Conclusion:
It looks like todays sideways movement is a triangle. It could be a fourth wave, or a B wave.
Very short term the breakout direction is unclear.
I suspect we have one more low ahead…
Goody! Opening GLD bull put spreads for current move higher. Looks like time to cash out UUP bull put spreads…