
Gold continues to be range bound exactly as expected.
Summary: This consolidation may continue for another 12 weeks (including this week). It may be choppy and overlapping, or it may be a sharper pullback. Support may be about 1,315 or possibly as low as 1,284. Resistance should be about 1,365 to 1,375.
A new low below 1,236.54 would indicate Gold remains within a huge bear market. At that stage, new lows would be expected below 1,046.27.
New updates to this analysis are in bold.
Grand SuperCycle analysis is here.
Last in-depth historic analysis with monthly and several weekly charts is here, video is here.
There are multiple wave counts at this time at the weekly and monthly chart levels. In order to make this analysis manageable and accessible only two will be published on a daily basis, one bullish and one bearish. This does not mean the other possibilities may not be correct, only that publication of them all each day is too much to digest. At this stage, they do not diverge from the two possibilities below.
BULLISH ELLIOTT WAVE COUNT
FIRST WEEKLY CHART
Click chart to enlarge.
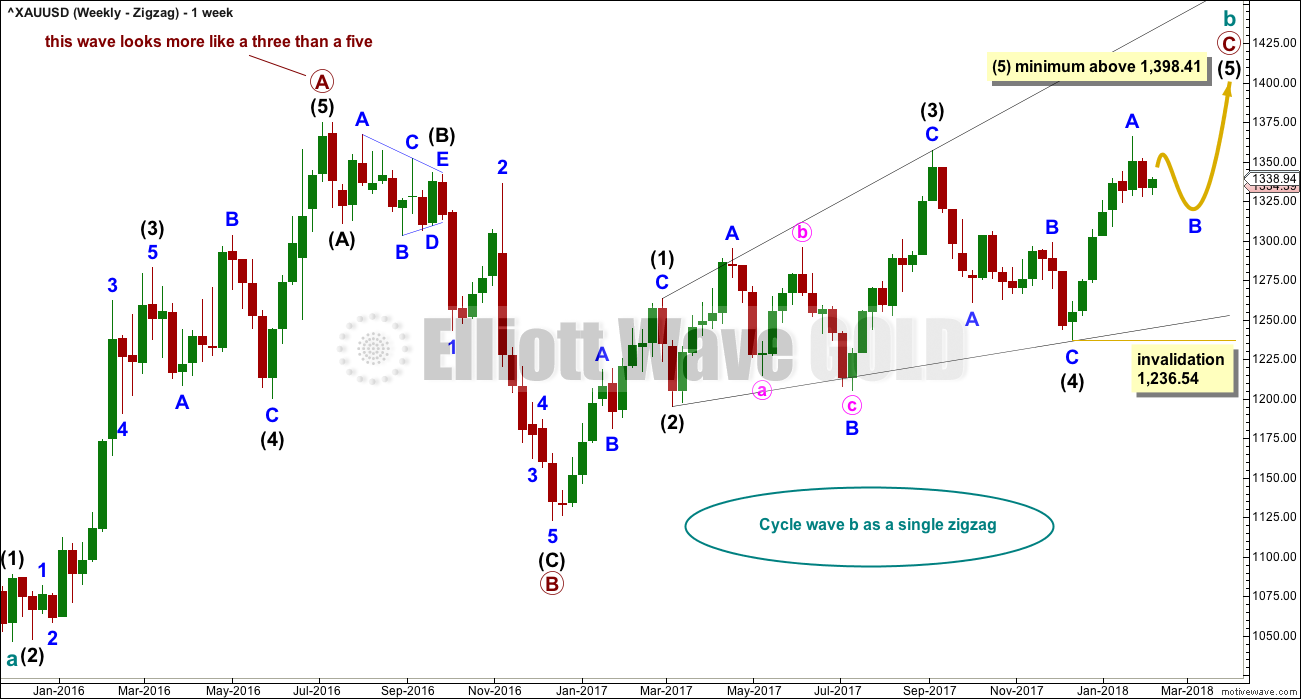
Cycle wave b may be a single zigzag. Zigzags subdivide 5-3-5. Primary wave C must subdivide as a five wave structure and may be either an impulse or an ending diagonal. Overlapping at this stage indicates an ending diagonal.
Within an ending diagonal, all sub-waves must subdivide as zigzags. Intermediate wave (4) must overlap into intermediate wave (1) price territory. This diagonal is expanding: intermediate wave (3) is longer than intermediate wave (1) and intermediate wave (4) is longer than intermediate wave (2). Intermediate wave (5) must be longer than intermediate wave (3), so it must end above 1,398.41 where it would reach equality in length with intermediate wave (3).
Within the final zigzag of intermediate wave (5), minor wave B may not move beyond the start of minor wave A below 1,236.54.
Within intermediate wave (1), the correction labelled minor wave B was over within one week. Within intermediate wave (2), the correction labelled minor wave B was too quick to be seen on the weekly chart. Within intermediate wave (3), the correction labelled minor wave B was over in 12 weeks, one short of a Fibonacci 13. Within intermediate wave (4), the correction labelled minor wave B was over in a Fibonacci 8 weeks. As each actionary wave is extending in time as well as price, the correction of minor wave B within intermediate wave (5) may be longer than that within intermediate wave (3). At this early stage, a Fibonacci 13 or possibly even 21 weeks may be expected. This expectation is a rough guideline; flexibility is essential when B waves unfold.
This first weekly chart sees the upwards wave labelled primary wave A as a five wave structure. It must be acknowledged that this upwards wave looks better as a three than it does as a five. The fifth weekly chart below will consider the possibility that it was a three.
FIRST DAILY CHART
Click chart to enlarge.
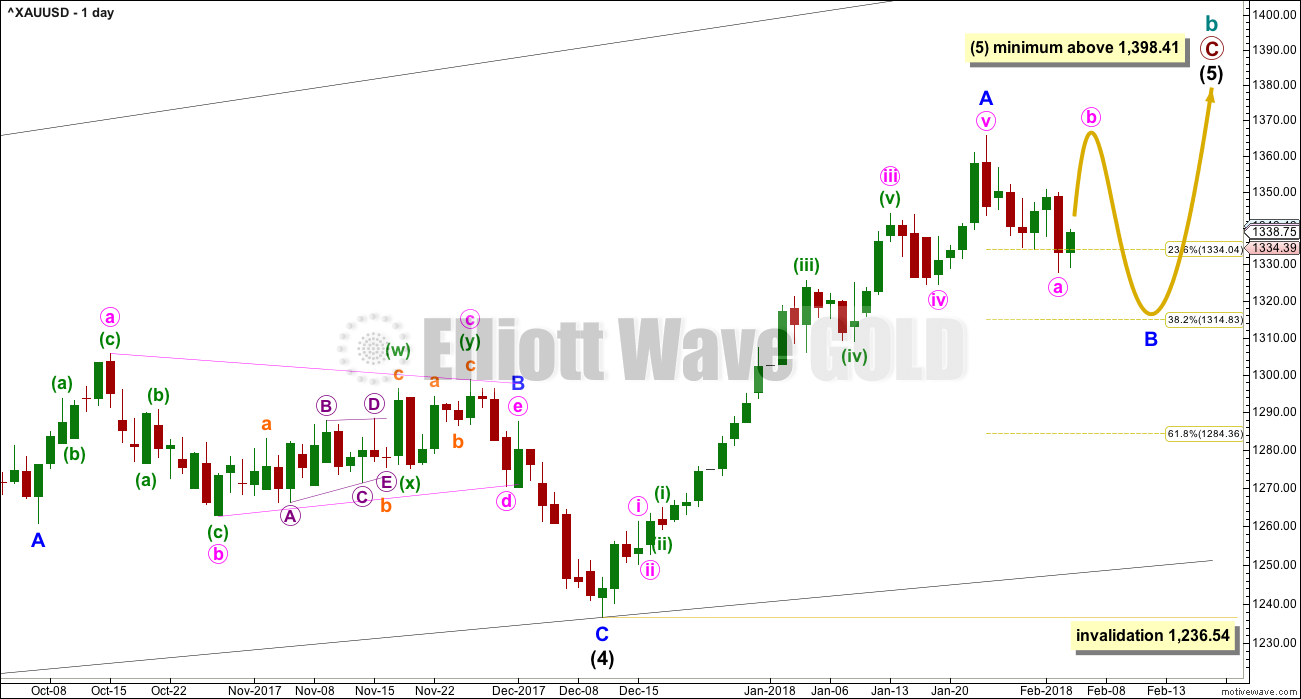
Within the ending diagonal, intermediate wave (5) must sub-divide as a zigzag.
Minor wave B may be a reasonably time consuming consolidation or a quicker sharper pullback within the upwards trend, and it may end about either of the 0.382 or 0.618 Fibonacci ratios (neither may be favoured).
There are more than 23 possible structures that minor wave B may take, and it is impossible until close to or at the end to have confidence which possibility has unfolded. When B waves unfold, it is essential that analysis is flexible. B waves are analogous to either range bound consolidations or sharp corrections. As minor wave B unfolds, the labelling on the hourly chart for its sub-waves will change and alternates will be required from time to time.
The yellow arrow still outlines one possibility for minor wave B, an expanded flat correction. Members are strongly advised that this outline is only one possibility of many. Expanded flats are very common structures. If minor wave B unfolds as an expanded flat, then minute wave b would make a new high above the start of minute wave a at 1,365.68. Minute wave c downwards may then take price down to about the 0.382 Fibonacci ratio of minor wave A at 1,315.
Minor wave B may also be a triangle, an overlapping sideways movement in an ever decreasing range. At this stage, it may also be a zigzag, a relatively quick and sharp pullback that may end closer to the 0.618 Fibonacci ratio then the 0.382 Fibonacci ratio.
Minor wave B may not move beyond the start of minor wave A below 1,236.54.
HOURLY CHART
Click chart to enlarge.
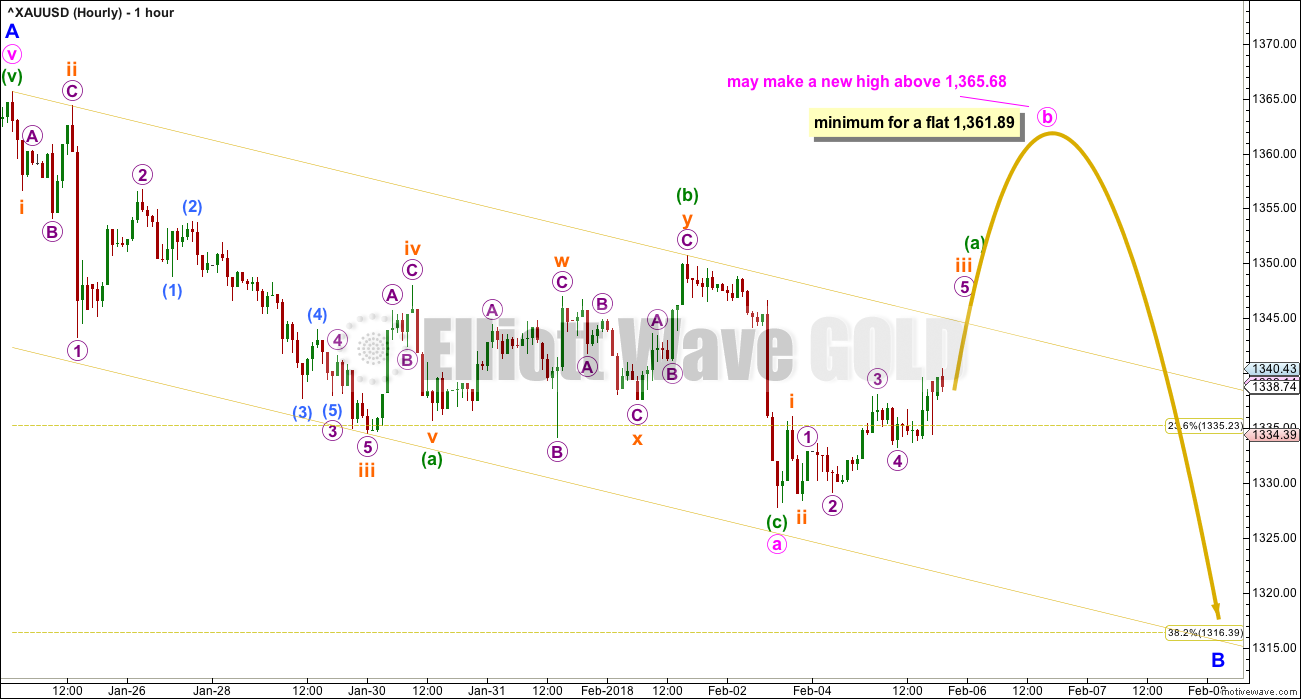
The strongest piece of analysis on both hourly charts is still the yellow best fit channel. The bottom line is that we should assume price may continue lower while price remains within this channel. If price breaks above the upper edge of this channel tomorrow, then use this first hourly chart and look out for a strong bounce within minor wave B.
Minute wave a at this stage may be either a three wave zigzag or a five wave impulse. This first hourly chart looks at the possibility of a zigzag, which overall does have a better look (the proportions are a better fit).
If minute wave a is a three wave structure, then minute wave b would likely be a strong upwards bounce, and may make a new high above the start of minute wave a as in an expanded flat or running triangle. The minimum requirement for a flat is 0.9 the length of minute wave a at 1,361.89. There is no minimum requirement for minute wave b if minor wave B is a triangle.
Minute wave b may be a very time consuming and complicated movement. It may last a few weeks.
ALTERNATE HOURLY CHART
Click chart to enlarge.
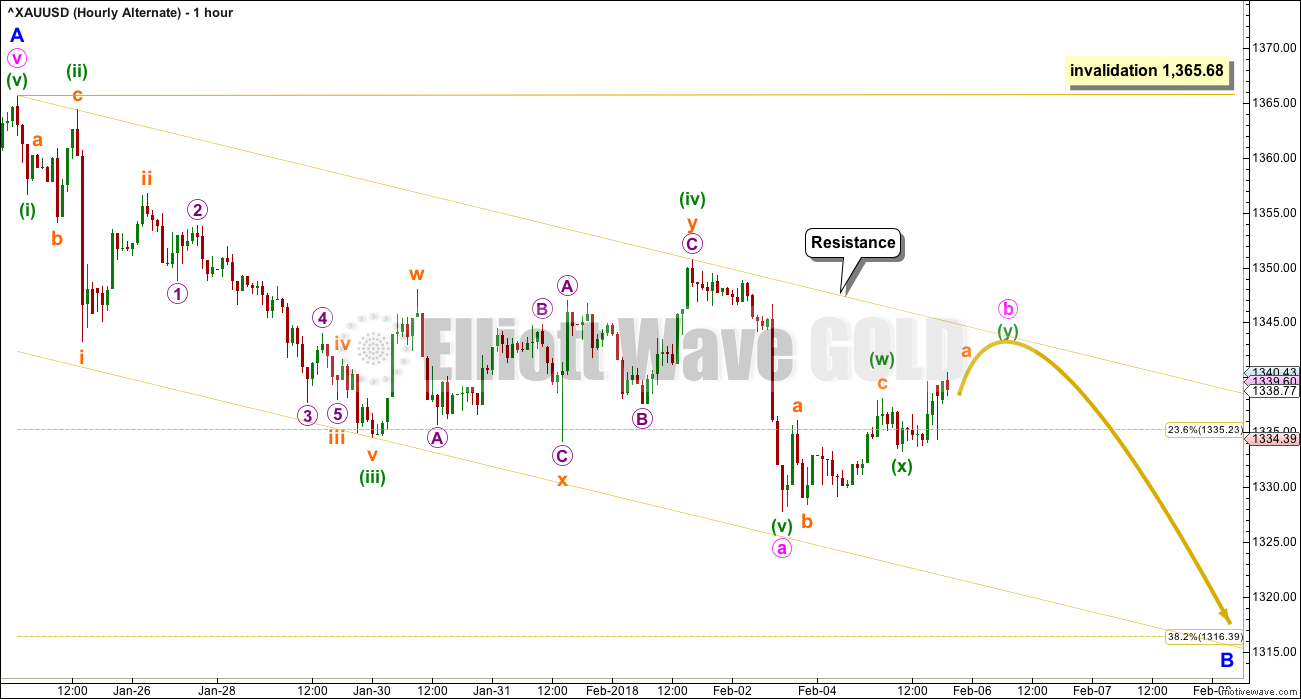
It is also possible that minute wave a was a five wave impulse. Both possibilities must be considered.
If minute wave a was an impulse, then minute wave b may not make a new high above the start of minute wave a at 1,365.68. Minute wave b may be relatively shallow, and it may find resistance about the upper edge of the yellow best fit channel.
There is a gross disproportion between subminuette waves (ii) and (iv) within minute wave a. This wave count does not have the right look for this reason. However, proportions within time consuming consolidations are not always very good, so this wave count is a valid possibility.
If a zigzag downwards does complete as this wave count expects for minor wave B, then another possibility must also be considered: the degree of labelling within the zigzag may be moved down one degree; it may be only minute wave a of a flat or triangle, or minute wave w of a double zigzag or combination.
Multiple structural possibilities would still remain for minor wave B.
BEARISH ELLIOTT WAVE COUNT
FIFTH WEEKLY CHART
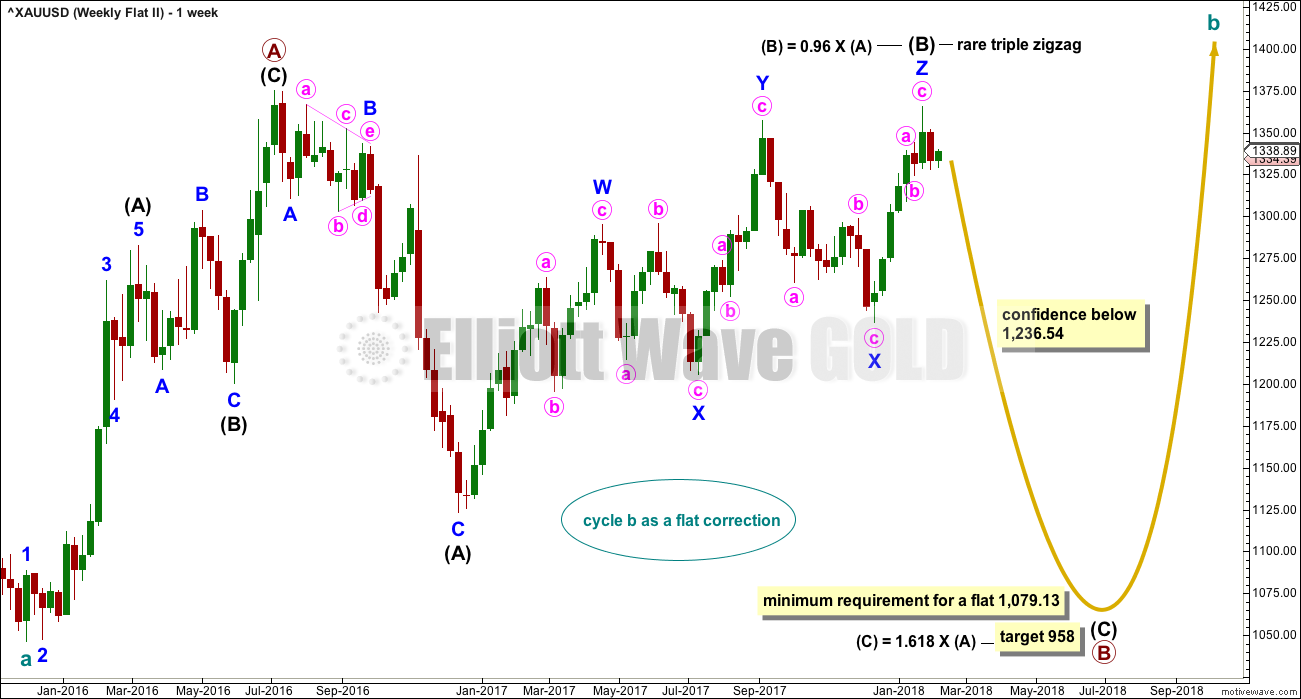
Click chart to enlarge.
There were five weekly charts published in the last historic analysis. This fifth weekly chart is the most immediately bearish wave count, so this is published as a bearish possibility.
This fifth weekly chart sees cycle wave b as a flat correction, and within it intermediate wave (B) may be a complete triple zigzag. This would indicate a regular flat as intermediate wave (B) is less than 1.05 the length of intermediate wave (A).
If cycle wave b is a flat correction, then within it primary wave B must retrace a minimum 0.9 length of primary wave A at 1,079.13 or below. The most common length of B waves within flats is from 1 to 1.38 times the length of the A wave. The target calculated would see primary wave B end within this range.
I have only seen two triple zigzags before during my 10 years of daily Elliott wave analysis. If this wave count turns out to be correct, this would be the third. The rarity of this structure is identified on the chart.
TECHNICAL ANALYSIS
WEEKLY CHART
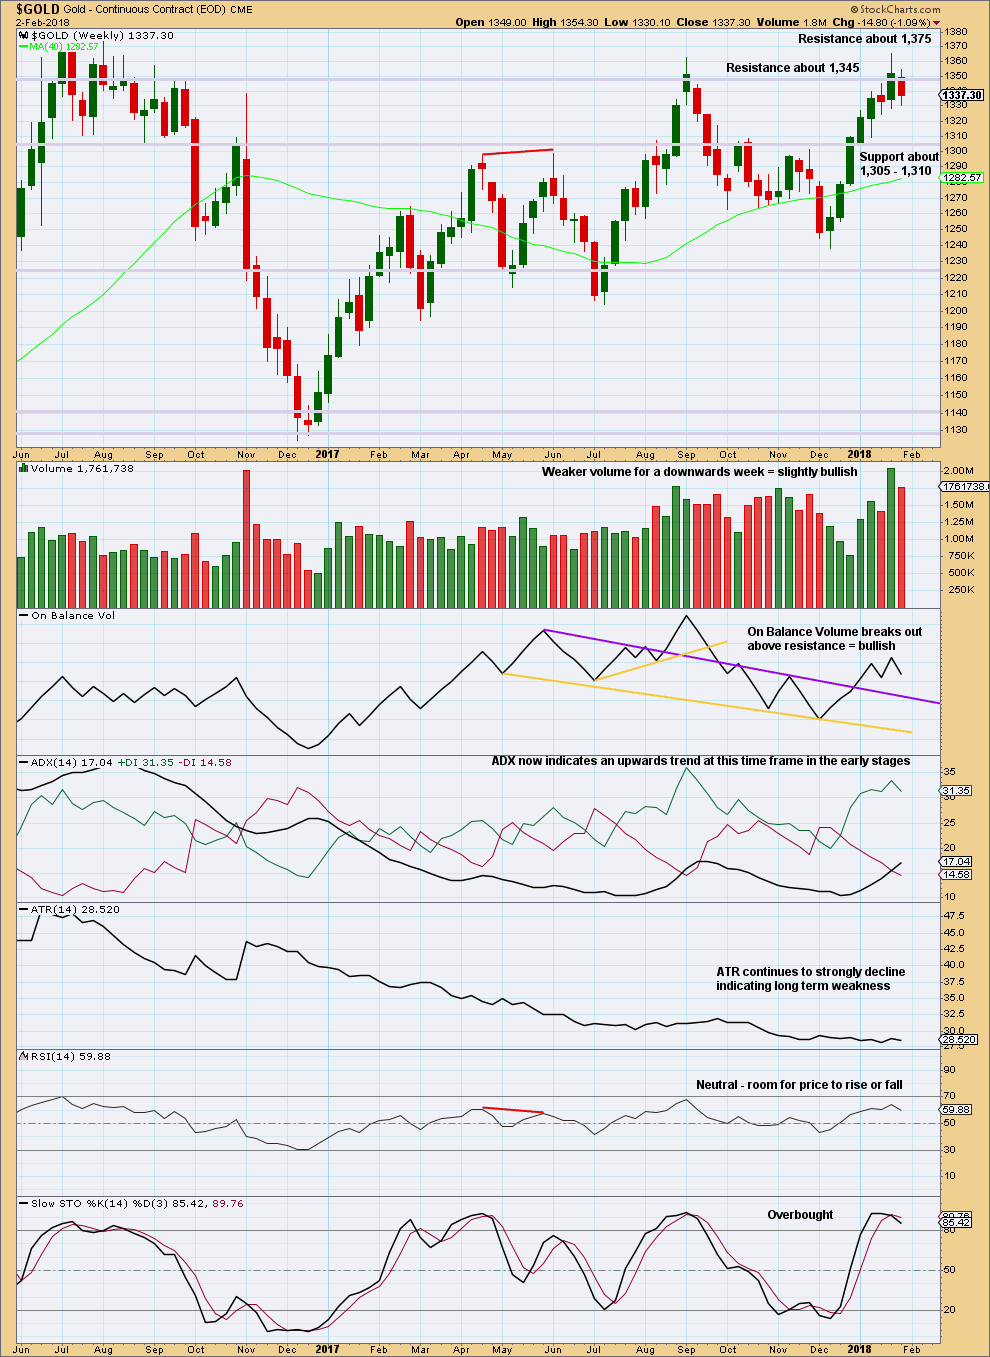
Click chart to enlarge. Chart courtesy of StockCharts.com.
Again, price could not remain above resistance at 1,345 and has closed back below this point. Price remains range bound at this time frame with resistance about 1,378 and support about 1,225. During this consolidation, it is now an upwards week that has strongest volume suggesting an upwards breakout may be more likely than downwards.
Last week’s upwards movement had strong support from volume. This week’s downwards movement does not. The short term volume profile remains bullish.
However, with price at resistance and Stochastics overbought, it would be reasonable to expect an end to the upwards swing here and a downwards swing to support.
DAILY CHART
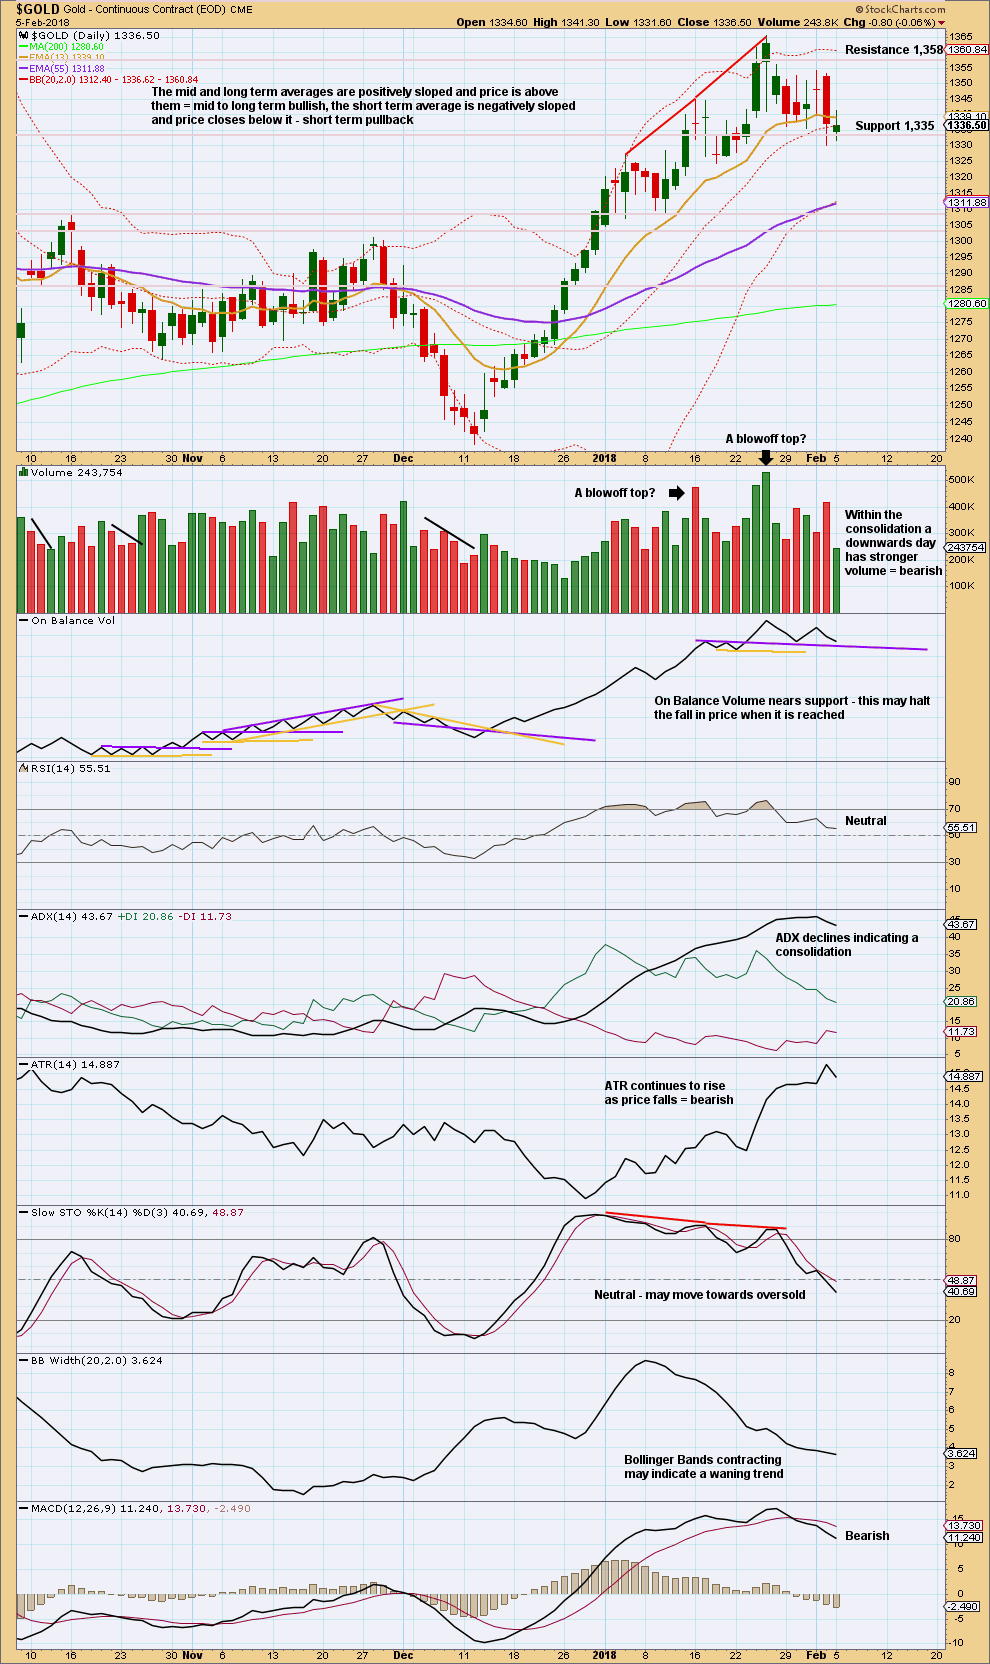
Click chart to enlarge. Chart courtesy of StockCharts.com.
It looks very much like price is in a smaller consolidation within a possible upwards trend. It may also be a slow start to a downwards swing within the larger consolidation identified on the weekly TA chart.
For the short term, volume during this consolidation suggests an upwards breakout.
Support at On Balance Volume may halt the fall in price very soon. A break below the purple trend line would be a weak bearish signal, as would a break below the yellow line. These lines are not often tested enough to offer reasonable technical significance.
GDX DAILY CHART
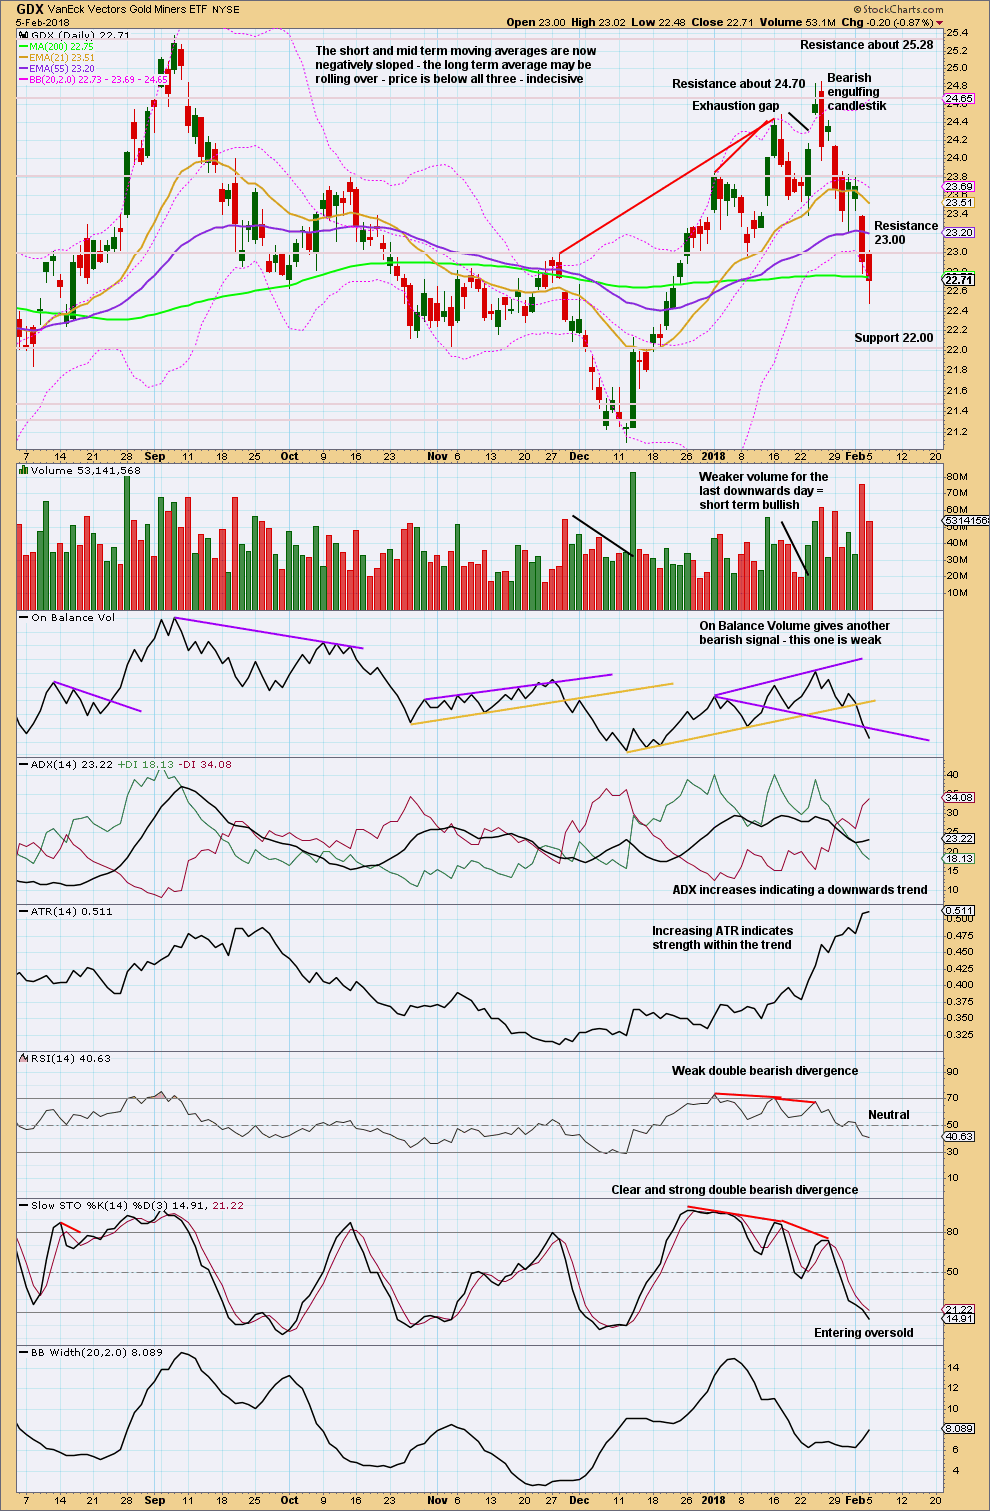
Click chart to enlarge. Chart courtesy of StockCharts.com.
While Gold is moving sideways and slightly lower, GDX is having a sharper pullback. The long lower wick today and lighter volume suggest a sideways day or bounce tomorrow.
Published @ 08:29 p.m. EST.
Thanks so much guys. I have been patiently awaiting a high probability entry and it looks like one may be just ahead. Outstanding analysis!
A very nice reaction down from that trend line. This is the correct chart so far.
Remember, when the zigzag down is complete then I’ll also have a count which moves the degree of labelling down one. This may be only minute a within minor B.
If minute a is subdividing as a zigzag, then minor B may be either a flat, triangle, combination or double zigzag.
A flat, triangle and combination are all sideways corrections. They are analogous to range bound consolidations.
A double zigzag is more analogous to a quicker sharper pullback.
Looking at this so far on the weekly chart it does not look like minor wave B could be even halfway through. If it takes a fair bit longer yet then it would have a better look.
Doesn’t mean it has to last as long as I’m anticipating, only that if it did it would have the best look. I’ll consider all possibilities.
At 1,284 minute c would = 1.618 X minute a.
At 1,286 minor B would be 0.618 of minor A.
So a new target for downwards movement calculated at two degrees is 1,286 -1,284. For the short term, to possibly be met this week or early next week.
Similar count for GDXJ
https://www.tradingview.com/x/C7lve2g8/
Also a nice wave count. All looks valid, no rules broken and no rare structures.
So it’s been awhile since I’ve updated my GDX count. With inflation picking up, I still think a bullish breakout is most likely.
The months long sideways movement still looks like it has a high probability of being part of a triangle.
If this is correct, a strong move up to new highs may start when the E wave down completes. This should fit well with Lara’s bullish Gold count
https://www.tradingview.com/x/jAjNj1GL/
Thank you very much Dreamer for sharing. It’s always fantastic to be positioned prior to a breakout if / when we can have high confidence on the direction.
Nice wave count. Looks good to me 🙂
Thanks. It’s always good when you don’t find any issues with a count!
The longer the consolidation, the bigger the move. Hoping that describes this scenario. I think some folks are going to be surprised how fast the price moves up. Likely similar to the 6 month move up in 2016. 🤑
Agreed. The longer the consolidation, the stronger and longer the following move out of it. A nice solid TA concept.
What does volume have to say? Which days during the consolidation are strongest?
Another simple TA technique to identify the most likely breakout direction.