
Price continues to move lower towards the target as expected from the main Elliott wave count.
Summary: The target for this downwards wave remains at 1,286 – 1,284. About there a reversal and a strong bounce may begin.
The mid term picture still expects that Gold is within a B wave correction which may continue for several weeks.
Only a new low below 1,236.54 would signal a strong bear market for Gold.
New updates to this analysis are in bold.
Grand SuperCycle analysis is here.
Last in-depth historic analysis with monthly and several weekly charts is here, video is here.
There are multiple wave counts at this time at the weekly and monthly chart levels. In order to make this analysis manageable and accessible only two will be published on a daily basis, one bullish and one bearish. This does not mean the other possibilities may not be correct, only that publication of them all each day is too much to digest. At this stage, they do not diverge from the two possibilities below.
BULLISH ELLIOTT WAVE COUNT
FIRST WEEKLY CHART
Click chart to enlarge.
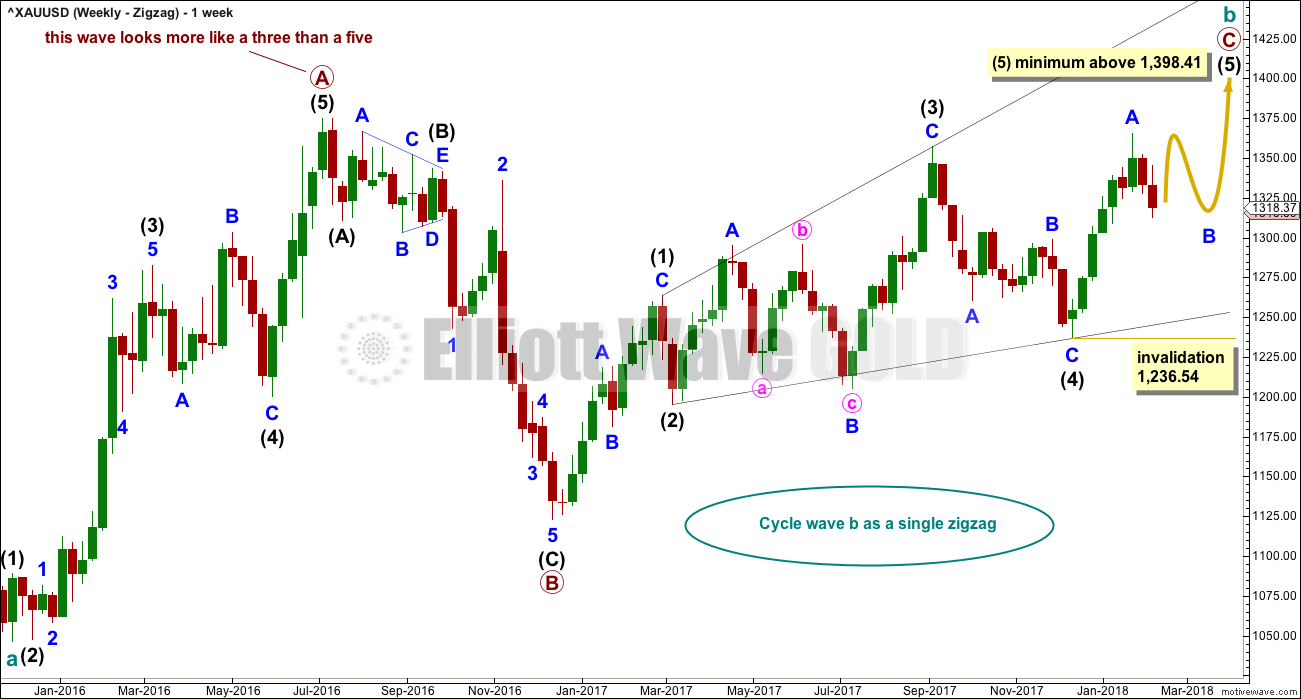
Cycle wave b may be a single zigzag. Zigzags subdivide 5-3-5. Primary wave C must subdivide as a five wave structure and may be either an impulse or an ending diagonal. Overlapping at this stage indicates an ending diagonal.
Within an ending diagonal, all sub-waves must subdivide as zigzags. Intermediate wave (4) must overlap into intermediate wave (1) price territory. This diagonal is expanding: intermediate wave (3) is longer than intermediate wave (1) and intermediate wave (4) is longer than intermediate wave (2). Intermediate wave (5) must be longer than intermediate wave (3), so it must end above 1,398.41 where it would reach equality in length with intermediate wave (3).
Within the final zigzag of intermediate wave (5), minor wave B may not move beyond the start of minor wave A below 1,236.54.
Within intermediate wave (1), the correction labelled minor wave B was over within one week. Within intermediate wave (2), the correction labelled minor wave B was too quick to be seen on the weekly chart. Within intermediate wave (3), the correction labelled minor wave B was over in 12 weeks, one short of a Fibonacci 13. Within intermediate wave (4), the correction labelled minor wave B was over in a Fibonacci 8 weeks. As each actionary wave is extending in time as well as price, the correction of minor wave B within intermediate wave (5) may be longer than that within intermediate wave (3). At this early stage, a Fibonacci 13 or possibly even 21 weeks may be expected. This expectation is a rough guideline; flexibility is essential when B waves unfold.
This first weekly chart sees the upwards wave labelled primary wave A as a five wave structure. It must be acknowledged that this upwards wave looks better as a three than it does as a five. The fifth weekly chart below will consider the possibility that it was a three.
FIRST DAILY CHART
Click chart to enlarge.
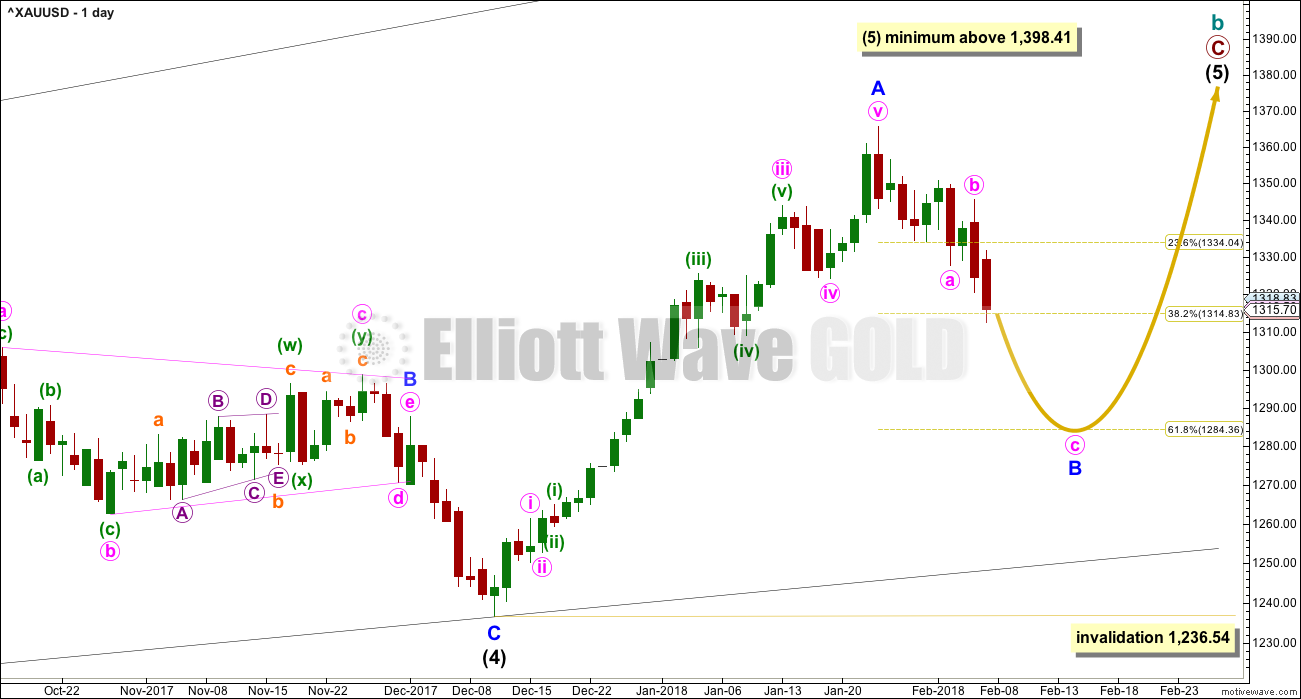
Within the ending diagonal, intermediate wave (5) must sub-divide as a zigzag.
Minor wave B may be a reasonably time consuming consolidation or a quicker sharper pullback within the upwards trend, and it may end about either of the 0.382 or 0.618 Fibonacci ratios (neither may be favoured).
There are more than 23 possible structures that minor wave B may take, and it is impossible until close to or at the end to have confidence which possibility has unfolded. When B waves unfold, it is essential that analysis is flexible. B waves are analogous to either range bound consolidations or sharp corrections. As minor wave B unfolds, the labelling on the hourly chart for its sub-waves will change and alternates will be required from time to time.
The yellow arrow outlines the possible pathway for a zigzag for minor wave B. Again, this does not mean this is how price must move within this correction. Minor wave B may still be an expanded flat, triangle or combination. The 0.382 and 0.618 Fibonacci ratios of minor wave A are still targets for minor wave B, and neither are at this time favoured.
Minor wave B may not move beyond the start of minor wave A below 1,236.54.
HOURLY CHART
Click chart to enlarge.
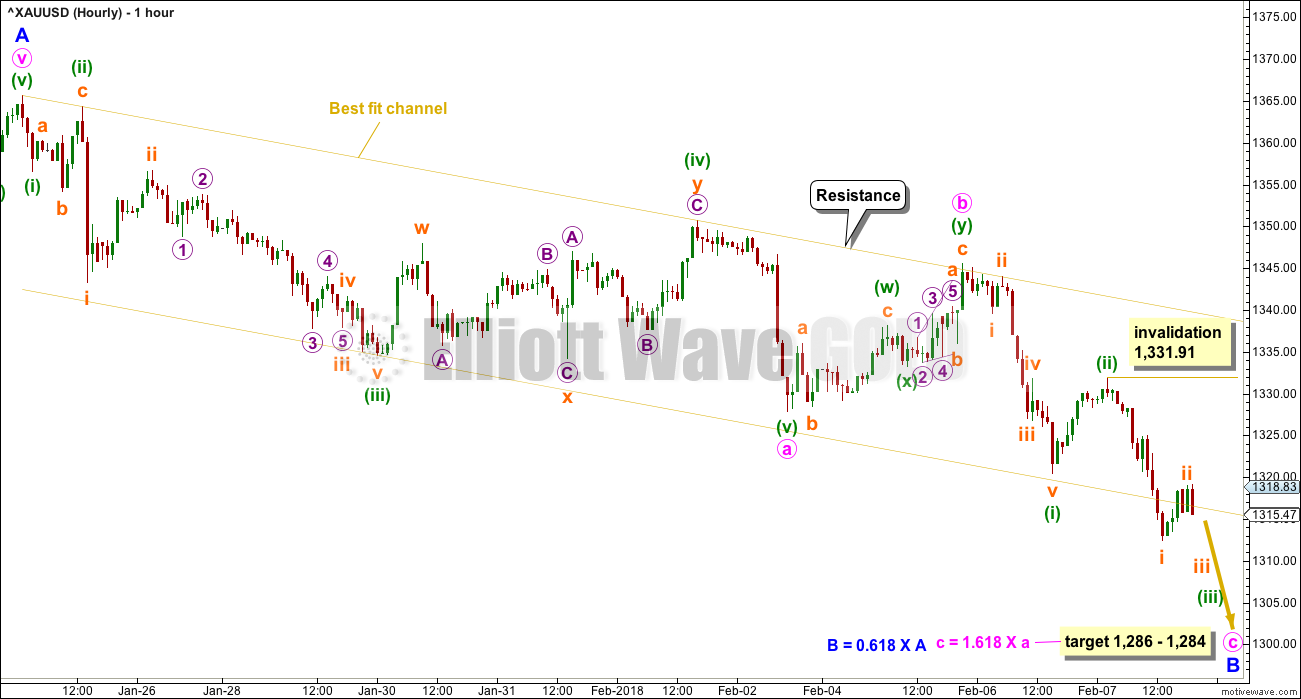
Assume that price should continue lower while it remains below the upper edge of the yellow best fit channel.
It is possible that a zigzag is unfolding lower. Within the zigzag, minute waves a and b may be complete. Minute wave c may continue lower and may have either passed the middle strongest portion or may see a further increase in downwards momentum.
The target remains the same, a $2 zone calculated at two wave degrees.
Minute wave c must subdivide as a five wave structure. It may be unfolding as an impulse. Within the impulse, there may be two first and second waves complete for minuette waves (i) and (ii), and now subminuette waves i and ii. Alternatively, the degree of labelling for subminuette wave i may be moved up one degree; this may be the end of minuette wave (iii).
Subminuette wave ii may not move beyond the start of subminuette wave i above 1,331.91.
If price does continue lower as this wave count expects, and a zigzag downwards does complete, then another idea will be published which moves the degree of labelling within the entire zigzag all down one degree. This zigzag may not be minor wave B in its entirety and may only be minute wave a within minor wave B.
ALTERNATE HOURLY CHART
Click chart to enlarge.
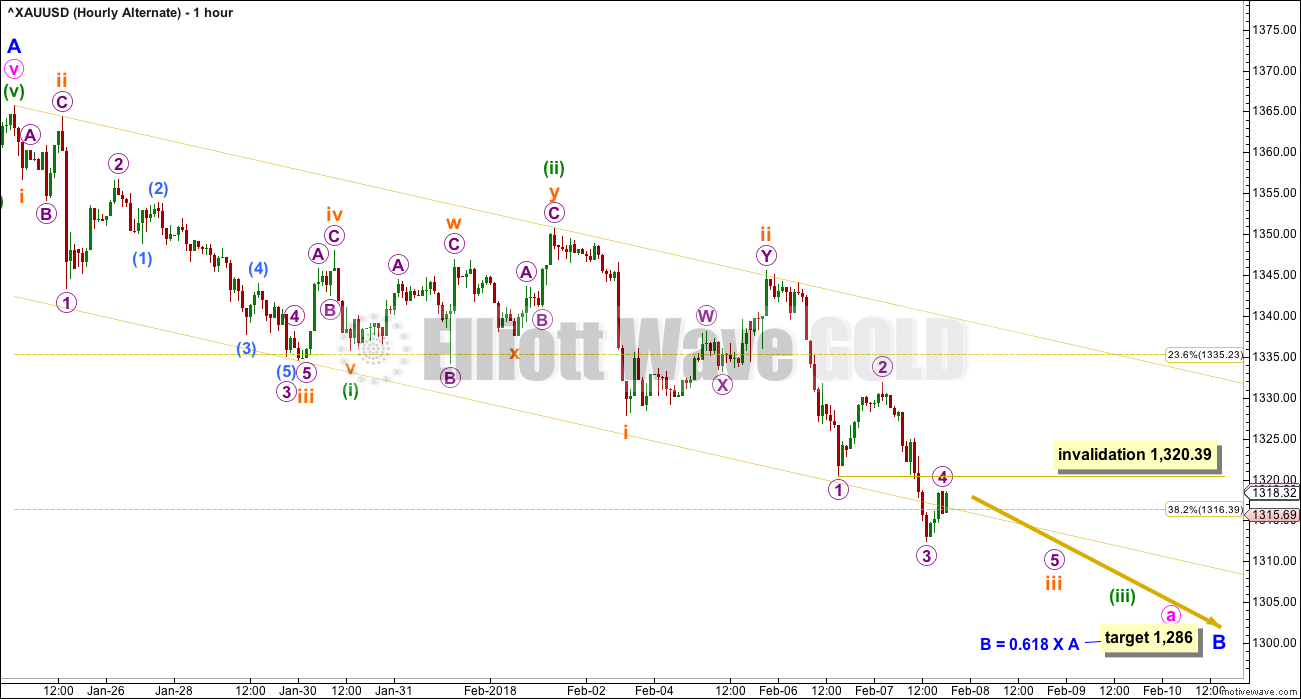
An impulse downwards may be continuing. This may be minute wave a within a zigzag for minute wave b.
The middle of the impulse may have passed today. If this is correct, then micro wave 4 may not move into micro wave 1 price territory above 1,320.39.
When minute wave a completes, then minute wave b should unfold. Minute wave b may be a quick sharp bounce, or it may be a very complicated time consuming sideways movement. It may not move beyond the start of minute wave a.
The final target for minor wave B is still the same.
BEARISH ELLIOTT WAVE COUNT
FIFTH WEEKLY CHART
Click chart to enlarge.
There were five weekly charts published in the last historic analysis. This fifth weekly chart is the most immediately bearish wave count, so this is published as a bearish possibility.
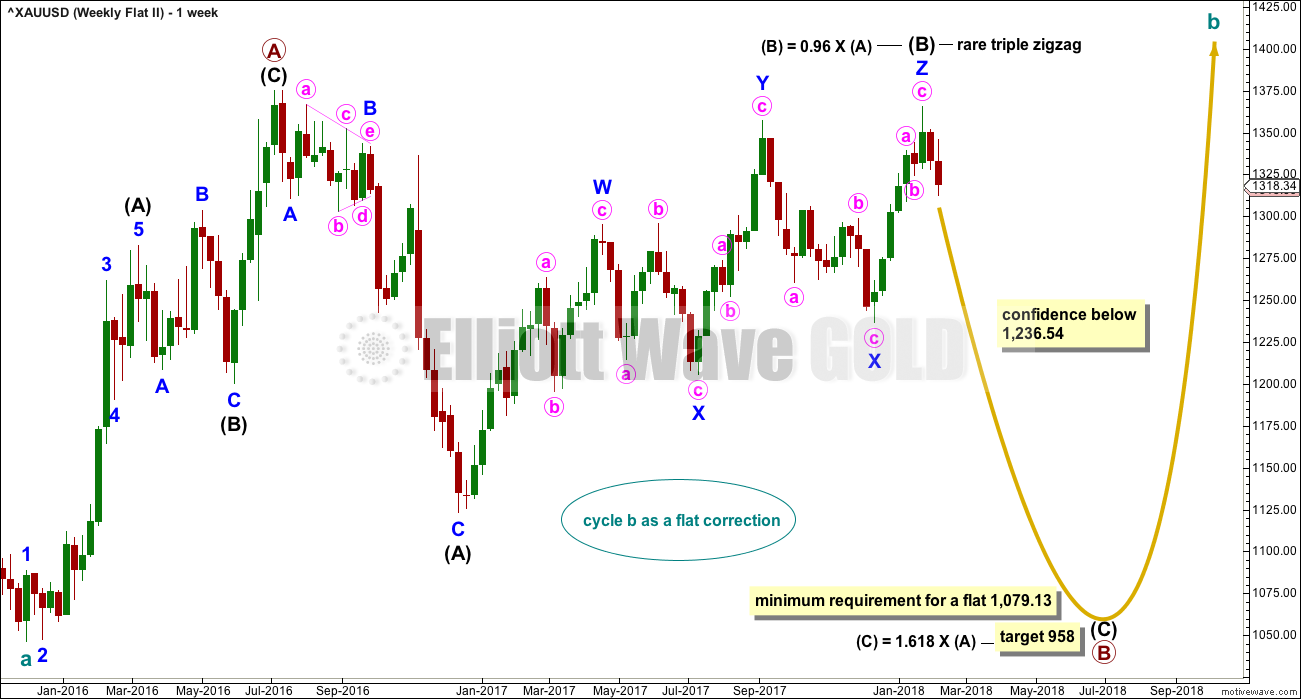
This fifth weekly chart sees cycle wave b as a flat correction, and within it intermediate wave (B) may be a complete triple zigzag. This would indicate a regular flat as intermediate wave (B) is less than 1.05 the length of intermediate wave (A).
If cycle wave b is a flat correction, then within it primary wave B must retrace a minimum 0.9 length of primary wave A at 1,079.13 or below. The most common length of B waves within flats is from 1 to 1.38 times the length of the A wave. The target calculated would see primary wave B end within this range.
I have only seen two triple zigzags before during my 10 years of daily Elliott wave analysis. If this wave count turns out to be correct, this would be the third. The rarity of this structure is identified on the chart.
TECHNICAL ANALYSIS
WEEKLY CHART
Click chart to enlarge. Chart courtesy of StockCharts.com.
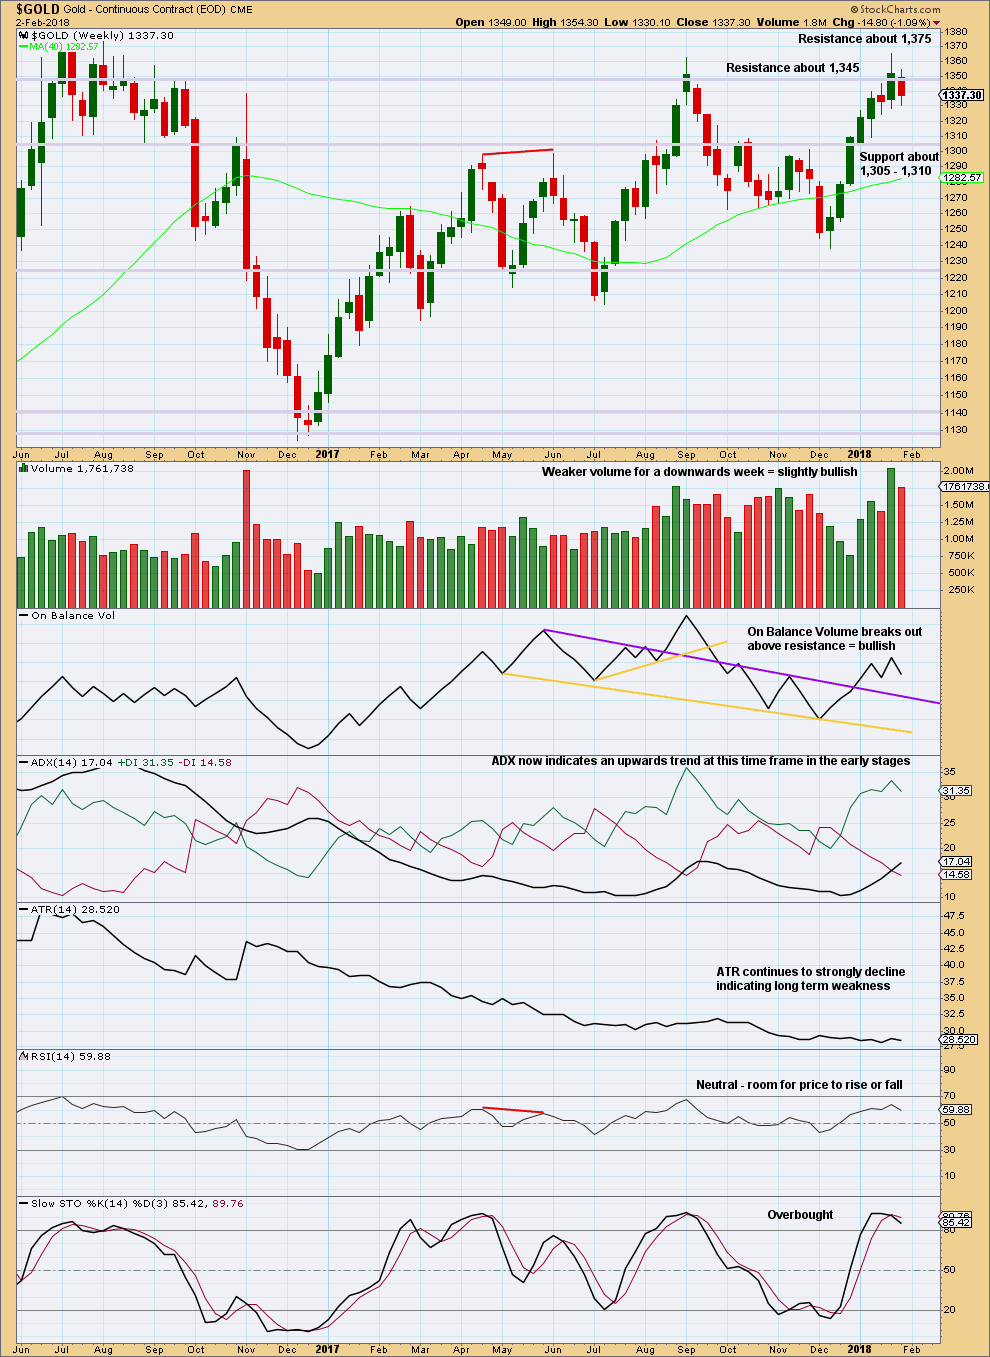
Again, price could not remain above resistance at 1,345 and has closed back below this point. Price remains range bound at this time frame with resistance about 1,378 and support about 1,225. During this consolidation, it is now an upwards week that has strongest volume suggesting an upwards breakout may be more likely than downwards.
Last week’s upwards movement had strong support from volume. This week’s downwards movement does not. The short term volume profile remains bullish.
However, with price at resistance and Stochastics overbought, it would be reasonable to expect an end to the upwards swing here and a downwards swing to support.
DAILY CHART
Click chart to enlarge. Chart courtesy of StockCharts.com.
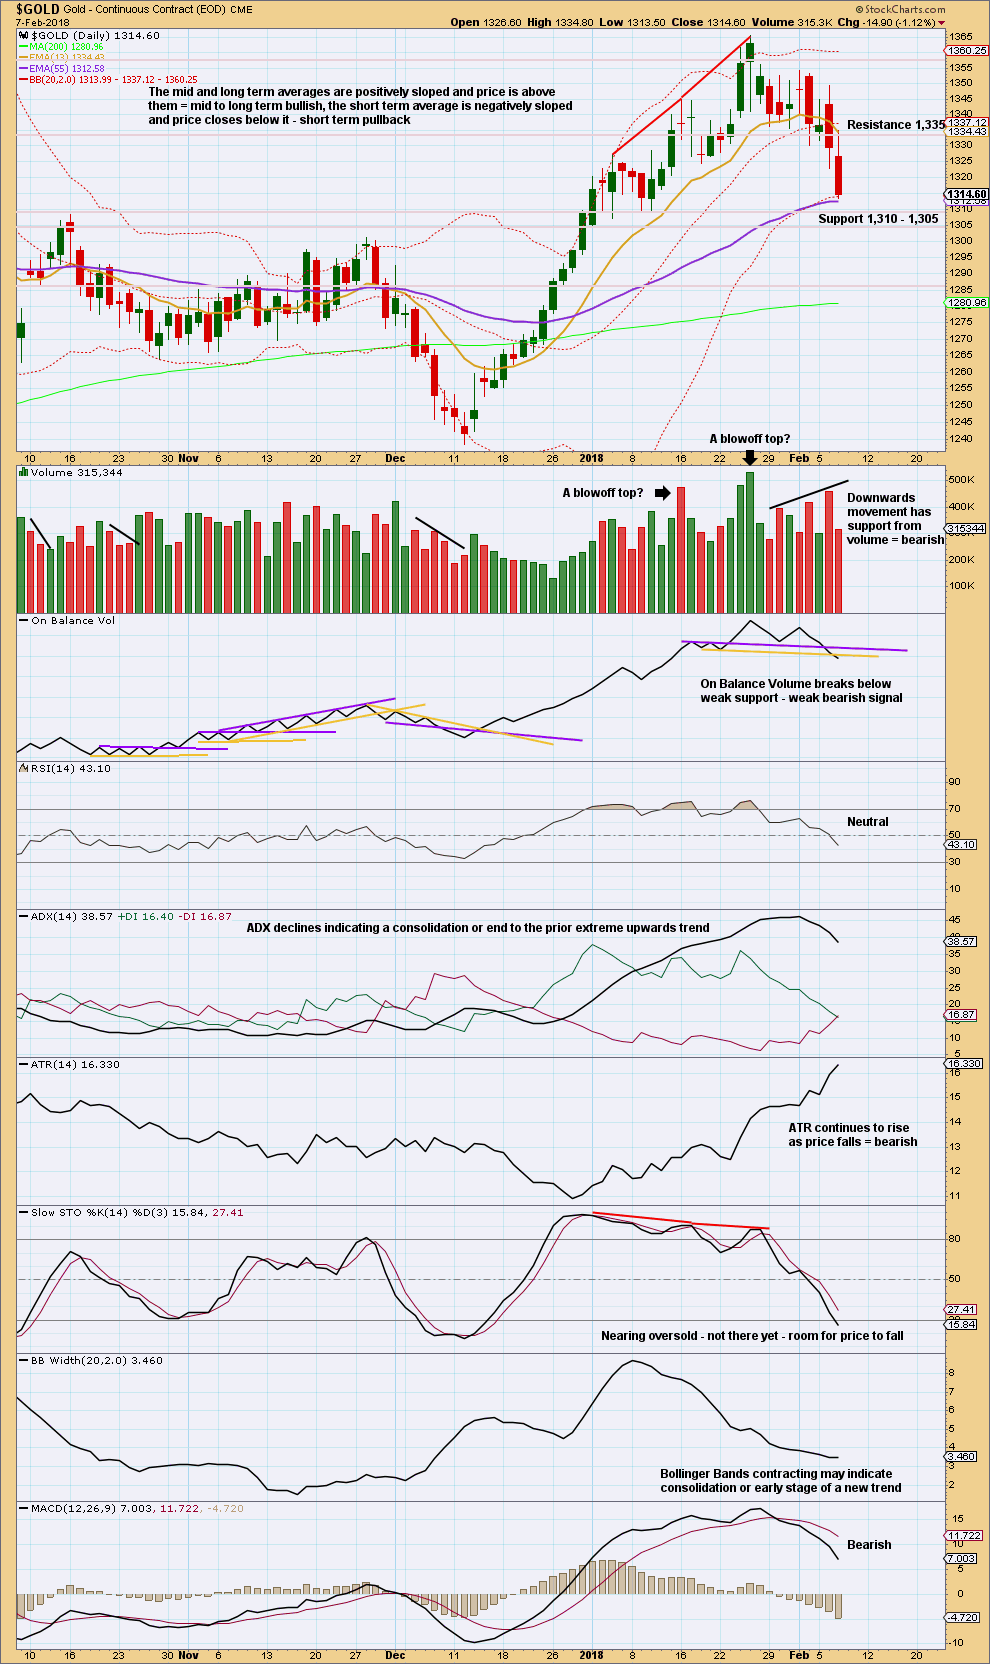
Downwards movement overall has support from volume, although not for the last session. The long upper wick on this candlestick is bearish.
Look for price to continue lower until it finds support and Stochastics reaches oversold (stochastics is at this time almost oversold). Next support for price is about 1,310 – 1,305, which is now fairly close by.
GDX DAILY CHART
Click chart to enlarge. Chart courtesy of StockCharts.com.
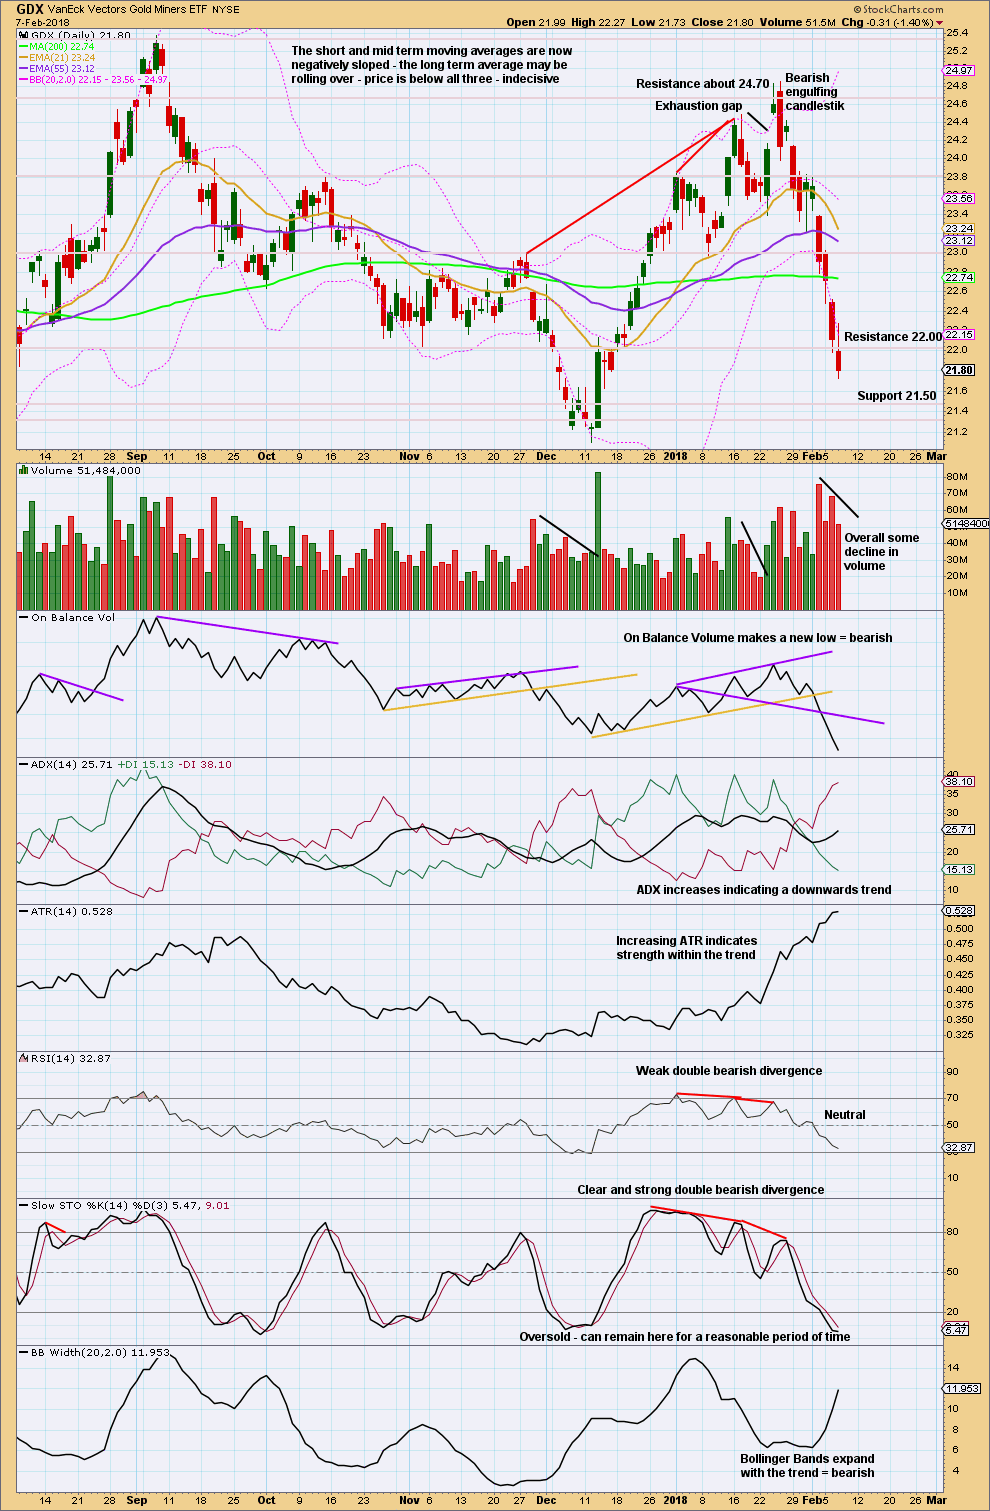
The downwards trend is not yet extreme and Stochastics and RSI indicate there is further room for price to fall.
Next support is about 21.50. Below that next support is about 21.30.
Published @ 08:05 p.m. EST.
Ute, thanks for sharing your charts. Keep posting and with Lara’s guidance, soon your charts will meet all the EW rules 😀
Thank you very much Ute Hansen for sharing your EW charts and ideas.
That’s another feature of this membership, I’m here to provide feedback on your EW counts.
And also, sometimes members publish charts here with new ideas and I can see something I hadn’t considered before, which adds to the analysis.
So thank you.
The number of structural possibilities right now for minor B is still substantial.
We have to be open to these multiple possibilities.
From a classic TA perspective, price remains range bound, a smaller consolidation is still underway. We need a classic breakout, in either direction, with support from volume (especially an upwards breakout, not necessarily a downwards breakout) in order to have clarity that the consolidation is over and the next trend or wave has begun.
That’s the approach using a classic TA analysis.
What I’ll be trying to do for you using EW is to add more depth by trying to identify:
1. when the consolidation may be a complete EW corrective structure PRIOR to the breakout
2. and what price point should exactly tell us the structure must be complete and the next wave is underway, close to but still possibly prior to the actual breakout
OR this.
While price remains below 1,327.81 and still within that yellow channel, assume the downwards trend may remain intact for now.
A zigzag downwards may now be complete. It is possible that it could be minor B in its entirety….
…. but it is also entirely possible that the zigzag may be only minute wave a within minor wave B.
When A waves subdivide as threes, then the corrective structure may be either a flat, triangle or combination.
Both flats and triangles have B waves which are very deep.
Combinations have X waves which are deep.
But double zigzags have X waves which are usually brief and shallow. Shallow being more important.
minuettes
It’s correctly termed a “diagonal” not a triangle.If your count suggests a diagonal then you need to put the trend lines on it to signify that structure.
Is a leading diagonal for minute a your intention here?
Put the trend lines in and look at it on the hourly chart. I think you’ll find that much of minuette (v) sits above the (i)-(iii) trend line. It looks all wrong.
I don’t think a leading diagonal ended at the low of 1,336.01 on 29th of January.
Hello, because of the rule of retracement a made a new count. the Minute wave b retraced 50%. I look for the Minuetta of wave a and send two new charts for you. Ute
I see you worked out what was wrong with the first chart below 🙂
But now you have fourth waves overlapping into first wave price territories.
Within minute a, move the low of minuette (i) to the left, making minuette (ii) a flat. Now minuette (iv) does not overlap minuette (i) territory.
But the problem of an overlap within minute c remains. Unless you’re seeing it as an ending diagonal… which means all sub waves must subdivide into zigzags. But you’re labelling minuette (v) as an impulse so not meeting the rules.
Hello, this count could also make sense. Often the daily Pivots are supportlines. Of couse (iii) of c could divide. So this ist the shortest way to count wave c. Could you agree with the count? Ute
I can’t agree with it because it violates an EW rule.
When the A wave subdivides as a three then the structure may only be a flat or a triangle.
Clearly this is not a triangle, and does not meet the rules for a triangle.
It’s also not a flat because in your count wave B is much less than 0.9 the length of wave A. Violating the EW rule for a flat.