
Upwards movement continues as this analysis expects. A new alternate hourly Elliott wave count is considered today.
Summary: Expect overall upwards movement this week; momentum may increase in the next day or so. The target is at 1,391, but this may be too high. For the very short term, if price breaks below the orange base channel on the first daily chart and main hourly chart, then look out for another test of support about 1,310 – 1,305.
New updates to this analysis are in bold.
Grand SuperCycle analysis is here.
Last in-depth historic analysis with monthly and several weekly charts is here, video is here.
There are multiple wave counts at this time at the weekly and monthly chart levels. In order to make this analysis manageable and accessible only two will be published on a daily basis, one bullish and one bearish. This does not mean the other possibilities may not be correct, only that publication of them all each day is too much to digest. At this stage, they do not diverge from the two possibilities below.
BULLISH ELLIOTT WAVE COUNT
FIRST WEEKLY CHART
Click chart to enlarge.
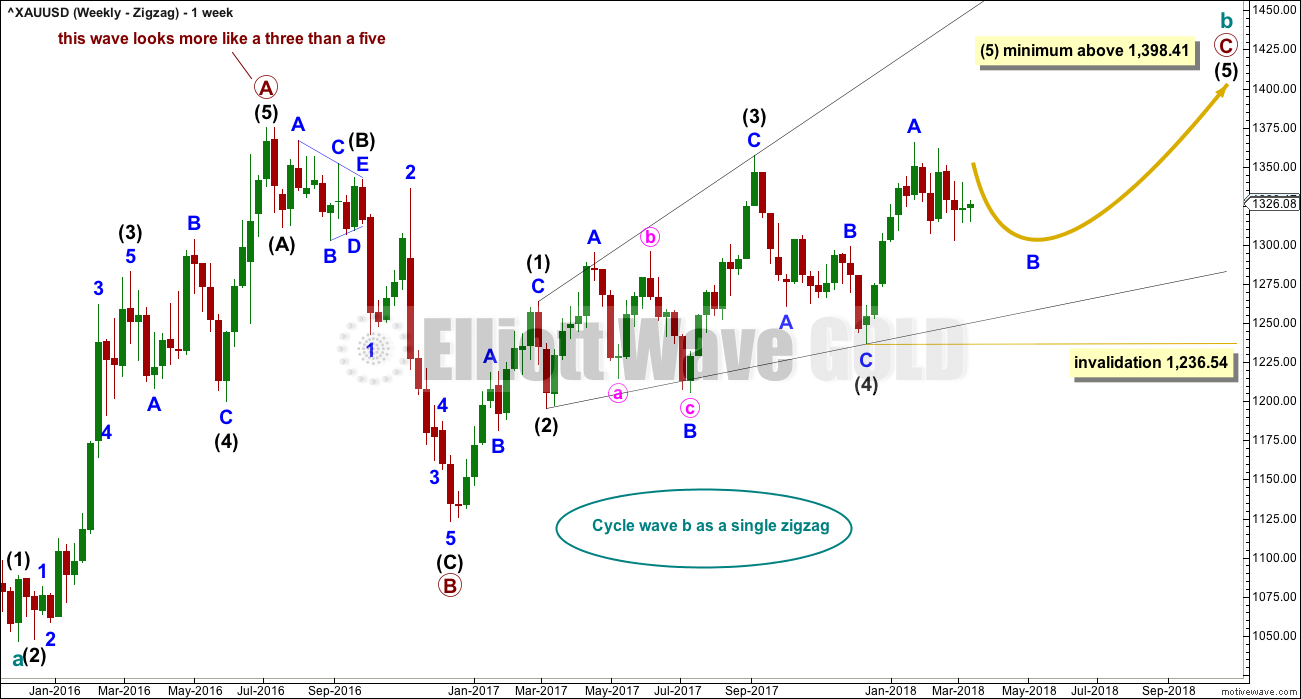
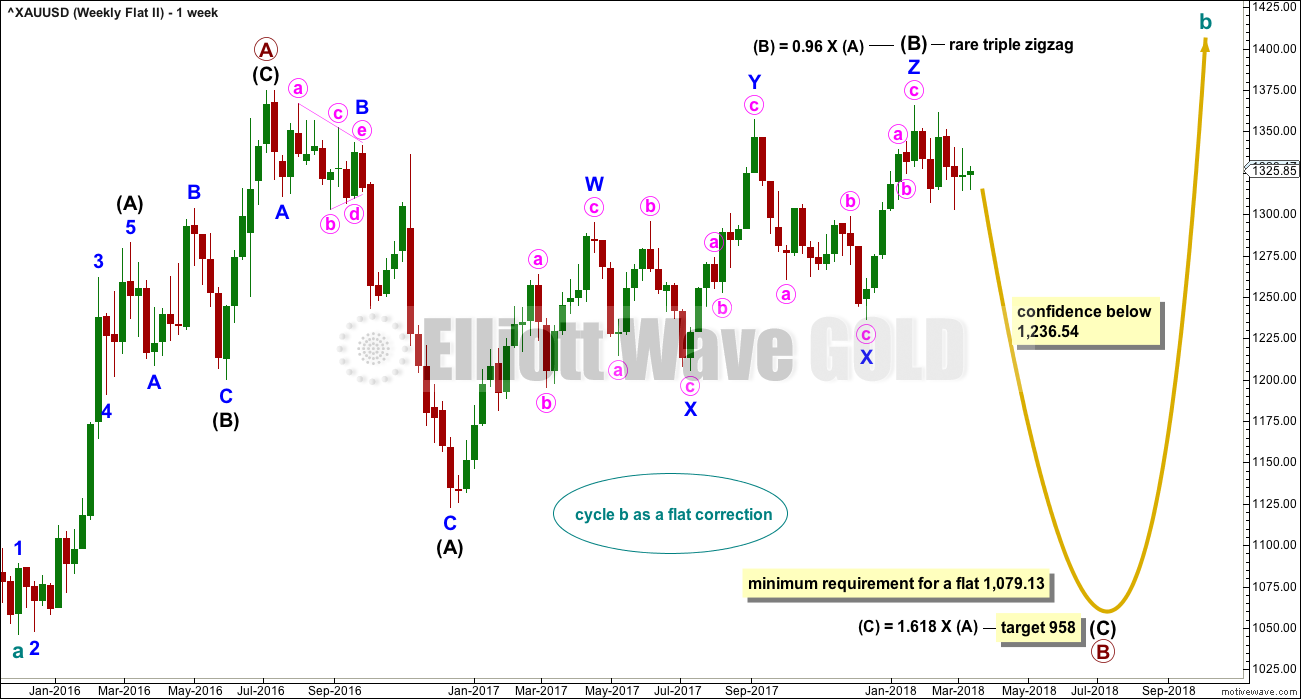
Cycle wave b may be a single zigzag. Zigzags subdivide 5-3-5. Primary wave C must subdivide as a five wave structure and may be either an impulse or an ending diagonal. Overlapping at this stage indicates an ending diagonal.
Within an ending diagonal, all sub-waves must subdivide as zigzags. Intermediate wave (4) must overlap into intermediate wave (1) price territory. This diagonal is expanding: intermediate wave (3) is longer than intermediate wave (1) and intermediate wave (4) is longer than intermediate wave (2). Intermediate wave (5) must be longer than intermediate wave (3), so it must end above 1,398.41 where it would reach equality in length with intermediate wave (3).
Within the final zigzag of intermediate wave (5), minor wave B may not move beyond the start of minor wave A below 1,236.54.
Within the diagonal of primary wave C, each sub-wave is extending in price and so may also do so in time. Within each zigzag, minor wave B may exhibit alternation in structure and may show an increased duration.
Within intermediate wave (1), minor wave B was a triangle lasting 11 days. Within intermediate wave (2), minor wave B was a zigzag lasting 2 days. Within intermediate wave (3), minor wave B was a regular flat lasting 60 days. Within intermediate wave (4), minor wave B was a regular contracting triangle lasting 40 days. Within intermediate wave (5), minor wave B may be expected to be an expanded flat, combination or running triangle to exhibit some alternation in structure. It may last as long as 40 to 60 days. So far it has lasted 29 days and the structure is incomplete.
This first weekly chart sees the upwards wave labelled primary wave A as a five wave structure. It must be acknowledged that this upwards wave looks better as a three than it does as a five. The fifth weekly chart below will consider the possibility that it was a three.
FIRST DAILY CHART
Click chart to enlarge.
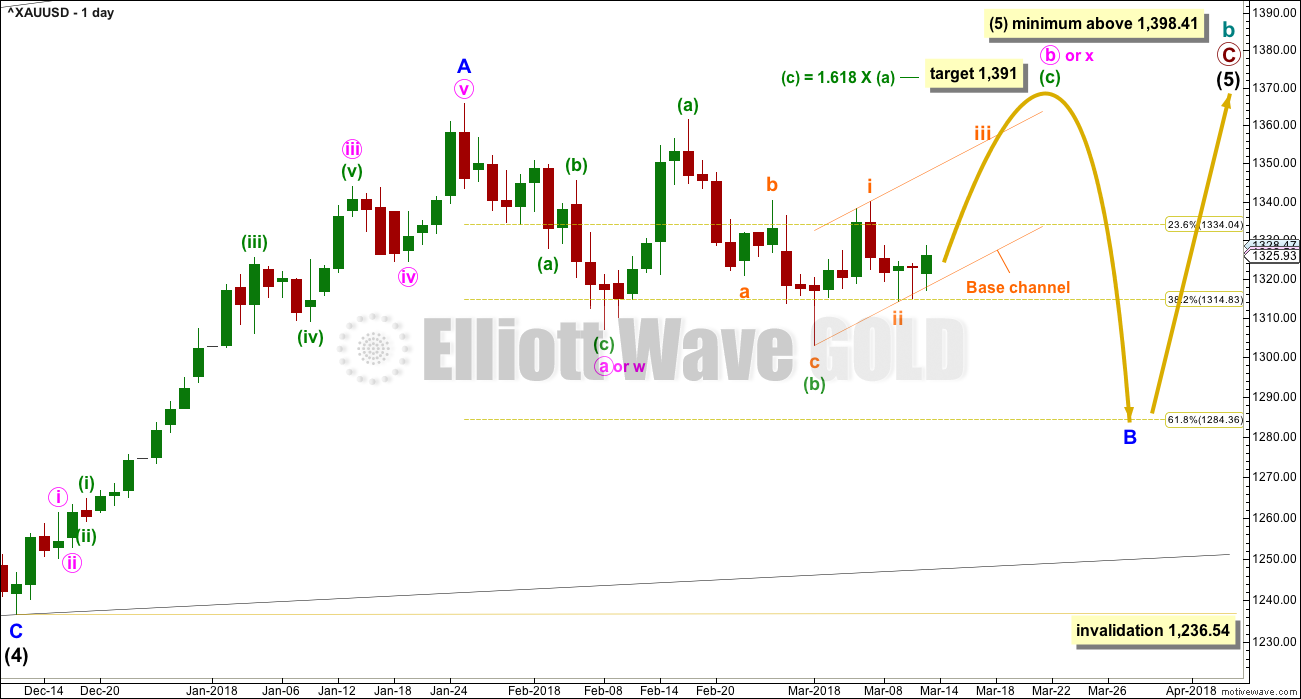
Within the ending diagonal, intermediate wave (5) must sub-divide as a zigzag.
Minor wave B may now be either a flat or a combination. If the last low now labelled minuette wave (b) is the end of minute wave a as a double zigzag, then minor wave B may still be a triangle. If the current upwards swing completes and looks like a zigzag, then this possibility would be published as an alternate.
Within either a flat or combination for minor wave B, the correction of minute wave b or x is unfolding as an expanded flat correction. When this expanded flat is complete, then a downwards swing for minute wave c or y would be expected.
Because both options of a flat or combination for minor wave B now expect minute wave b or x to be completing as an expanded flat, they both need to see a five up complete for minuette wave (c). Two hourly charts are published today and both see the high of subminuette wave i at the same point. The first hourly chart considers the possibility that subminuette wave ii may be over. The second hourly chart considers the possibility that it may continue lower.
A base channel is drawn about subminuette waves i and ii. While price continues to find support at the lower edge and remains within the channel, the first hourly chart will be favoured.
If minor wave B is unfolding as a flat correction, then minute wave c may move reasonably below the low of minute wave a at 1,307.09 and must be a five wave structure.
If minor wave B is unfolding as a combination, then minute wave y may be a flat or triangle and may end about the same level as minute wave w at 1,307.09.
HOURLY CHART
Click chart to enlarge.
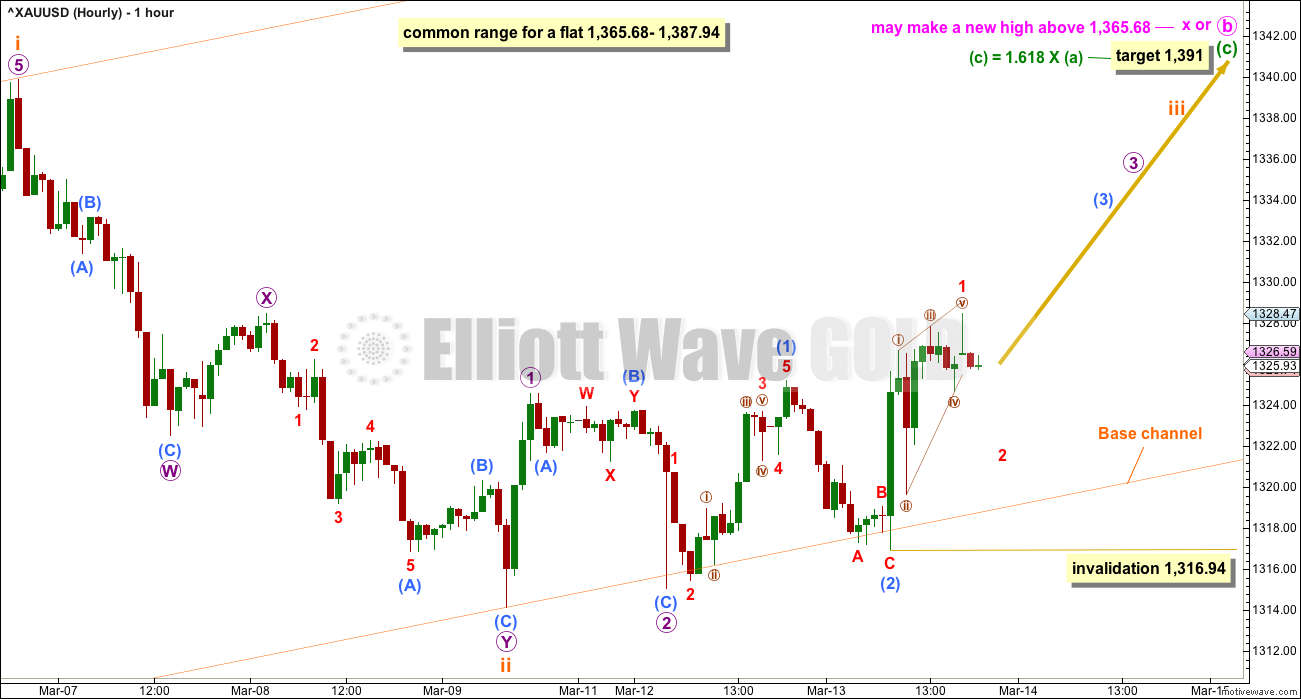
Minuette wave (c) upwards should be a five wave structure. It may take a few days to unfold.
Subminuette wave iii may have begun, and micro waves 1 and 2 may be complete. This wave count now expects a third wave up at four low degrees may begin. This may unfold with an increased upwards momentum and support from volume.
This first hourly chart remains valid and remains the preferred wave count. Although there is choppy overlapping movement to start subminuette wave iii, this can be how third waves begin. The base channel is about where price continues to find support. There are small overshoots, but the channel is not breached. Assume this first wave count may be correct, and look out for a strong upwards move, while price remains above the lower trend line.
If price breaks below the lower edge of the channel with at least one full hourly candlestick below and not touching the lower trend line, preferably with clear downwards movement (not sideways), then the alternate hourly chart below may be correct.
Within the middle of the third wave, minuscule wave 2 may not move beyond the start of minuscule wave 1 below 1,316.94.
Subminuette wave iii must make a new high above the high of subminuette wave i at 1,339.89. The final target of minuette wave (c) remains the same.
ALTERNATE HOURLY CHART
Click chart to enlarge.
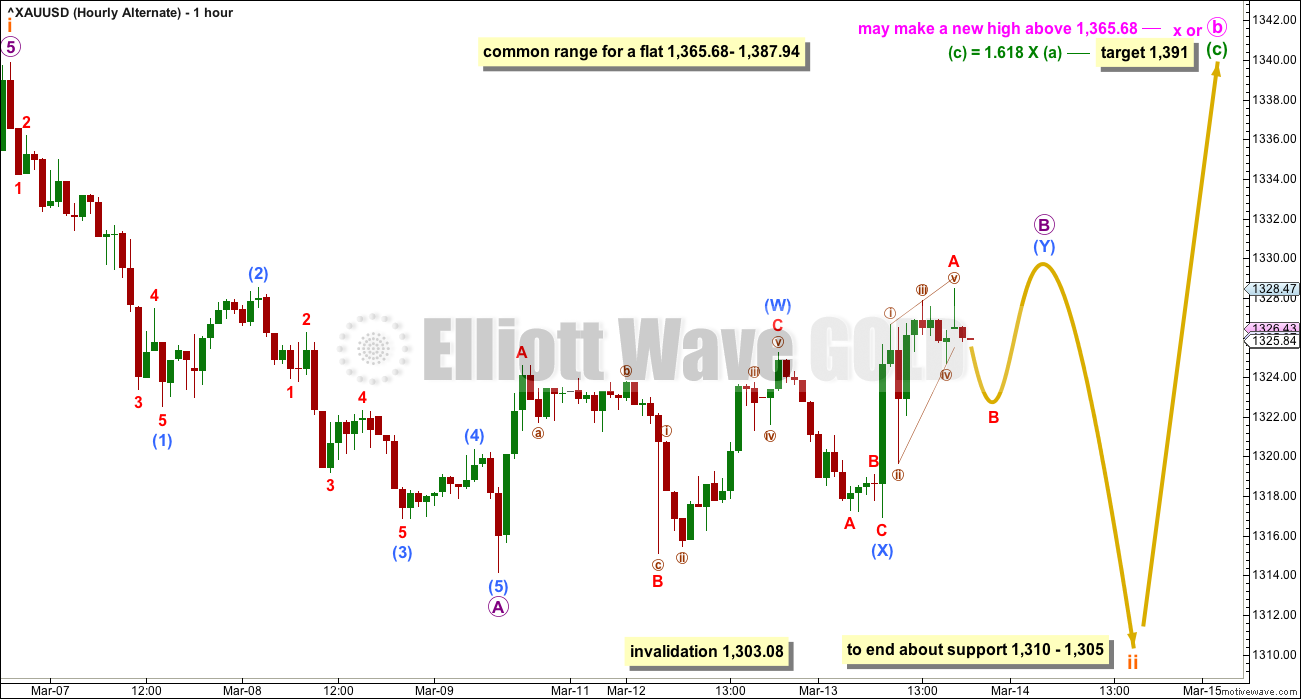
It is possible that subminuette wave ii may not be over. Upwards movement of the last two days may be micro wave B within a zigzag moving lower.
Micro wave C may bring price back down to test support, which is strong about 1,310 – 1,305.
If the base channel on the first hourly chart is breached and then price makes a new low below 1,316.94 by any amount at any time frame, then this alternate hourly chart would then be the only hourly chart remaining valid.
Subminuette wave ii may not move beyond the start of subminuette wave i below 1,303.08.
BEARISH ELLIOTT WAVE COUNT
FIFTH WEEKLY CHART
Click chart to enlarge.
There were five weekly charts published in the last historic analysis. This fifth weekly chart is the most immediately bearish wave count, so this is published as a bearish possibility.
This fifth weekly chart sees cycle wave b as a flat correction, and within it intermediate wave (B) may be a complete triple zigzag. This would indicate a regular flat as intermediate wave (B) is less than 1.05 the length of intermediate wave (A).
If cycle wave b is a flat correction, then within it primary wave B must retrace a minimum 0.9 length of primary wave A at 1,079.13 or below. The most common length of B waves within flats is from 1 to 1.38 times the length of the A wave. The target calculated would see primary wave B end within this range.
I have only seen two triple zigzags before during my 10 years of daily Elliott wave analysis. If this wave count turns out to be correct, this would be the third. The rarity of this structure is identified on the chart.
TECHNICAL ANALYSIS
WEEKLY CHART
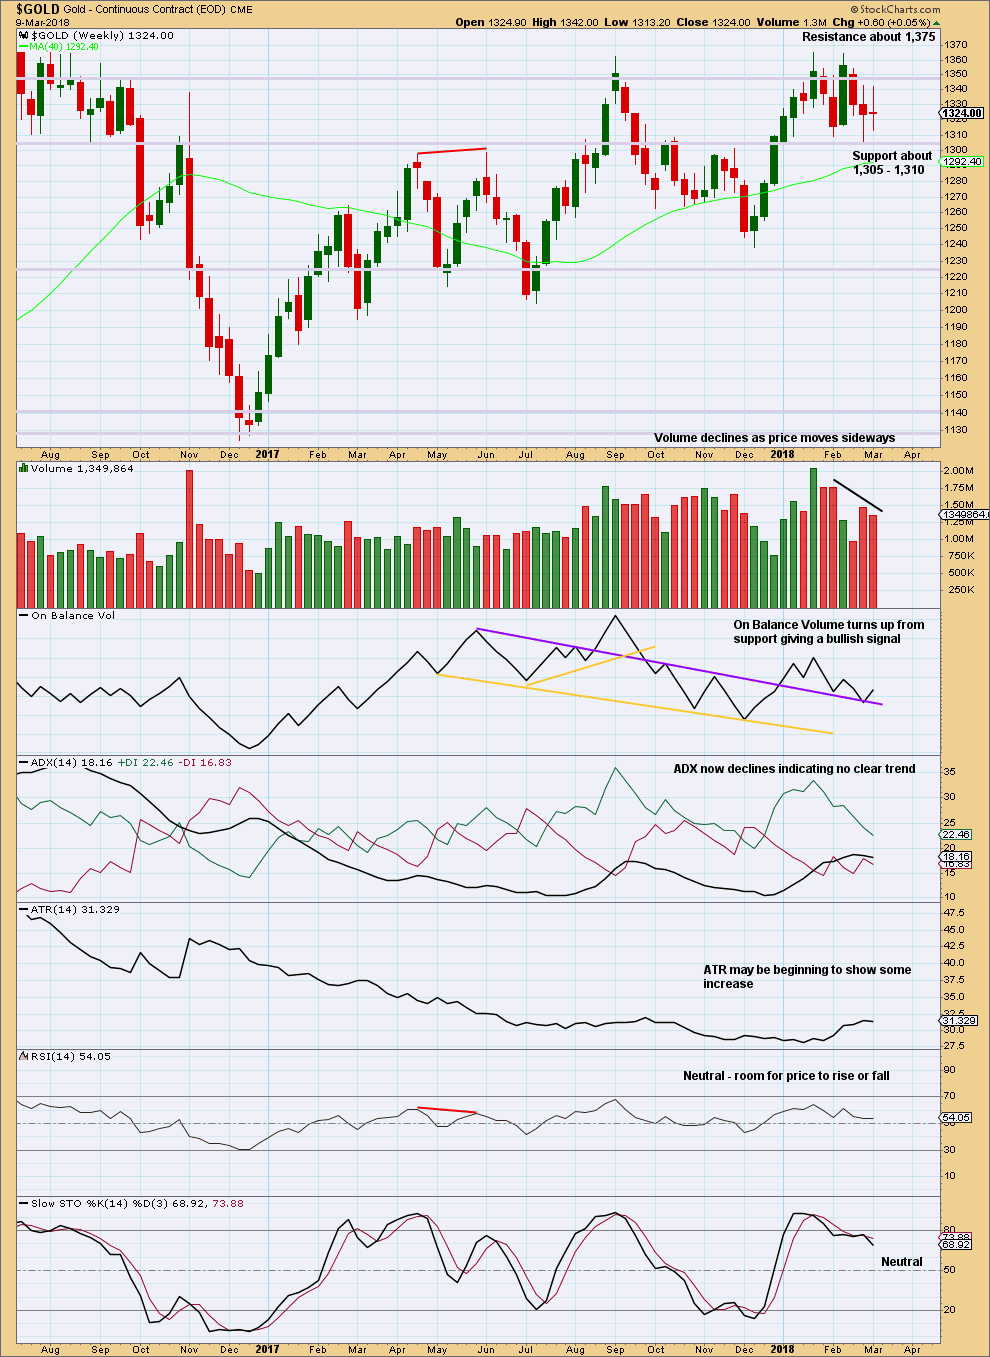
Click chart to enlarge. Chart courtesy of StockCharts.com.
It looks like price is bouncing up from support. The bullish signal this week from On Balance Volume supports the idea of an upwards swing here to resistance.
DAILY CHART
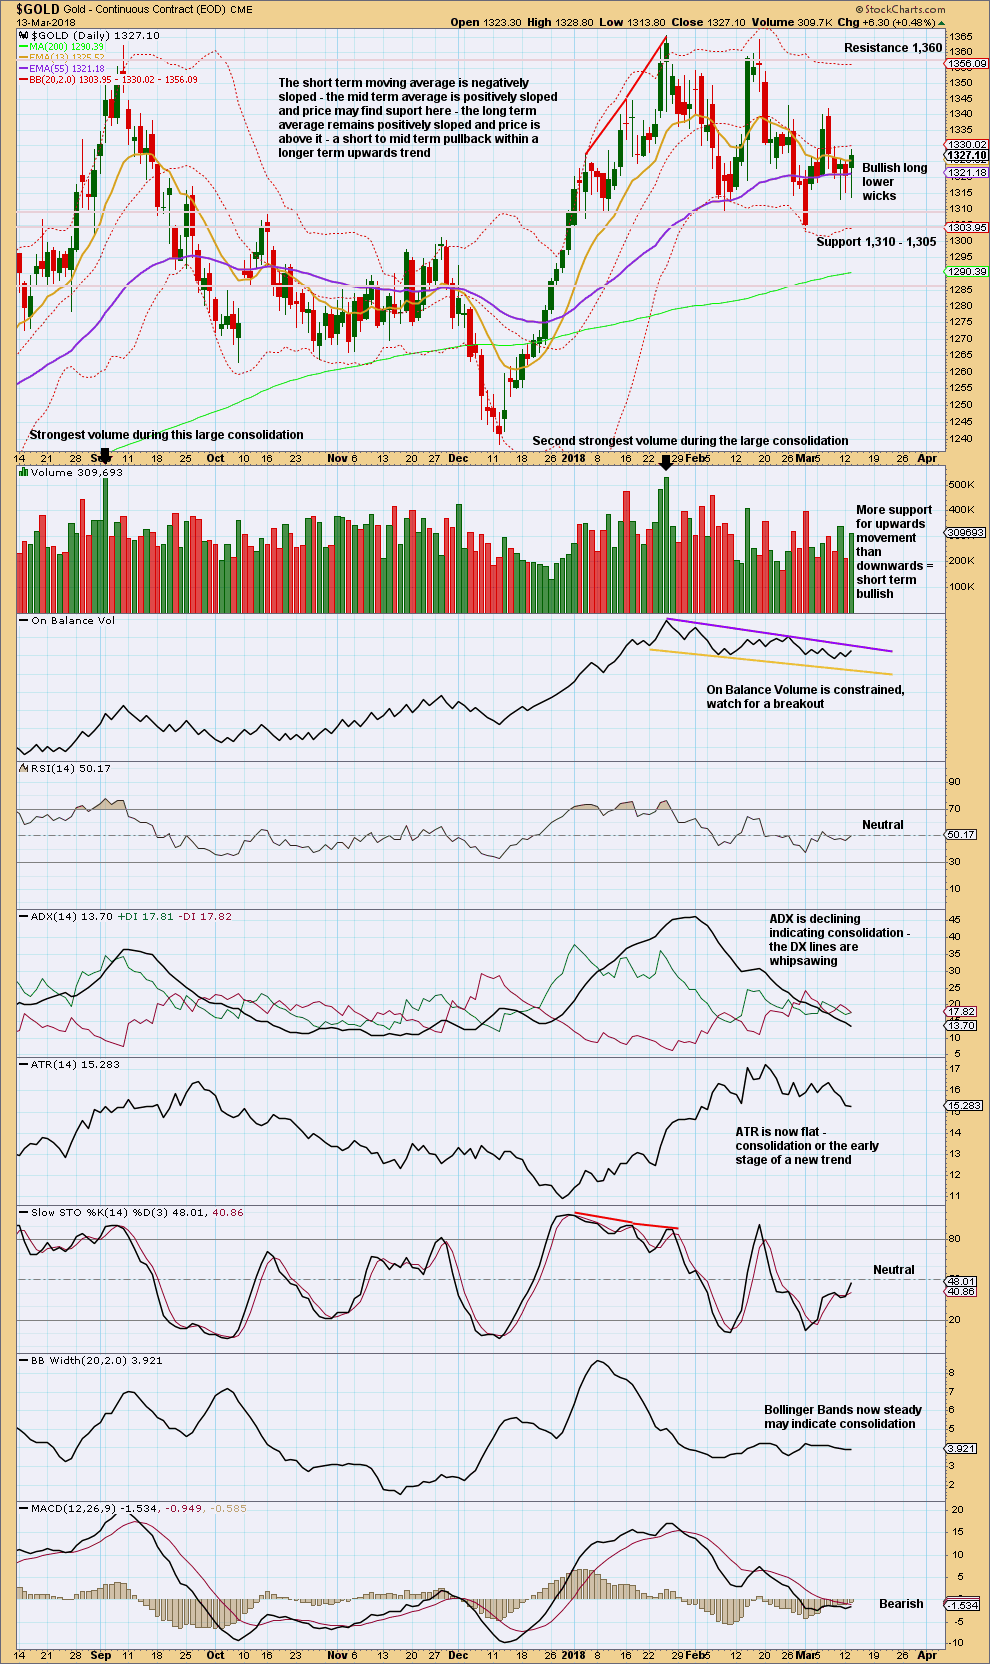
Click chart to enlarge. Chart courtesy of StockCharts.com.
Looking at the bigger picture, Gold has been within a large consolidation since about January 2017 (this chart does not show all of this large consolidation), and during this consolidation it is two upwards days that have strongest volume and an upwards week that has strongest volume. Volume suggests an upwards breakout may be more likely than downwards.
Currently, Gold is within a smaller consolidation that began in early January 2018. This consolidation is delineated by support about 1,310 to 1,305 and resistance (final) about 1,375. It is an upwards day during this smaller consolidation that has strongest volume, suggesting an upwards breakout may be more likely here than downwards.
For the short term, it still looks like price is within a choppy upwards swing from support to resistance. The short term volume profile is still bullish. There is more support from volume for the last two upwards sessions than there was for recent downwards sessions. Another long lower wick is very bullish.
GDX WEEKLY CHART
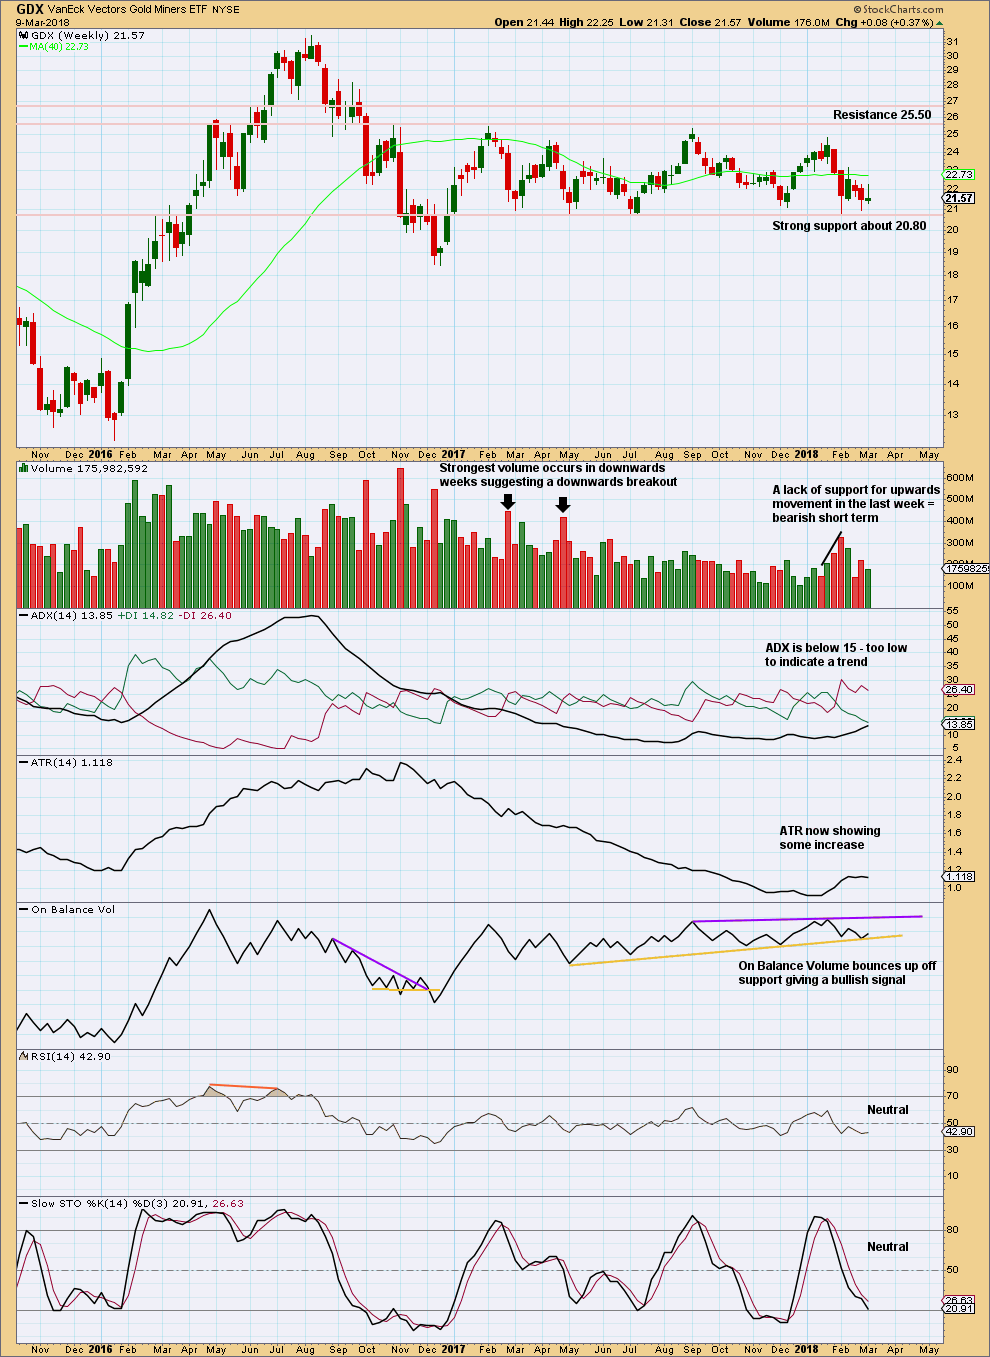
Click chart to enlarge. Chart courtesy of StockCharts.com.
Support about 20.80 has been tested about eight times and so far has held. The more often a support area is tested and holds, the more technical significance it has.
In the first instance, expect this area to continue to provide support. Only a strong downwards day, closing below support and preferably with some increase in volume, would constitute a downwards breakout from the consolidation that GDX has been in for a year now.
Resistance is about 25.50. Only a strong upwards day, closing above resistance and with support from volume, would constitute an upwards breakout.
A bullish signal from On Balance Volume will be given more weight than volume. It looks like GDX is bouncing up off support. Look for an upwards swing overall to continue to resistance, but do not expect price to move in a straight line.
GDX DAILY CHART
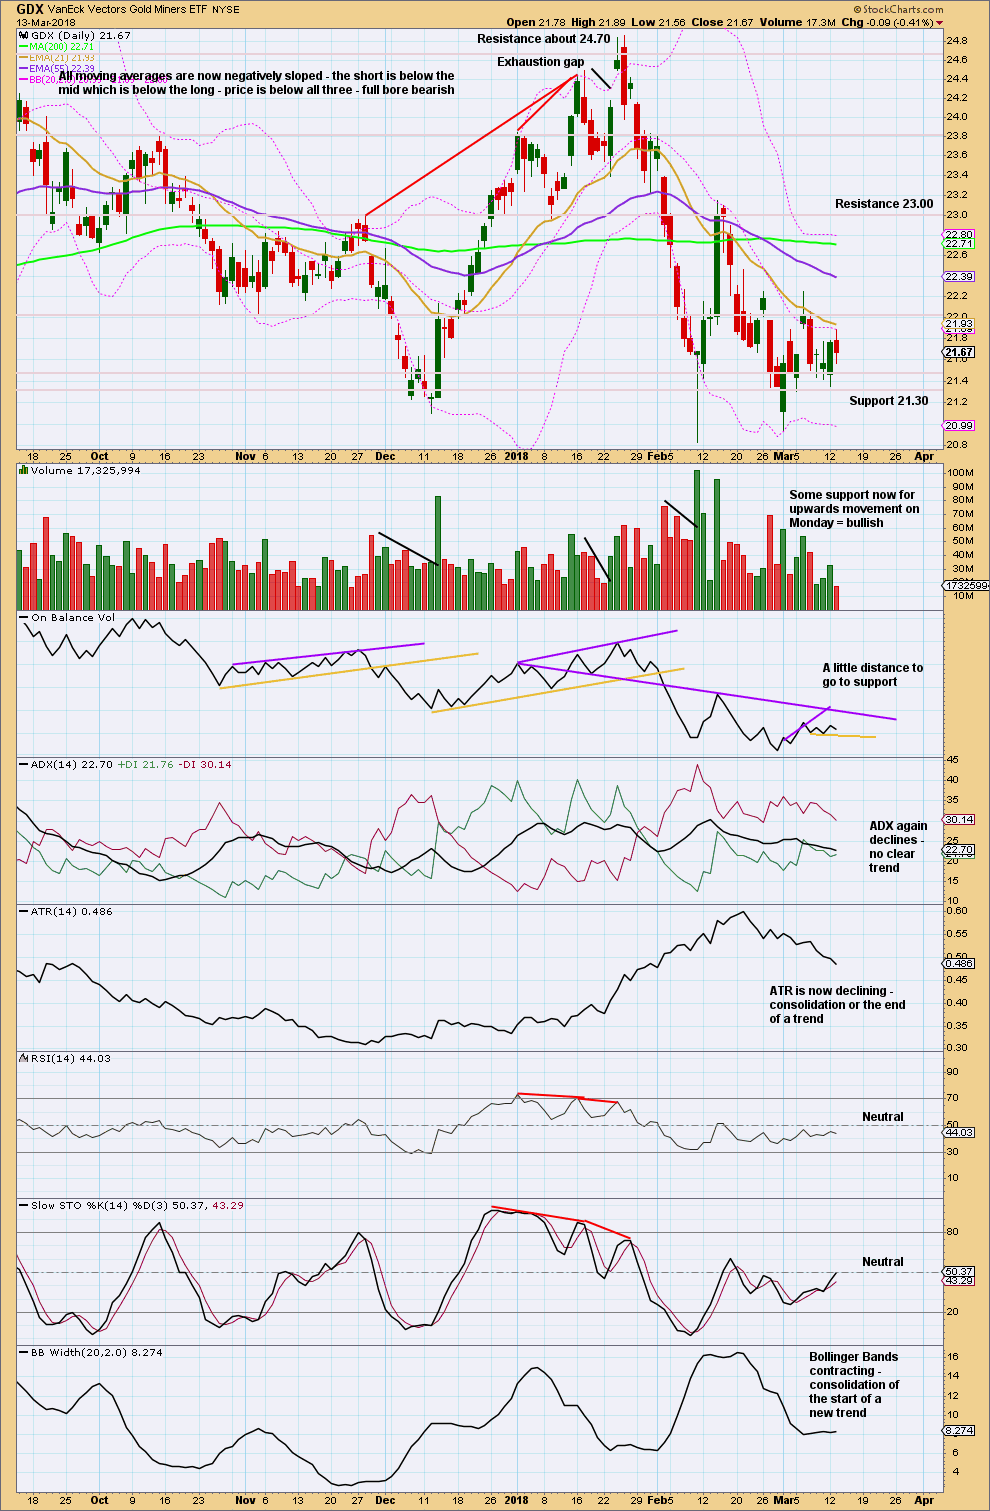
Click chart to enlarge. Chart courtesy of StockCharts.com.
The short term volume profile remains bullish; today’s session closed red and the balance of volume was down, and there was little support for downwards movement during the session from volume.
Published @ 08:01 p.m. EST.
Updated hourly chart:
The trend remains the same, until proven otherwise. While price remains above the lower edge of the orange base channel assume price will continue to move overall higher.
This will remain the main wave count.
Lara, would you be so kind as to update your $USD counts? Before invalidation, you only had a bullish count. I’d like to see if you still have a bullish count? Maybe you could publish both a bull and bear and give us your thoughts on which is most likely?
I know the correlation is inconsistant, but the major direction of the $USD does seem to impact gold. Many thanks ☺️
Okay. Will do.