
A breach of the channel on the hourly chart indicated more downwards movement was then expected.
The target has been adjusted, which is now within a strong support zone.
Summary: Look out for another test of support about 1,310 – 1,305. Thereafter, expect the upwards swing to resume, which may be choppy and overlapping.
New updates to this analysis are in bold.
Grand SuperCycle analysis is here.
Last in-depth historic analysis with monthly and several weekly charts is here, video is here.
There are multiple wave counts at this time at the weekly and monthly chart levels. In order to make this analysis manageable and accessible only two will be published on a daily basis, one bullish and one bearish. This does not mean the other possibilities may not be correct, only that publication of them all each day is too much to digest. At this stage, they do not diverge from the two possibilities below.
BULLISH ELLIOTT WAVE COUNT
FIRST WEEKLY CHART
Click chart to enlarge.
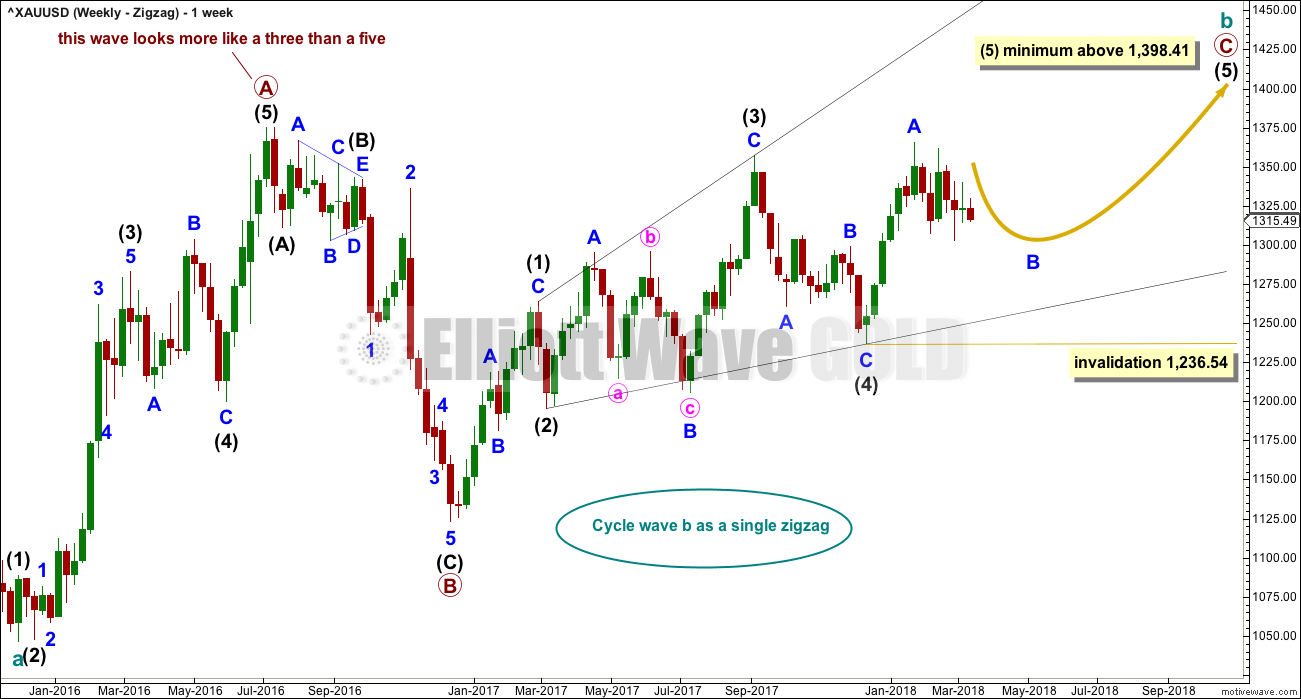
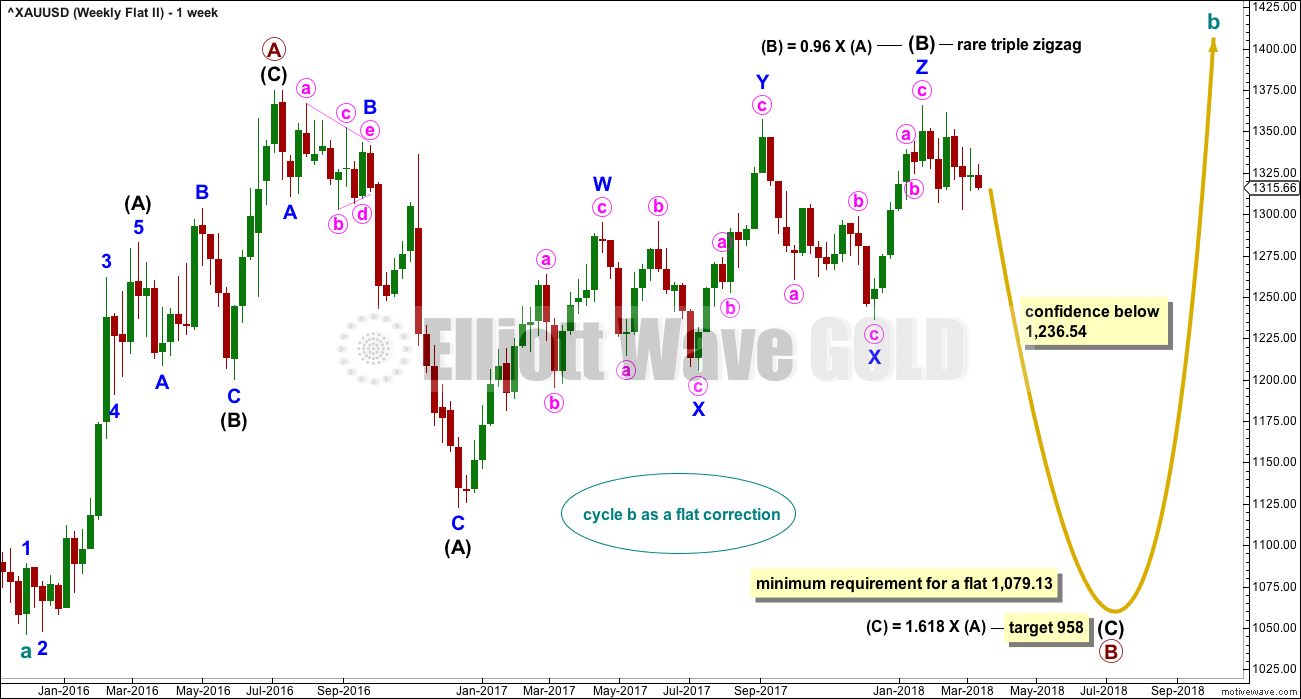
Cycle wave b may be a single zigzag. Zigzags subdivide 5-3-5. Primary wave C must subdivide as a five wave structure and may be either an impulse or an ending diagonal. Overlapping at this stage indicates an ending diagonal.
Within an ending diagonal, all sub-waves must subdivide as zigzags. Intermediate wave (4) must overlap into intermediate wave (1) price territory. This diagonal is expanding: intermediate wave (3) is longer than intermediate wave (1) and intermediate wave (4) is longer than intermediate wave (2). Intermediate wave (5) must be longer than intermediate wave (3), so it must end above 1,398.41 where it would reach equality in length with intermediate wave (3).
Within the final zigzag of intermediate wave (5), minor wave B may not move beyond the start of minor wave A below 1,236.54.
Within the diagonal of primary wave C, each sub-wave is extending in price and so may also do so in time. Within each zigzag, minor wave B may exhibit alternation in structure and may show an increased duration.
Within intermediate wave (1), minor wave B was a triangle lasting 11 days. Within intermediate wave (2), minor wave B was a zigzag lasting 2 days. Within intermediate wave (3), minor wave B was a regular flat lasting 60 days. Within intermediate wave (4), minor wave B was a regular contracting triangle lasting 40 days. Within intermediate wave (5), minor wave B may be expected to be an expanded flat, combination or running triangle to exhibit some alternation in structure. It may last as long as 40 to 60 days. So far it has lasted 29 days and the structure is incomplete.
This first weekly chart sees the upwards wave labelled primary wave A as a five wave structure. It must be acknowledged that this upwards wave looks better as a three than it does as a five. The fifth weekly chart below will consider the possibility that it was a three.
FIRST DAILY CHART
Click chart to enlarge.
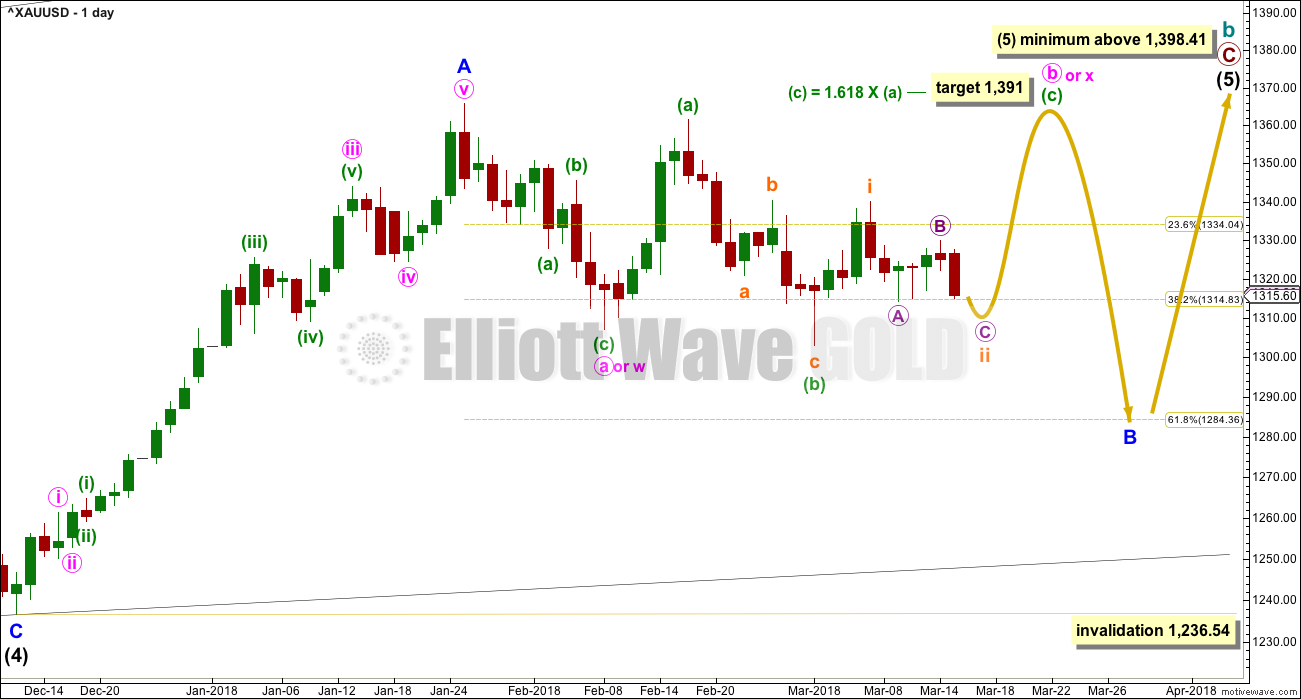
Within the ending diagonal, intermediate wave (5) must sub-divide as a zigzag.
Minor wave B may now be either a flat or a combination. An alternate idea of a triangle for minor wave B is published today in a separate chart below.
Within either a flat or combination for minor wave B, the correction of minute wave b or x may be unfolding as an expanded flat correction. When this expanded flat is complete, then a downwards swing for minute wave c or y would be expected.
Because both options of a flat or combination for minor wave B now expect minute wave b or x to be completing as an expanded flat, they both need to see a five up complete for minuette wave (c). Within the five up, subminuette wave i would be complete at the last small swing high. Subminuette wave ii may be moving lower and may end within the next 24 hours.
If minor wave B is unfolding as a flat correction, then minute wave c may move reasonably below the low of minute wave a at 1,307.09 and must be a five wave structure.
If minor wave B is unfolding as a combination, then minute wave y may be a flat or triangle and may end about the same level as minute wave w at 1,307.09.
HOURLY CHART
Click chart to enlarge.
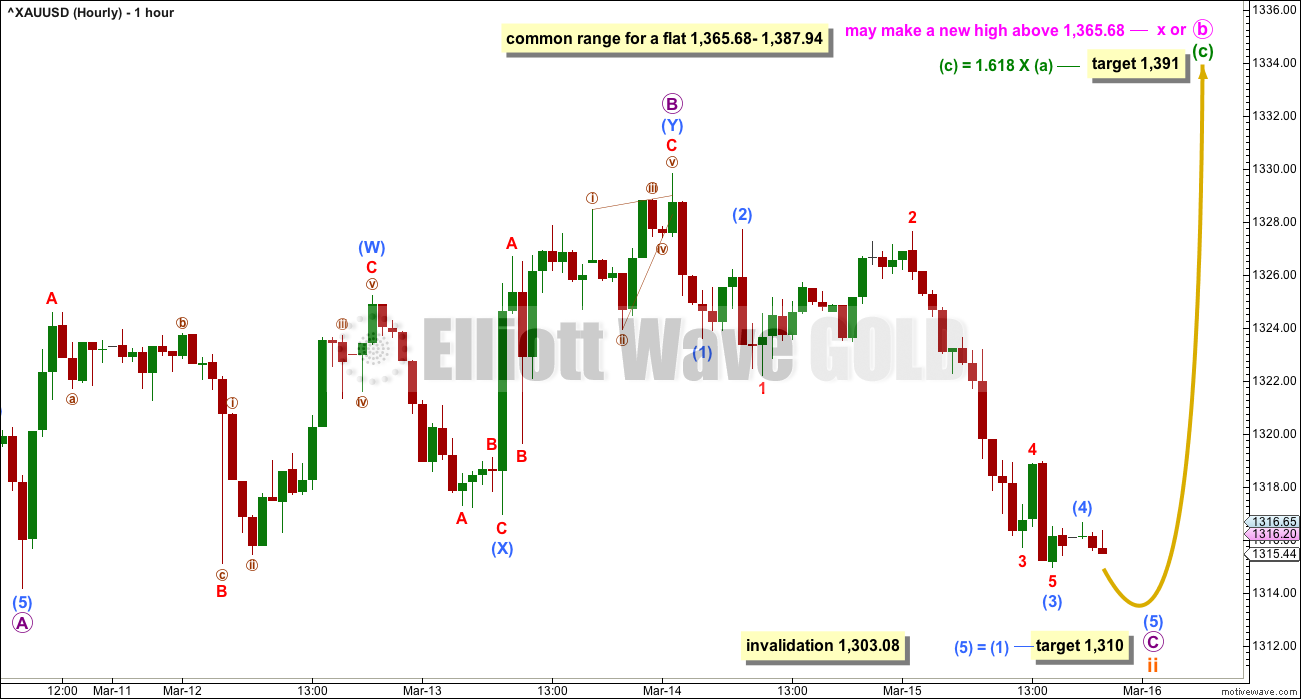
Subminuette wave ii may not be over.
Micro wave C may bring price back down to test support, which is strong about 1,310 – 1,305. A new target is calculated, which assumes the most common Fibonacci ratio now for sub-micro wave (5), and which would see micro wave C move slightly below the end of micro wave A at 1,314.16 to avoid a truncation.
Look out for a reversal and the start of a strong upwards swing as soon as price makes a new low below 1,314.16.
Subminuette wave ii may not move beyond the start of subminuette wave i below 1,303.08.
FIRST DAILY CHART – ALTERNATE
Click chart to enlarge.
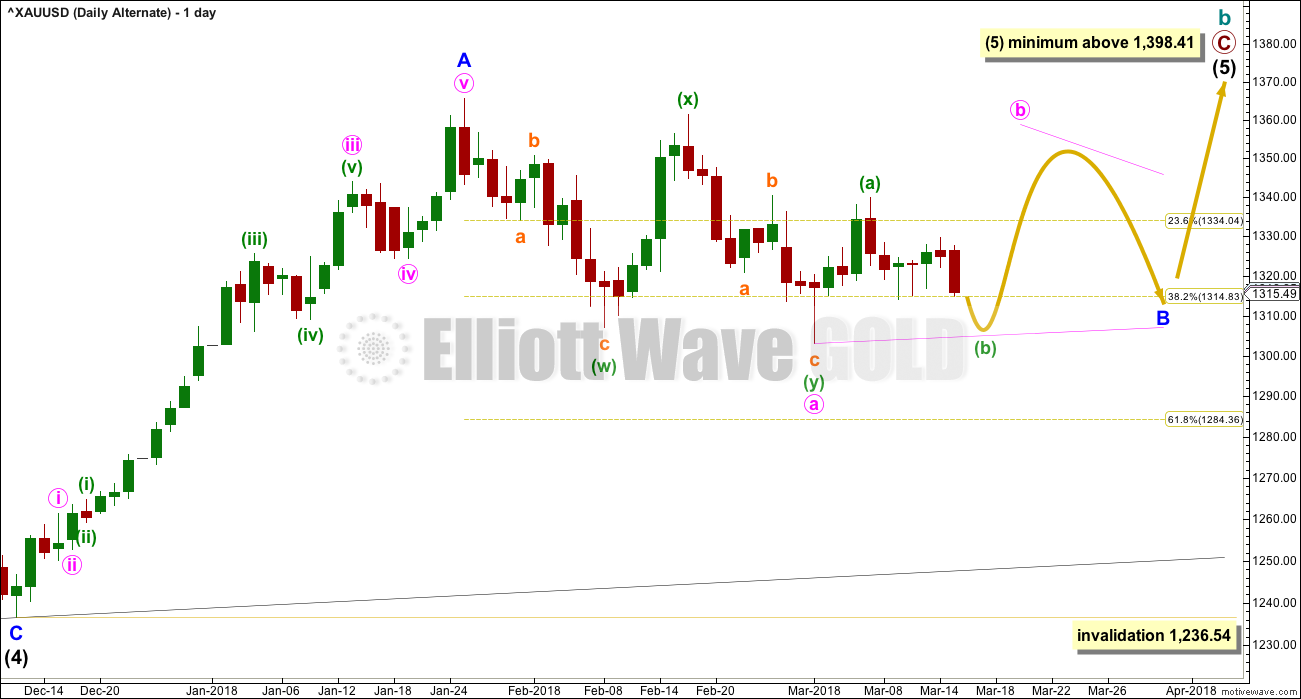
This alternate daily chart is identical to the first daily chart up to the high labelled minor wave A. Thereafter, it looks at a different structure for minor wave B.
Minor wave B may be an incomplete triangle, and within it minute wave a may have been a double zigzag. All remaining triangle sub-waves must be simple A-B-C structures, and three of the four remaining sub-waves must be simple zigzags. One remaining sub-wave may be a flat correction.
Minute wave b may be unfolding upwards as a single zigzag, and within it minuette wave (b) may not move beyond the start of minuette wave (a) below 1,303.08.
This alternate wave count expects weeks of choppy overlapping movement in an ever decreasing range.
BEARISH ELLIOTT WAVE COUNT
FIFTH WEEKLY CHART
Click chart to enlarge.
There were five weekly charts published in the last historic analysis. This fifth weekly chart is the most immediately bearish wave count, so this is published as a bearish possibility.
This fifth weekly chart sees cycle wave b as a flat correction, and within it intermediate wave (B) may be a complete triple zigzag. This would indicate a regular flat as intermediate wave (B) is less than 1.05 the length of intermediate wave (A).
If cycle wave b is a flat correction, then within it primary wave B must retrace a minimum 0.9 length of primary wave A at 1,079.13 or below. The most common length of B waves within flats is from 1 to 1.38 times the length of the A wave. The target calculated would see primary wave B end within this range.
I have only seen two triple zigzags before during my 10 years of daily Elliott wave analysis. If this wave count turns out to be correct, this would be the third. The rarity of this structure is identified on the chart.
TECHNICAL ANALYSIS
WEEKLY CHART
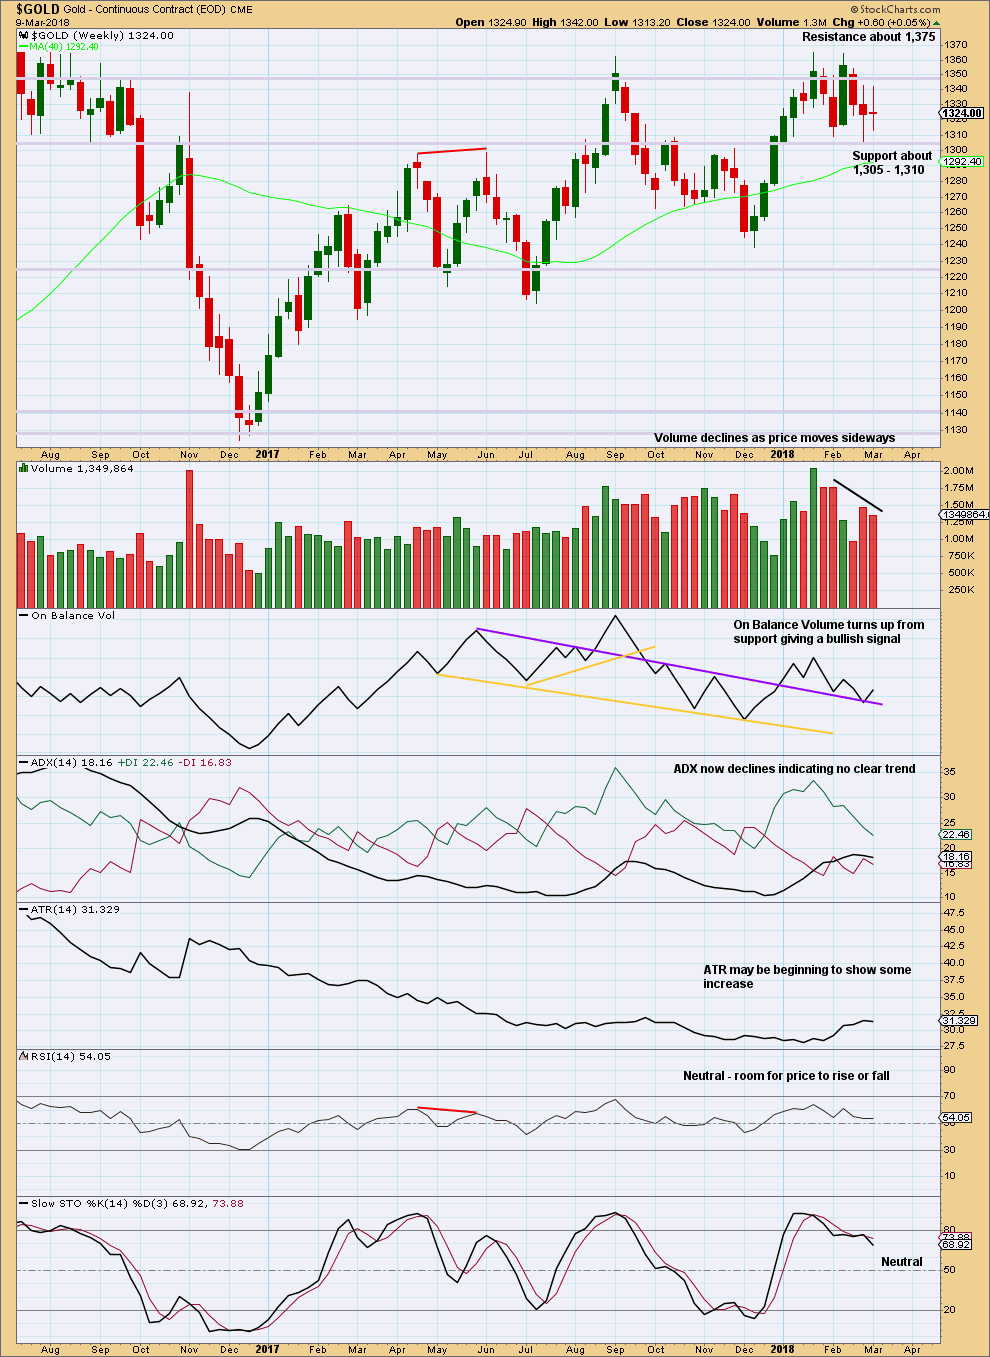
Click chart to enlarge. Chart courtesy of StockCharts.com.
It looks like price is bouncing up from support. The bullish signal this week from On Balance Volume supports the idea of an upwards swing here to resistance.
DAILY CHART
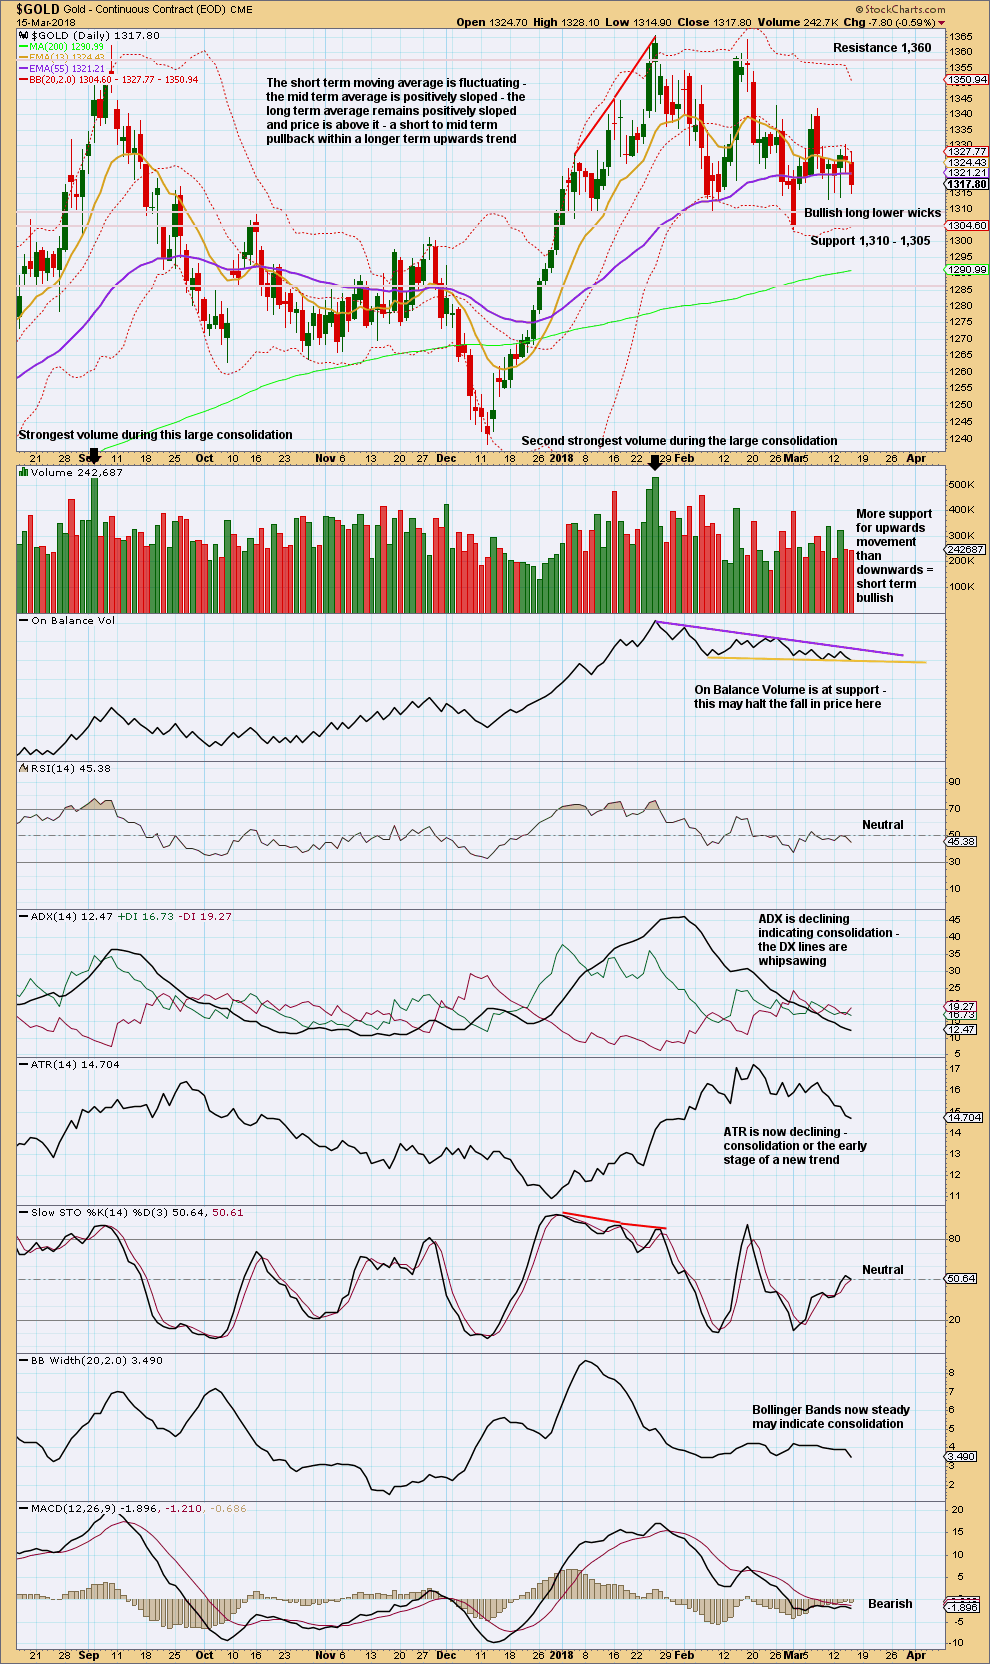
Click chart to enlarge. Chart courtesy of StockCharts.com.
Looking at the bigger picture, Gold has been within a large consolidation since about January 2017 (this chart does not show all of this large consolidation), and during this consolidation it is two upwards days that have strongest volume and an upwards week that has strongest volume. Volume suggests an upwards breakout may be more likely than downwards.
Currently, Gold is within a smaller consolidation that began in early January 2018. This consolidation is delineated by support about 1,310 to 1,305 and resistance (final) about 1,375. It is an upwards day during this smaller consolidation that has strongest volume, suggesting an upwards breakout may be more likely here than downwards.
The short term volume profile remains bullish and a few long lower wicks support a short term bullish outlook.
The support line on On Balance Volume is adjusted today. It now has some reasonable technical significance as it is almost horizontal, longer held, and has been tested about four times. This may assist to halt any fall in price.
Price may be winding up now for a reasonably large movement. Volume suggests it may more likely be upwards than downwards. Whipsaws on news releases can be in both directions though, so look for support now about 1,305 and resistance about 1,360.
GDX WEEKLY CHART
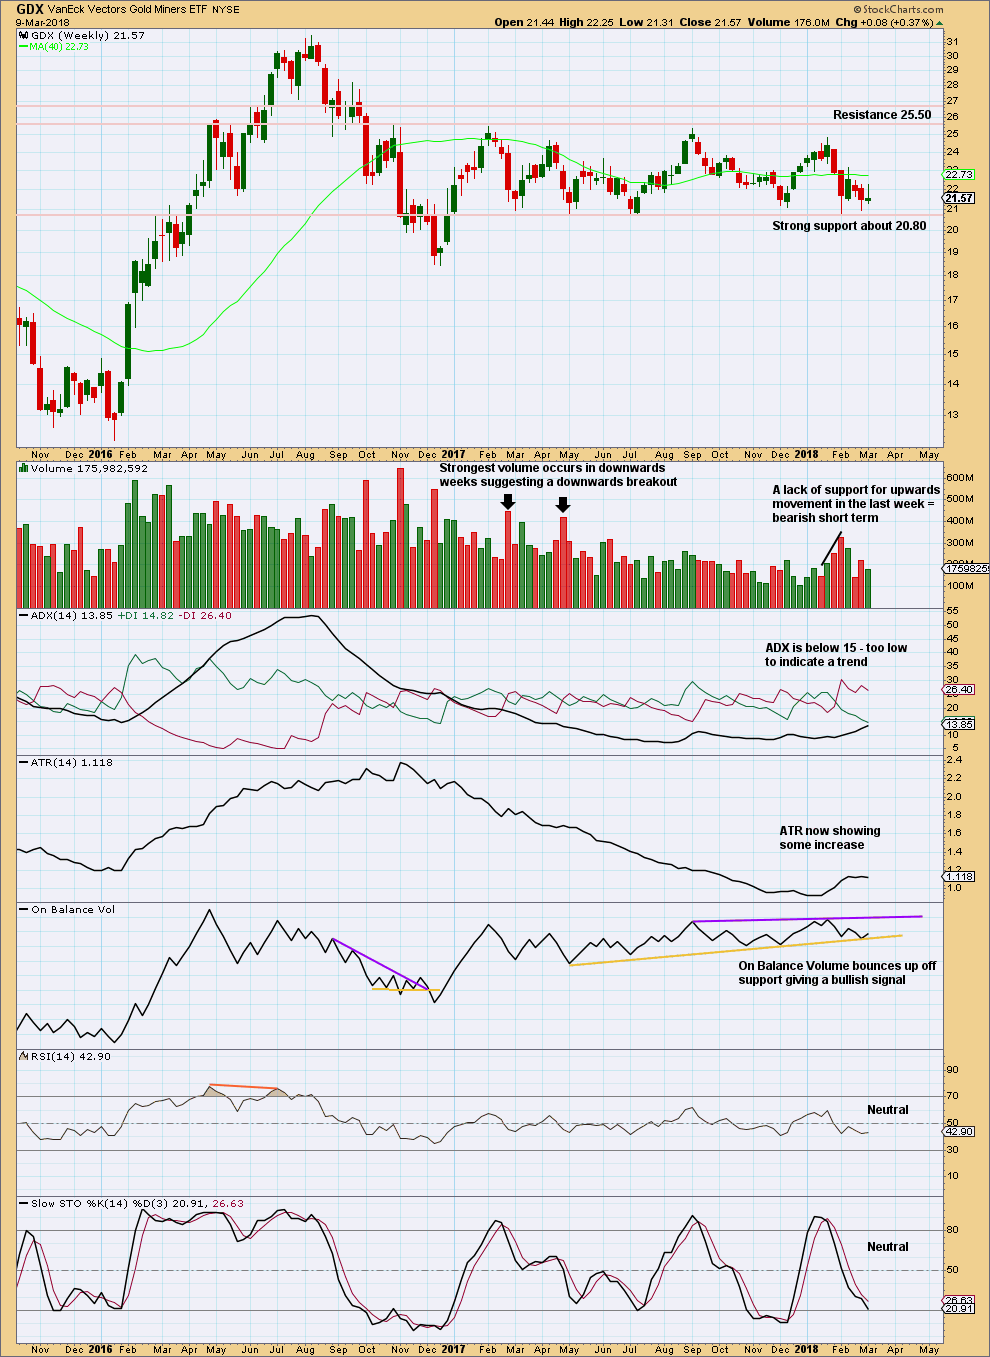
Click chart to enlarge. Chart courtesy of StockCharts.com.
Support about 20.80 has been tested about eight times and so far has held. The more often a support area is tested and holds, the more technical significance it has.
In the first instance, expect this area to continue to provide support. Only a strong downwards day, closing below support and preferably with some increase in volume, would constitute a downwards breakout from the consolidation that GDX has been in for a year now.
Resistance is about 25.50. Only a strong upwards day, closing above resistance and with support from volume, would constitute an upwards breakout.
A bullish signal from On Balance Volume will be given more weight than volume. It looks like GDX is bouncing up off support. Look for an upwards swing overall to continue to resistance, but do not expect price to move in a straight line.
GDX DAILY CHART
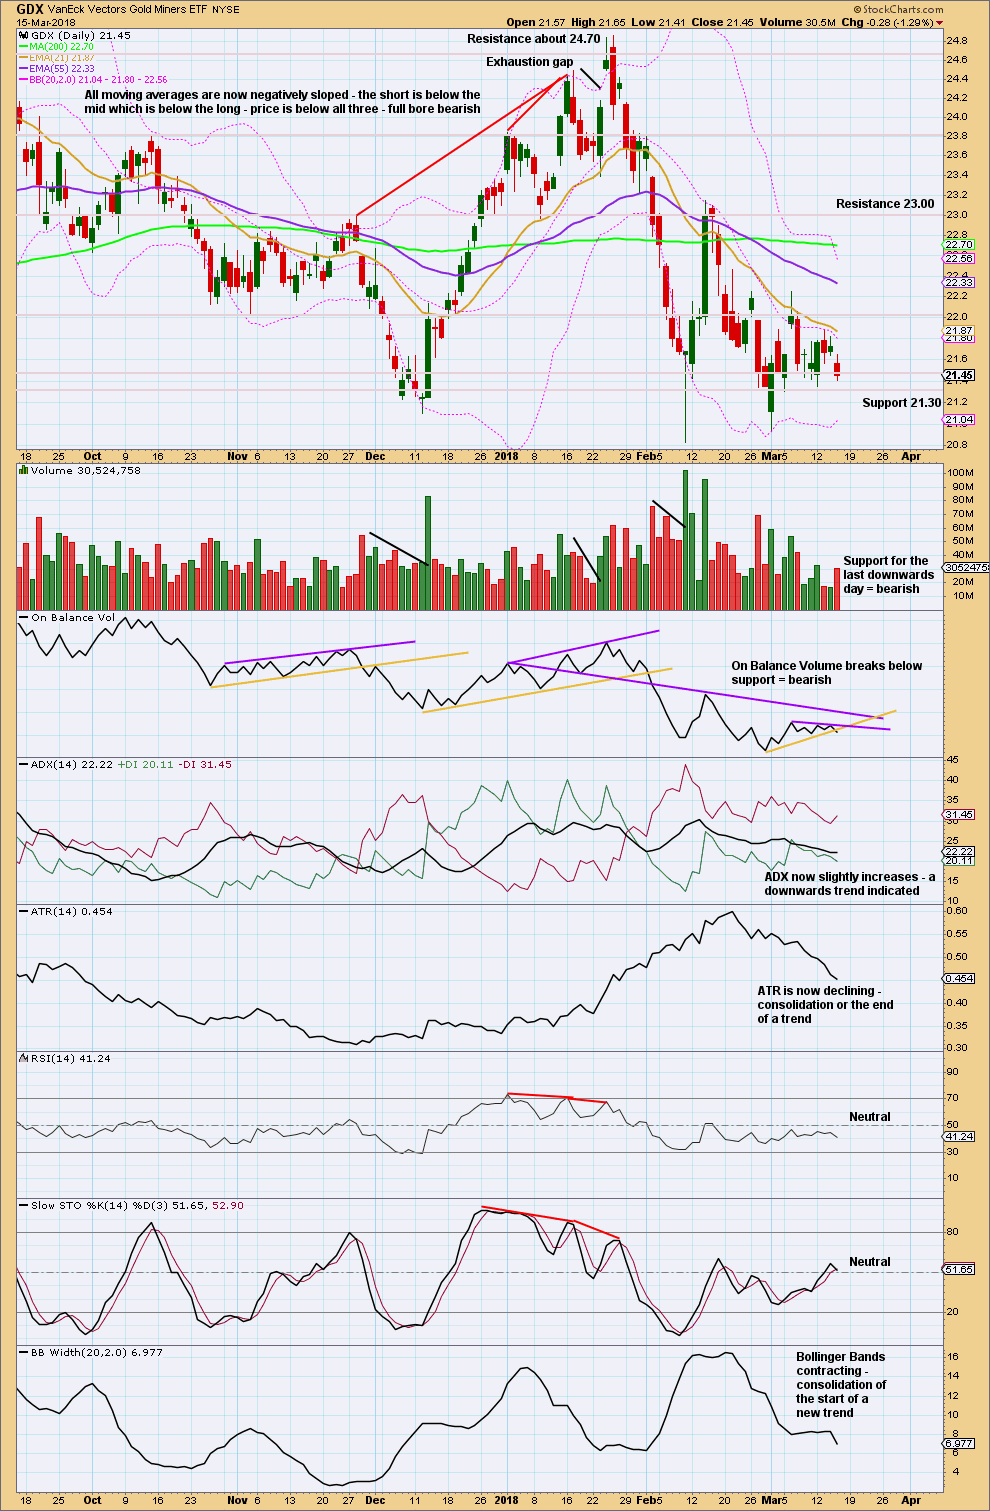
Click chart to enlarge. Chart courtesy of StockCharts.com.
Price remains within a small range and above support. Today’s stronger volume suggests a little more downwards movement tomorrow; look for support about 21.30.
The signal from On Balance Volume is weak because the line has a reasonable slope and is not very long held. It was tested four times though, so this is identified as a weak bearish signal. The signal makes no comment though on how far nor for how long downwards movement may result.
Published @ 09:25 p.m. EST.
Well.. that didn’t work out so well after that last posted chart.
The original target at 1,310 – 1,305 is now met. There is strong support here. It would be reasonable to expect another bounce.
Updated hourly chart:
It is now possible that subminuette ii could be over, a low could be in and price may now be ready to rise for a few days up to resistance.
Good night everybody. See you in the morning.