
Price is range bound, moving sideways. The Elliott wave counts expect a B wave may be about halfway through.
An alternate idea of a new downwards trend is also considered at the daily chart level today.
Summary: Two bearish signals from On Balance Volume indicate it is time to consider an imminent downwards breakout. A close below support at 1,305 would constitute a downwards breakout. Support from volume would add confidence. But look for a turn and a bounce while price remains above support.
New updates to this analysis are in bold.
Grand SuperCycle analysis is here.
Last in-depth historic analysis with monthly and several weekly charts is here, video is here.
There are multiple wave counts at this time at the weekly and monthly chart levels. In order to make this analysis manageable and accessible only two will be published on a daily basis, one bullish and one bearish. This does not mean the other possibilities may not be correct, only that publication of them all each day is too much to digest. At this stage, they do not diverge from the two possibilities below.
BULLISH ELLIOTT WAVE COUNT
FIRST WEEKLY CHART
Click chart to enlarge.
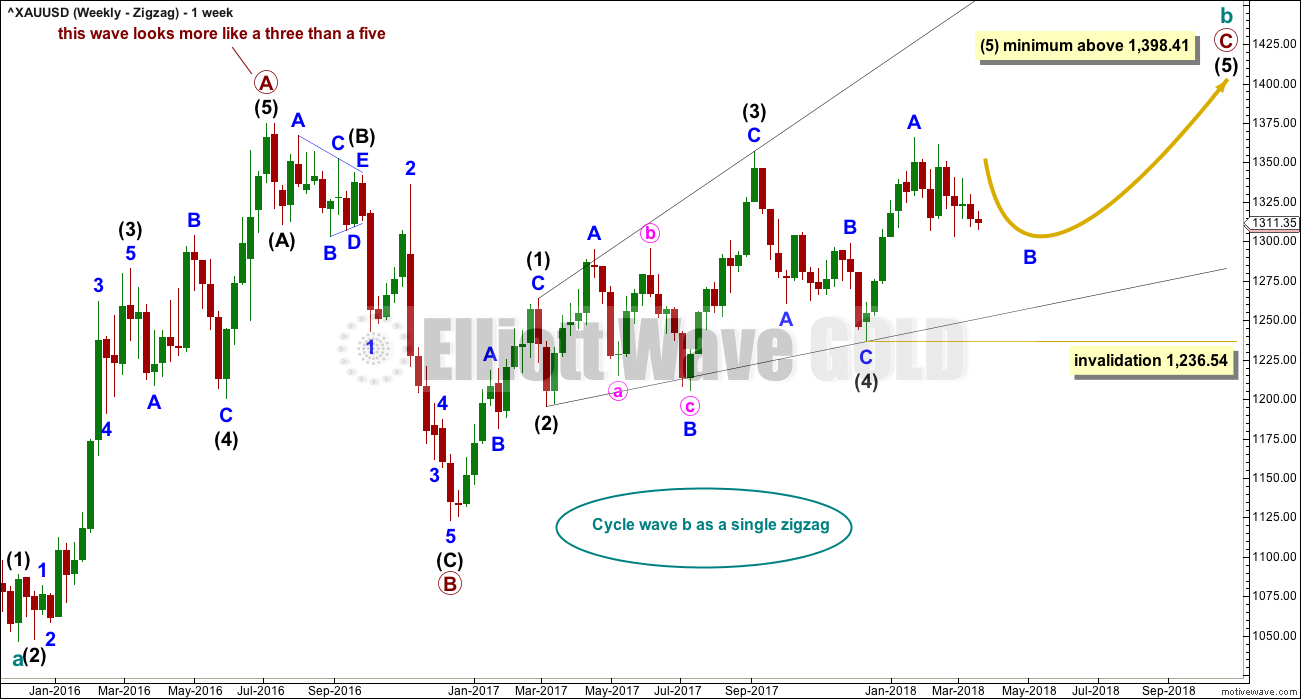
Cycle wave b may be a single zigzag. Zigzags subdivide 5-3-5. Primary wave C must subdivide as a five wave structure and may be either an impulse or an ending diagonal. Overlapping at this stage indicates an ending diagonal.
Within an ending diagonal, all sub-waves must subdivide as zigzags. Intermediate wave (4) must overlap into intermediate wave (1) price territory. This diagonal is expanding: intermediate wave (3) is longer than intermediate wave (1) and intermediate wave (4) is longer than intermediate wave (2). Intermediate wave (5) must be longer than intermediate wave (3), so it must end above 1,398.41 where it would reach equality in length with intermediate wave (3).
Within the final zigzag of intermediate wave (5), minor wave B may not move beyond the start of minor wave A below 1,236.54.
Within the diagonal of primary wave C, each sub-wave is extending in price and so may also do so in time. Within each zigzag, minor wave B may exhibit alternation in structure and may show an increased duration.
Within intermediate wave (1), minor wave B was a triangle lasting 11 days. Within intermediate wave (2), minor wave B was a zigzag lasting 2 days. Within intermediate wave (3), minor wave B was a regular flat lasting 60 days. Within intermediate wave (4), minor wave B was a regular contracting triangle lasting 40 days. Within intermediate wave (5), minor wave B may be expected to be an expanded flat, combination or running triangle to exhibit some alternation in structure. It may last as long as 40 to 60 days. So far it has lasted 38 days (refer to daily chart) and the structure is incomplete.
There are more than 23 possible corrective structures that minor wave B may unfold as. At this stage, it may be about halfway through and the number of alternate ways to label it is significant. Three ideas are presented below.
This first weekly chart sees the upwards wave labelled primary wave A as a five wave structure. It must be acknowledged that this upwards wave looks better as a three than it does as a five. The fifth weekly chart below will consider the possibility that it was a three.
FIRST DAILY CHART
Click chart to enlarge.
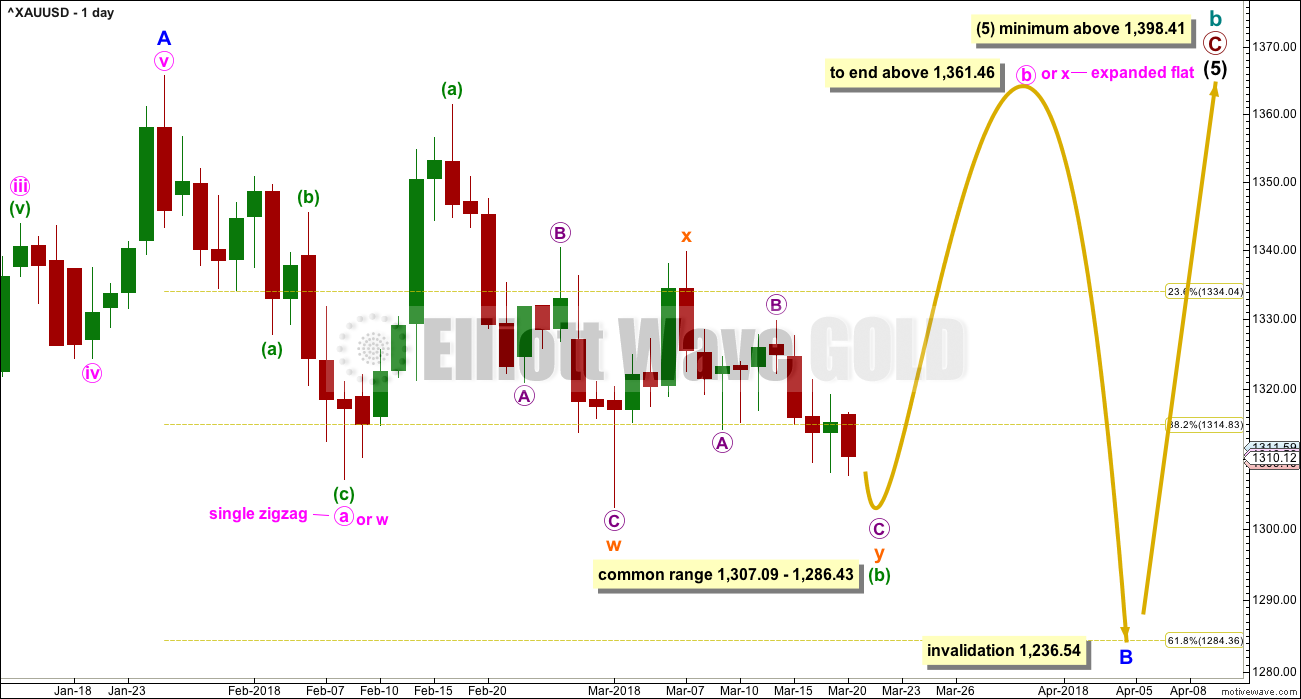
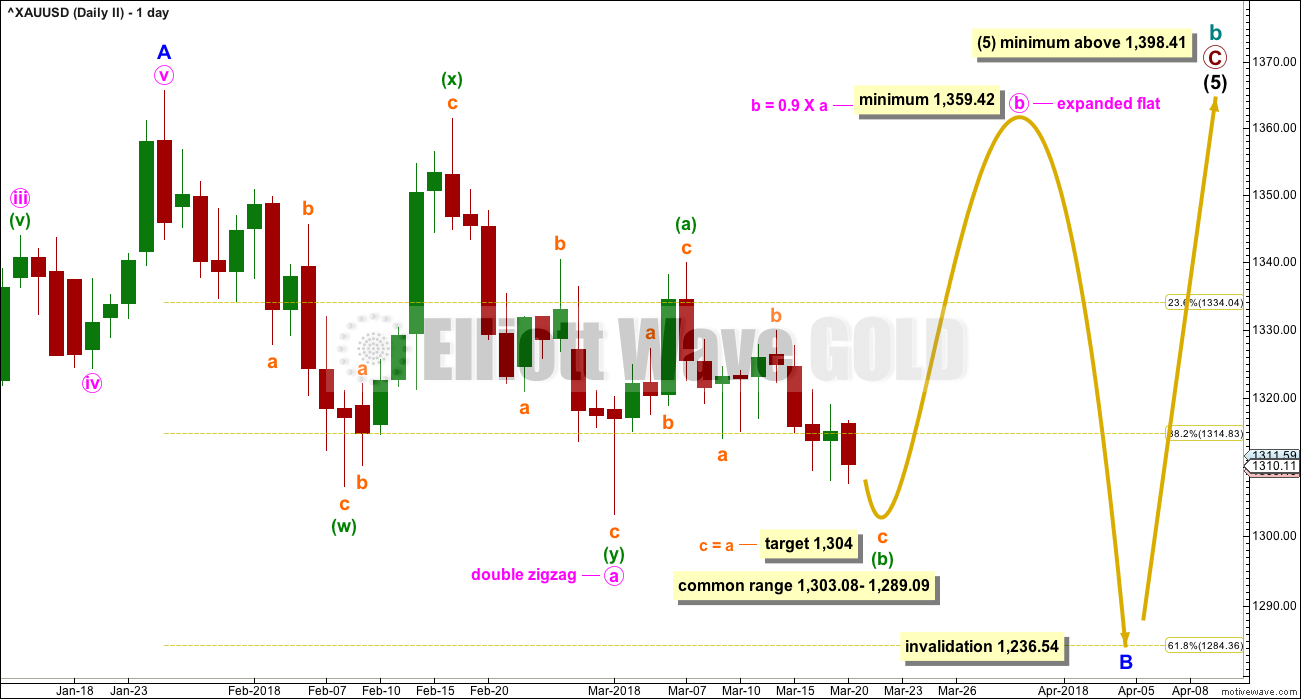
This first daily chart considers the possibility that minor wave B may be either a flat or combination, and that minute wave a or w within it was a single zigzag over on the 8th of February.
If minor wave B is a flat correction, then within it minute wave a is a three wave structure. Minute wave b must be a three wave structure and must retrace a minimum 0.9 length of minute wave a at 1,359.82. Minute wave b maybe itself unfolding as a flat correction.
If minor wave B is a combination, then the first structure in a double may be a complete zigzag labelled minute wave w. The double may be joined by a three in the opposite direction, an expanded flat labelled minute wave x.
For both ideas, labelled either minute wave b or x, an expanded flat beginning on the 8th of February needs to complete. Within this expanded flat correction, the most common length for minuette wave (b) is from 1 to 1.38 times the length of minuette wave (a).
When minuette wave (b) is complete, then minuette wave (c) should unfold higher as a five wave structure. It would be extremely likely to make at least a slight new high above the end of minuette wave (a) at 1,361.46 to avoid a truncation and a very rare running flat.
Minuette wave (b) may be moving lower as a double zigzag.
HOURLY CHART
Click chart to enlarge.
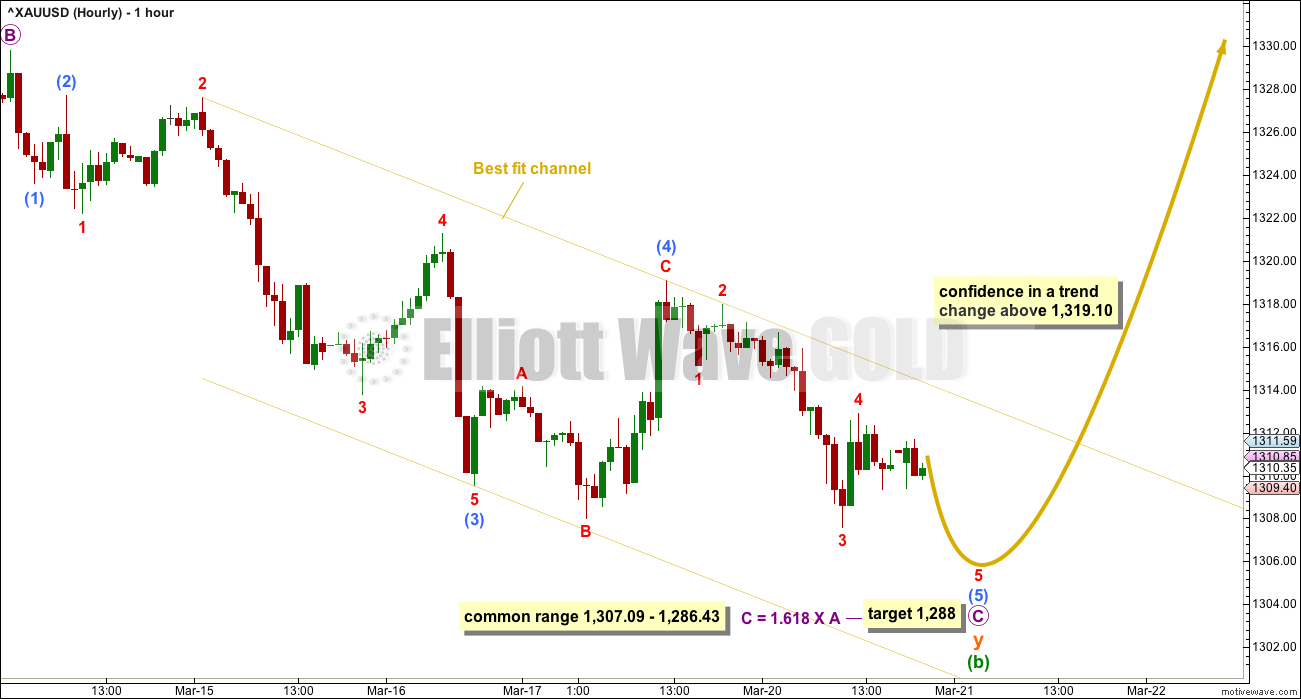
The double zigzag for minuette wave (b) may be nearing completion.
Accept the possibility of new lows while price remains within the best fit channel. If price breaks above the upper edge of the channel, then a low may be in place.
While sub-micro wave (5) is underway, no second wave correction within it may make a new high above the start at 1,319.10.
A new high above 1,319.10 could not be part of sub-micro wave (5), so at that stage sub-micro wave (5) would have to be over. That would provide confidence in a low in place and an upwards swing underway.
FIRST DAILY CHART – ALTERNATE
Click chart to enlarge.
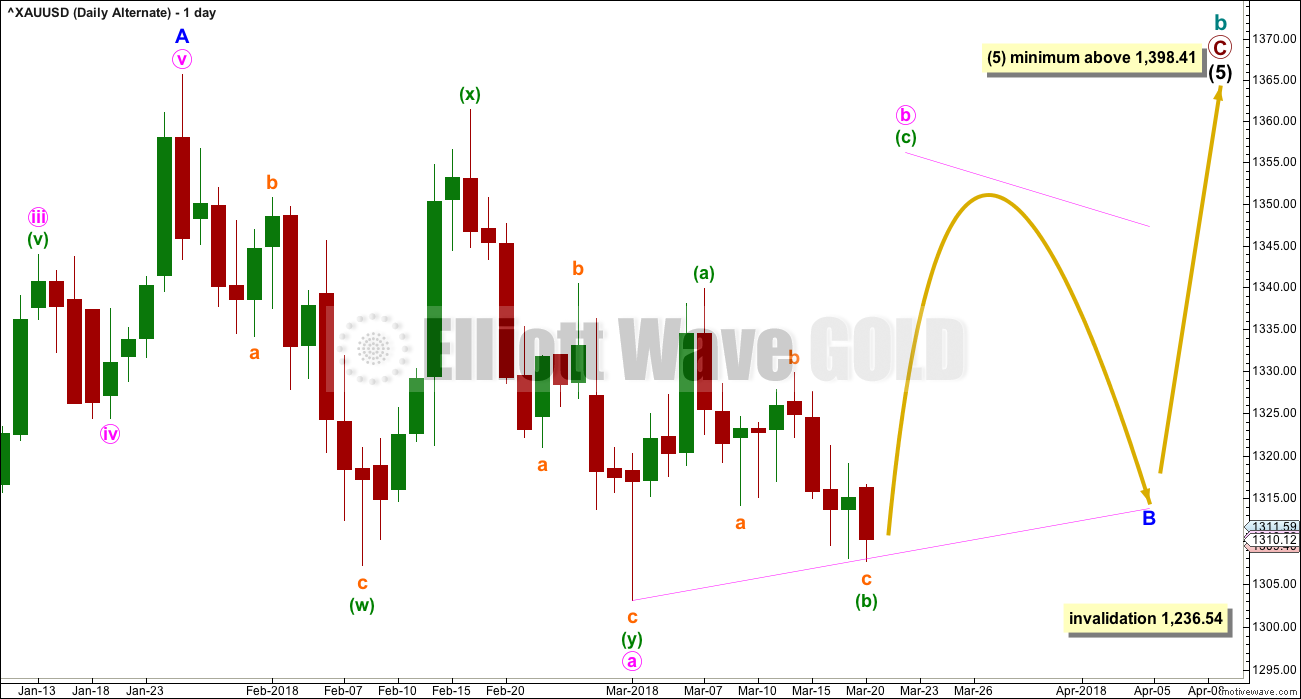
This alternate daily chart is identical to the first daily chart up to the high labelled minor wave A. Thereafter, it looks at a different structure for minor wave B.
Minor wave B may be an incomplete triangle, and within it minute wave a may have been a double zigzag. All remaining triangle sub-waves must be simple A-B-C structures, and three of the four remaining sub-waves must be simple zigzags. One remaining sub-wave may be a flat correction.
Minute wave b may be unfolding upwards as a single zigzag, and within it minuette wave (b) may not move beyond the start of minuette wave (a) below 1,303.08.
This alternate wave count expects weeks of choppy overlapping movement in an ever decreasing range.
FIRST DAILY CHART – ALTERNATE II
Click chart to enlarge.
Minor wave B may be a flat correction, and within it minute wave a may have ended at the last low as a double zigzag.
Minute wave b must retrace a minimum 0.9 length of minute wave a at 1,359.42.
Minute wave b may be an expanded flat. Within this expanded flat, the common range for minuette wave (b) is from 1 to 1.38 times the length of minuette wave (a). The target for minuette wave (b) would see it fall very slightly short of this most common range.
When minuette wave (b) is a complete zigzag, then minuette wave (c) upwards would be expected to unfold as a five wave structure.
This chart does not include the idea of a combination for minor wave B, because the double zigzag here labelled minute wave a may not be labelled minute wave w. The maximum number of simple corrective structures in a multiple is three; to label multiples within multiples increases the maximum beyond three and violates the Elliott wave rule.
BEARISH ELLIOTT WAVE COUNT
FIFTH WEEKLY CHART
Click chart to enlarge.
There were five weekly charts published in the last historic analysis. This fifth weekly chart is the most immediately bearish wave count, so this is published as a bearish possibility.
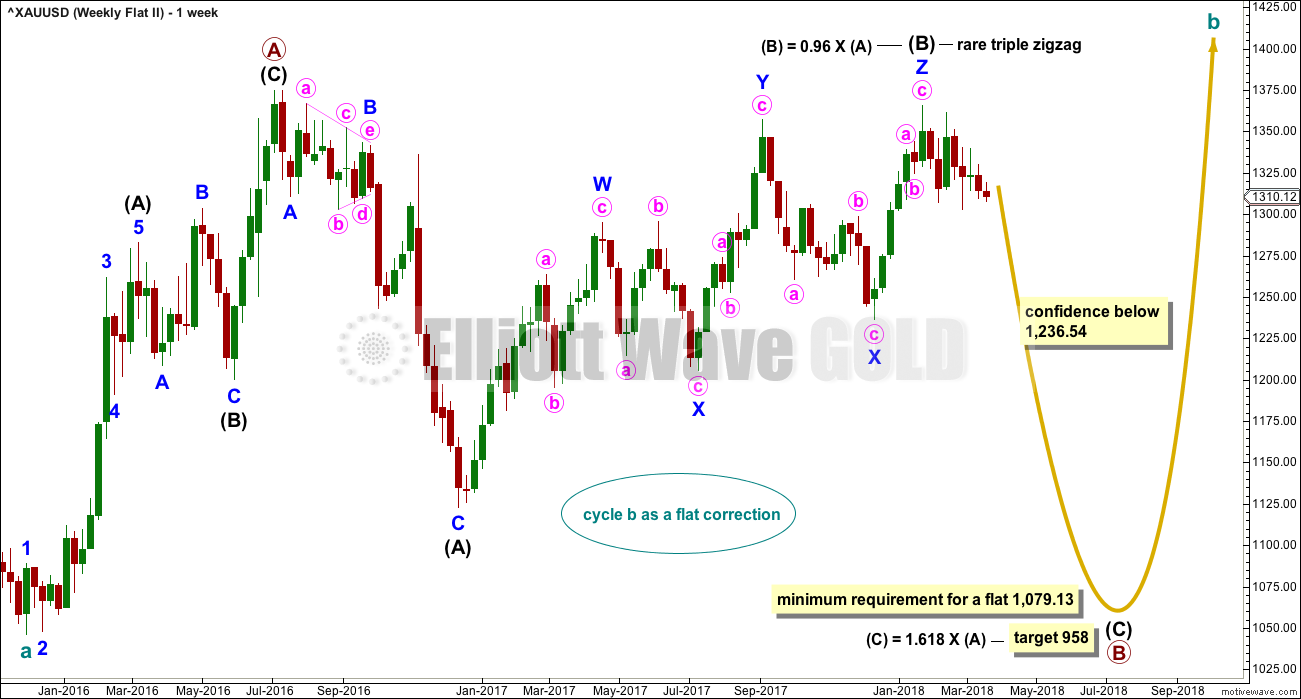
This fifth weekly chart sees cycle wave b as a flat correction, and within it intermediate wave (B) may be a complete triple zigzag. This would indicate a regular flat as intermediate wave (B) is less than 1.05 the length of intermediate wave (A).
If cycle wave b is a flat correction, then within it primary wave B must retrace a minimum 0.9 length of primary wave A at 1,079.13 or below. The most common length of B waves within flats is from 1 to 1.38 times the length of the A wave. The target calculated would see primary wave B end within this range.
I have only seen two triple zigzags before during my 10 years of daily Elliott wave analysis. If this wave count turns out to be correct, this would be the third. The rarity of this structure is identified on the chart.
FIFTH DAILY CHART
Click chart to enlarge.
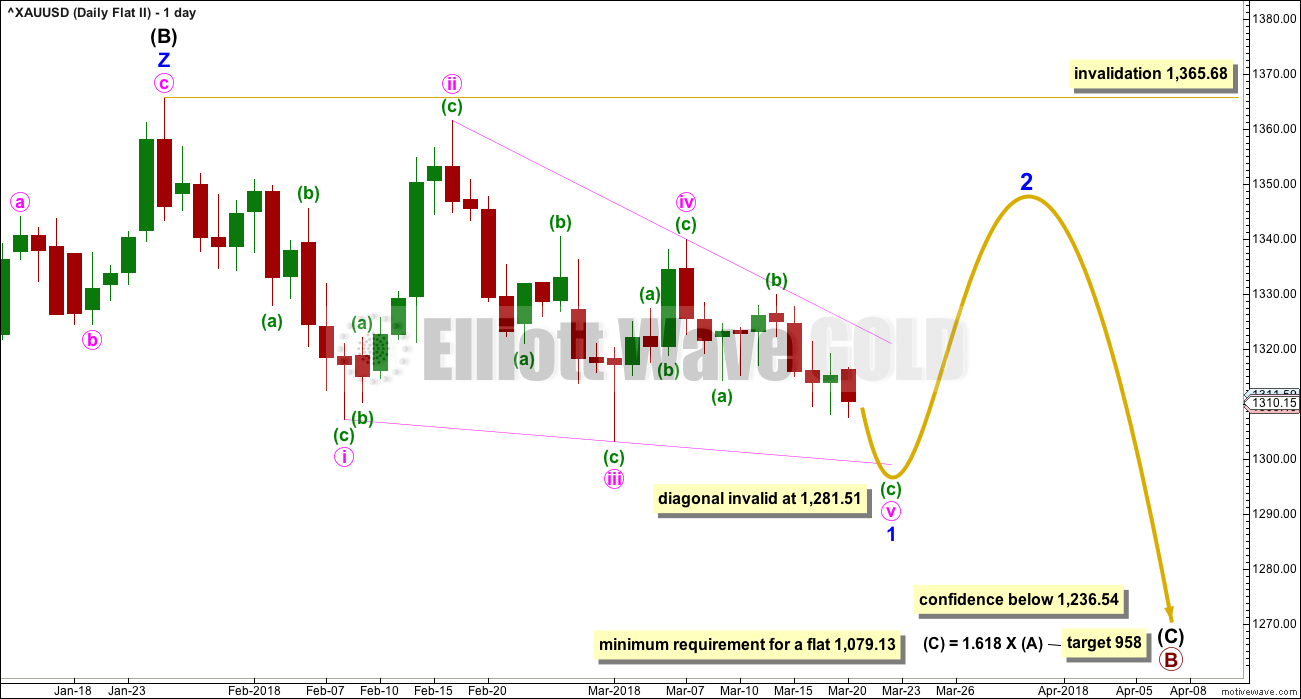
If a new wave down at intermediate degree is beginning, then the first wave of minor wave 1 must subdivide as a five, which may only be an impulse or a leading diagonal. At this stage, the overlapping of the last few weeks suggests a diagonal.
Minor wave 1 may be a leading contracting diagonal. Minute wave iii is shorter than minute wave i, and minute wave iv is shorter than minute wave ii. The trend lines converge. Minute wave v must be shorter than minute wave iii. At 1,281.51 minute wave v would reach equality in length with minute wave iii, so at or below this point the diagonal would be invalidated.
Contracting diagonals almost always end with an overshoot of the 1-3 trend line (this overshoot can be small). Leading diagonals in first wave positions are commonly followed by very deep second wave corrections.
If downwards movement continues a little further to slightly overshoot the pink i-iii trend line, and then quickly reverses there, a deep bounce should then be expected.
Minor wave 2 may not move beyond the start of minor wave 1 above 1,365.68.
TECHNICAL ANALYSIS
WEEKLY CHART
Click chart to enlarge. Chart courtesy of StockCharts.com.
Price is again at support and On Balance Volume is almost at support. With volume continuing to decline, it looks reasonable to expect a turn back to an upwards swing about here.
Price is still range bound.
DAILY CHART
Click chart to enlarge. Chart courtesy of StockCharts.com.
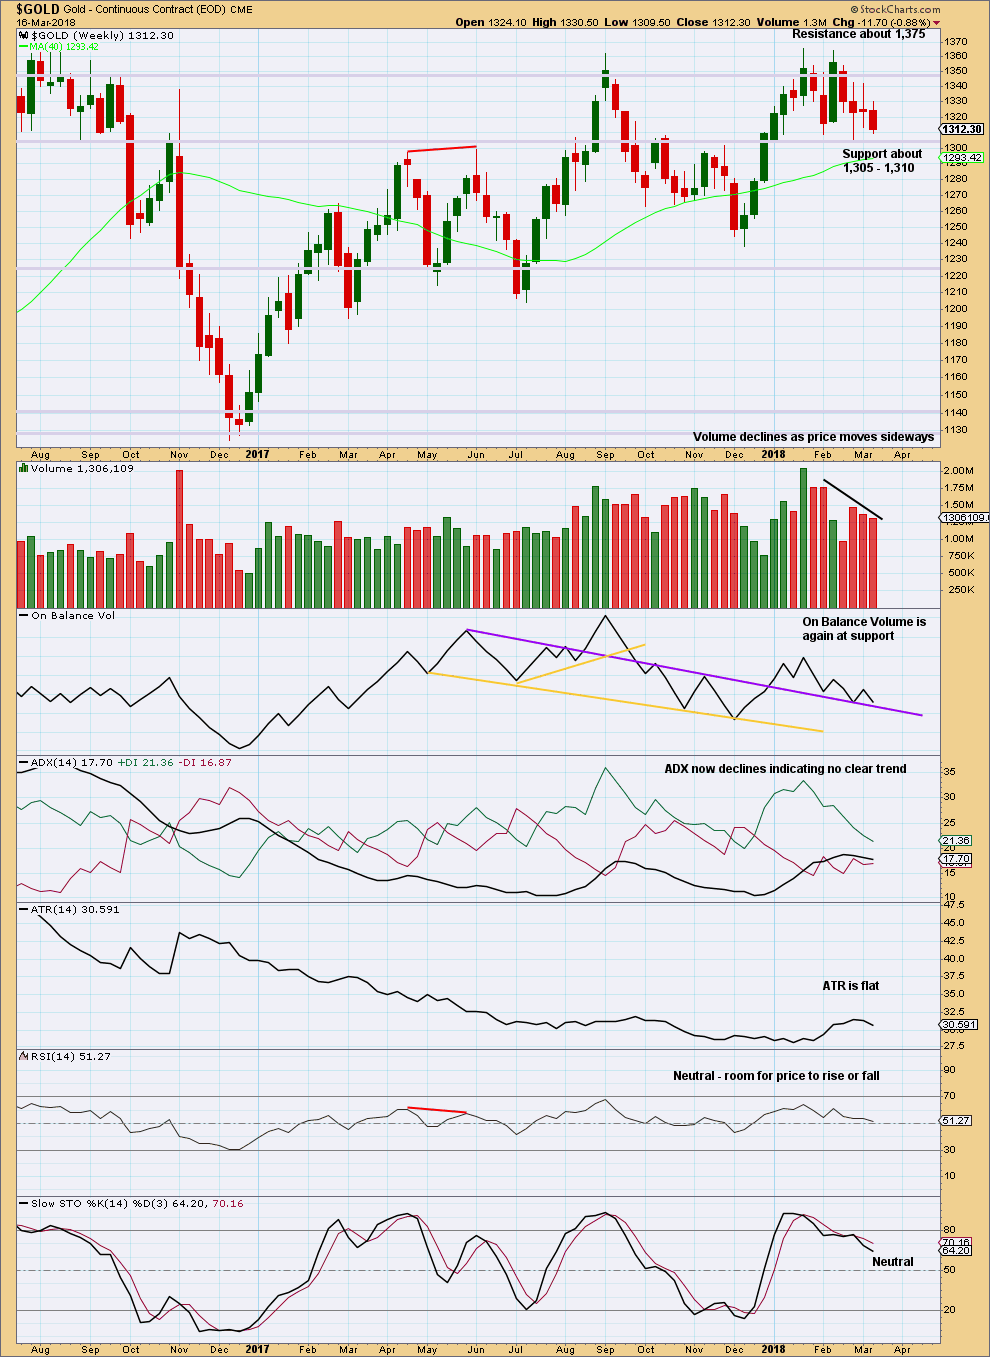
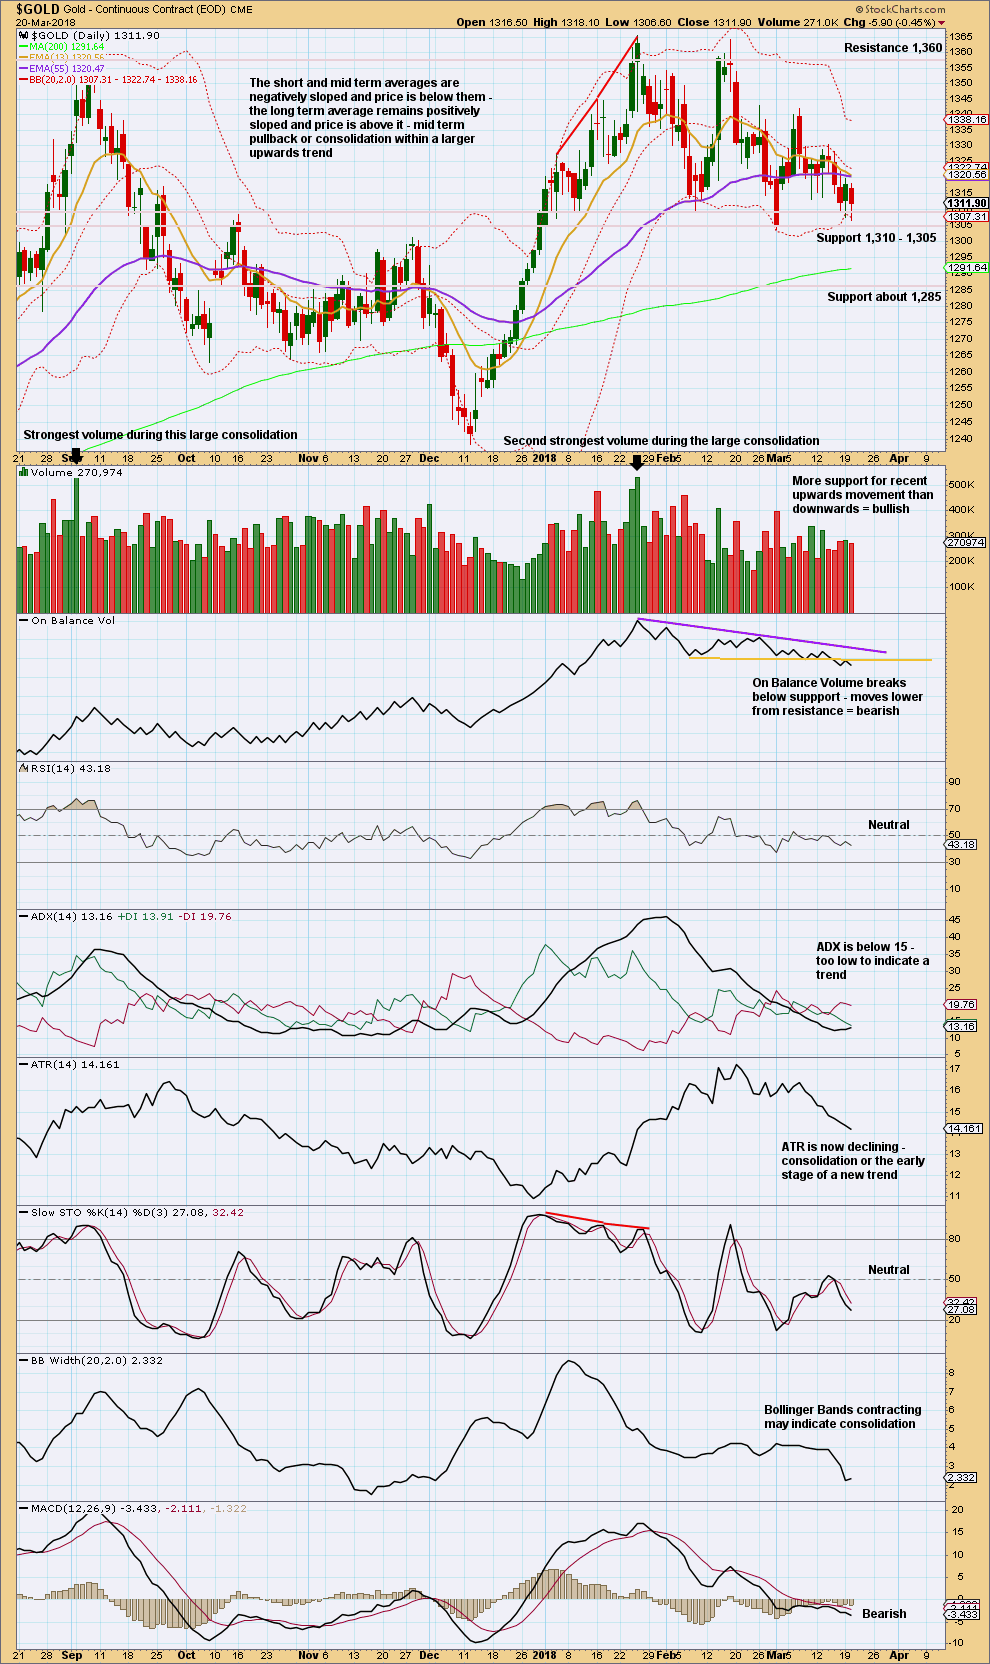
Looking at the bigger picture, Gold has been within a large consolidation since about January 2017 (this chart does not show all of this large consolidation), and during this consolidation it is two upwards days that have strongest volume and an upwards week that has strongest volume. Volume suggests an upwards breakout may be more likely than downwards.
Currently, Gold is within a smaller consolidation that began in early January 2018. This consolidation is delineated by support about 1,310 to 1,305 and resistance (final) about 1,375. It is an upwards day during this smaller consolidation that has strongest volume, suggesting an upwards breakout may be more likely here than downwards.
With now two bearish signals from On Balance Volume, price may be ready to break out of this smaller consolidation downwards. This does not support the Elliott wave count.
Price needs to close below 1,305, preferably on a strong downwards day, for confidence in a downwards breakout. If there is support from volume, then more confidence may be had (but it is not necessary for a downwards breakout).
There are now two long lower candlestick wicks and price is still above support. The short term volume profile is bullish.
This chart is unclear: the short term volume profile and candlestick wicks contradict the bearish signals from On Balance Volume. More weight may be given to On Balance Volume, so look out for more downwards movement. The target for the hourly Elliott wave count at 1,288 may be reasonable.
GDX WEEKLY CHART
Click chart to enlarge. Chart courtesy of StockCharts.com.
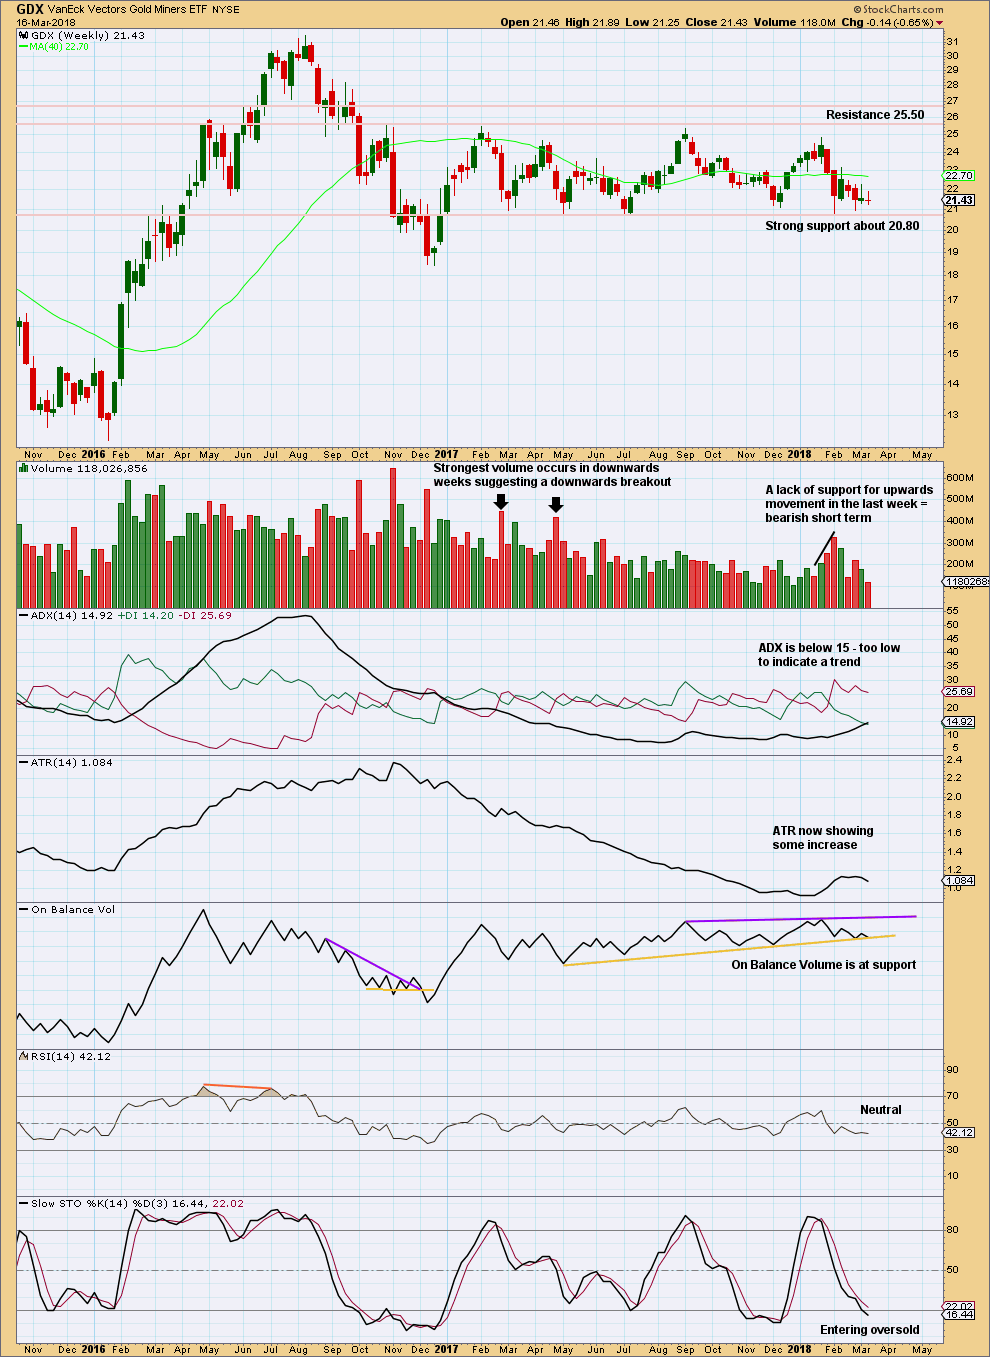
Support about 20.80 has been tested about eight times and so far has held. The more often a support area is tested and holds, the more technical significance it has.
In the first instance, expect this area to continue to provide support. Only a strong downwards day, closing below support and preferably with some increase in volume, would constitute a downwards breakout from the consolidation that GDX has been in for a year now.
Resistance is about 25.50. Only a strong upwards day, closing above resistance and with support from volume, would constitute an upwards breakout.
With On Balance Volume again at support and price close to support, it is reasonable to expect a turn and an upwards swing about here. There is a little room though for a little more downwards movement.
GDX DAILY CHART
Click chart to enlarge. Chart courtesy of StockCharts.com.
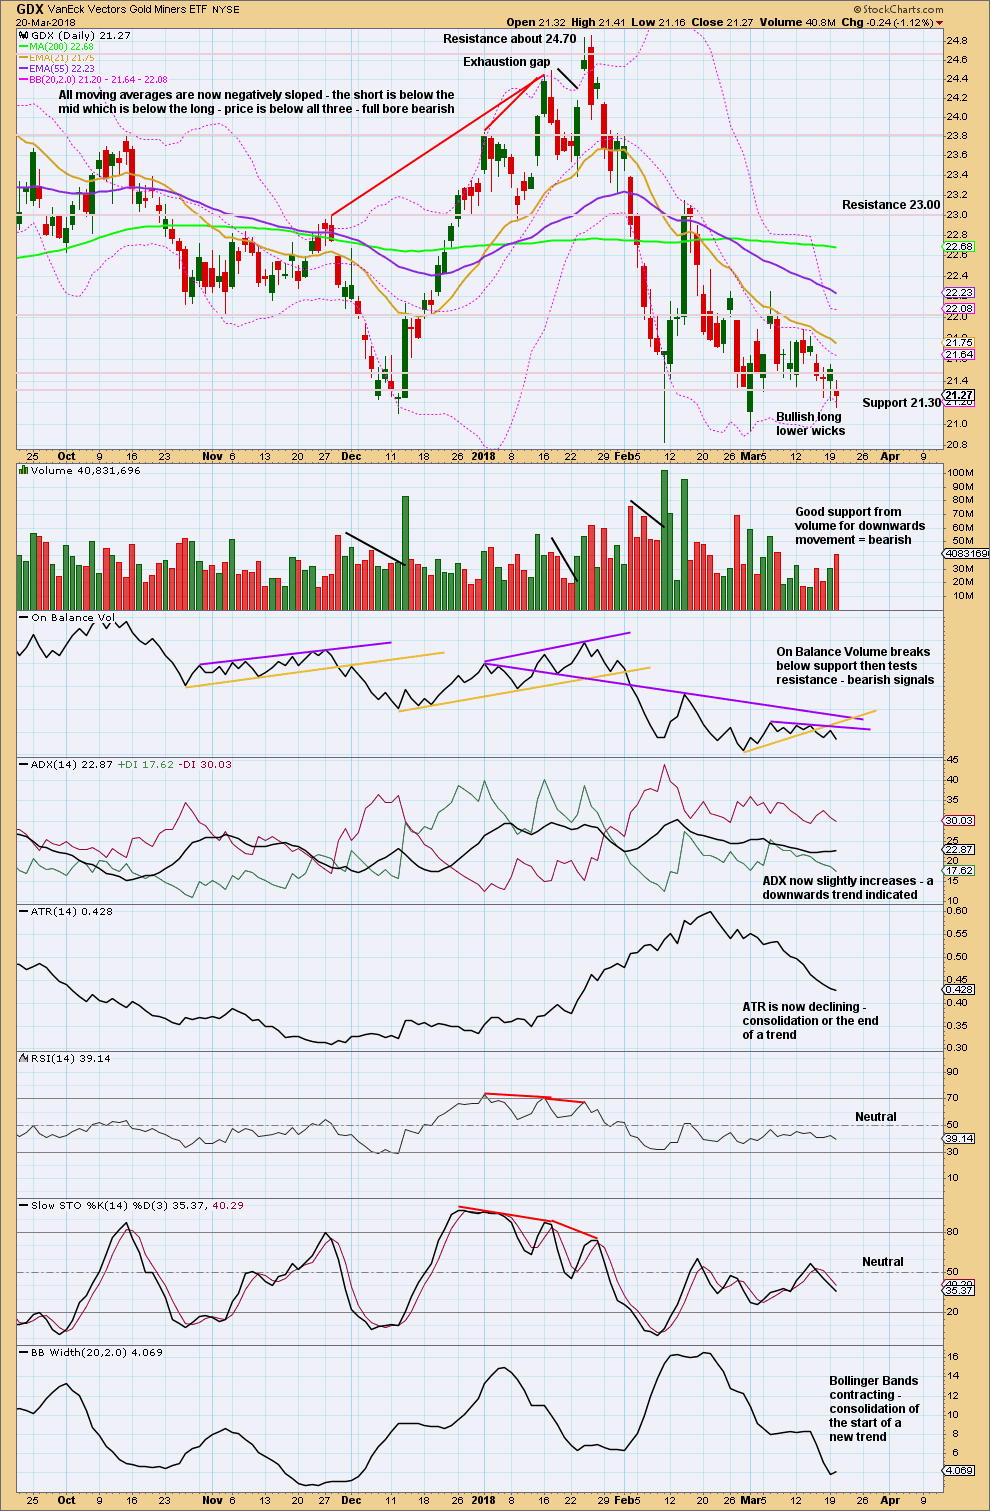
GDX now looks more clearly bearish than Gold.
Next support is about 20.95. If GDX can make a new swing low below 20.95, and especially below 20.84, that would be a further strong bearish signal.
Volume is bearish. On Balance Volume is bearish. ADX is bearish.
RSI and Stochastics indicate there is room for downwards movement to continue.
Published @ 09:23 p.m. EST.
Well, we finally have the bounce I was expecting. And wouldn’t you know it, when I think it’s got one more low… it’s done in.
Corrections really are difficult. I have other words for them. But difficult will have to do.
Something to watch for
https://www.tradingview.com/x/FCYLgnpR/
The Fed will likely raise rates today for the 5th time. Gold bottomed near the previous rate increases as follows:
1st increase: 9 days earlier
2nd increase: 1 day later
3rd increase: 3 days earlier
4th increase: 18 days later
This suggests that Gold may bottom between now and April 16th. Lara doesn’t see a bottom yet.
https://www.tradingview.com/x/jCqcs4Hb/
The Fed will likely raise rates today for the 5th time. GDX bottomed near the previous rate increases as follows:
1st increase: 21 days later
2nd increase: 4 days later
3rd increase: 4 days earlier
4th increase: 17 days later
This suggests that GDX may bottom between now and April 19th. I don’t see a bottom pattern yet, but will be watching.
https://www.tradingview.com/x/X2dg6wDb/