
The upwards swing has been proven by price to be over earlier than expected.
Price remains range bound.
Summary: Expect this downwards swing to continue to support, which is at about 1,310 to 1,305.
Note: Price does not move in a straight line when it is within a consolidation.
New updates to this analysis are in bold.
Grand SuperCycle analysis is here.
Last in-depth historic analysis with monthly and several weekly charts is here, video is here.
There are multiple wave counts at this time at the weekly and monthly chart levels. In order to make this analysis manageable and accessible only two will be published on a daily basis, one bullish and one bearish. This does not mean the other possibilities may not be correct, only that publication of them all each day is too much to digest. At this stage, they do not diverge from the two possibilities below.
BULLISH ELLIOTT WAVE COUNT
FIRST WEEKLY CHART
Click chart to enlarge.
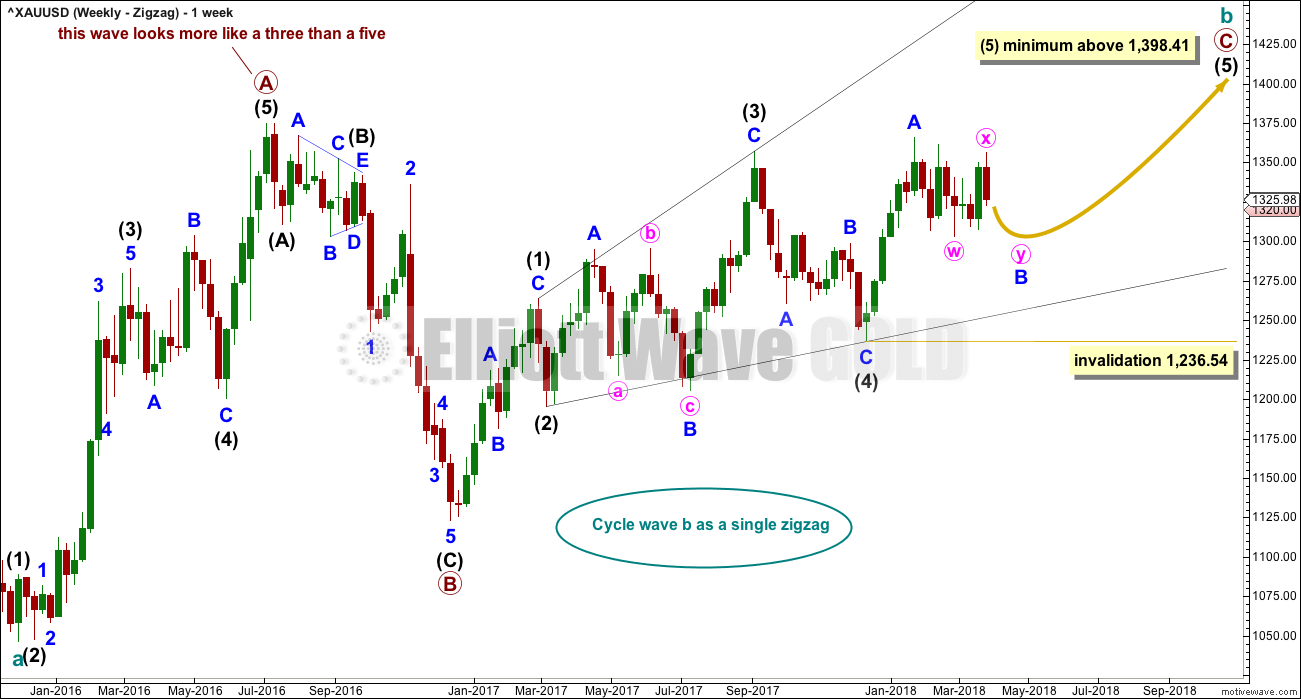
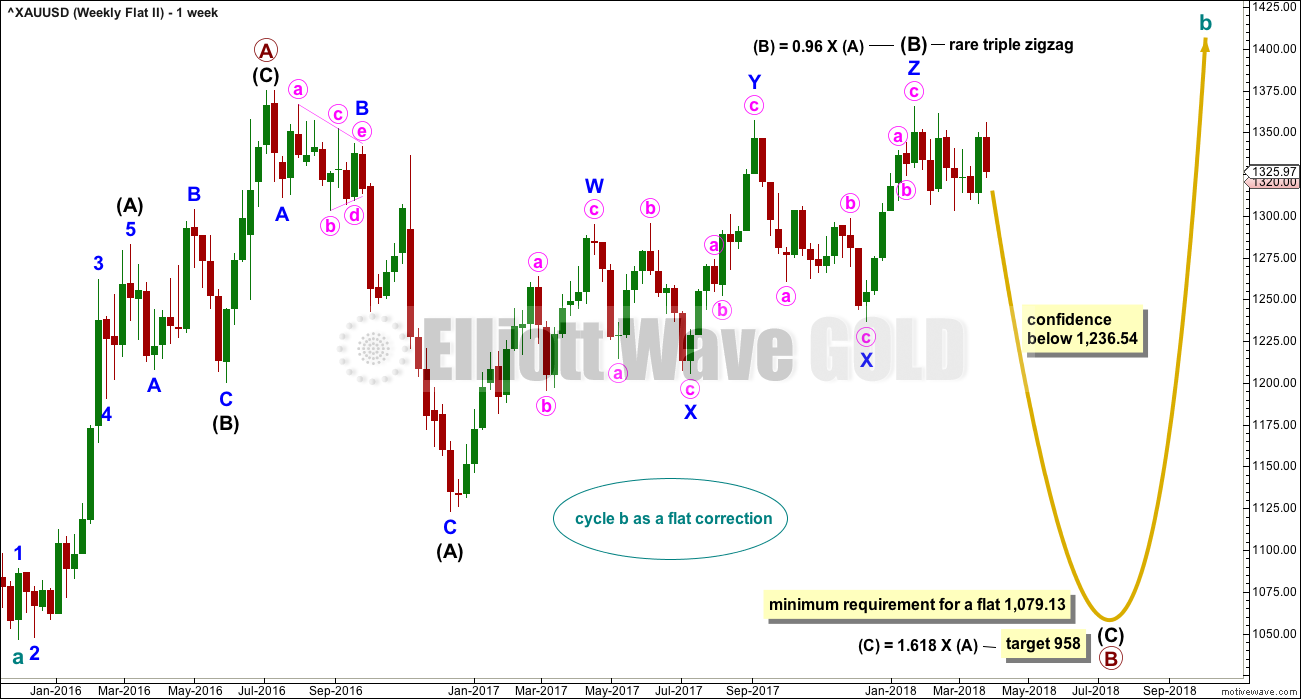
Cycle wave b may be a single zigzag. Zigzags subdivide 5-3-5. Primary wave C must subdivide as a five wave structure and may be either an impulse or an ending diagonal. Overlapping at this stage indicates an ending diagonal.
Within an ending diagonal, all sub-waves must subdivide as zigzags. Intermediate wave (4) must overlap into intermediate wave (1) price territory. This diagonal is expanding: intermediate wave (3) is longer than intermediate wave (1) and intermediate wave (4) is longer than intermediate wave (2). Intermediate wave (5) must be longer than intermediate wave (3), so it must end above 1,398.41 where it would reach equality in length with intermediate wave (3).
Within the final zigzag of intermediate wave (5), minor wave B may not move beyond the start of minor wave A below 1,236.54.
Within the diagonal of primary wave C, each sub-wave is extending in price and so may also do so in time. Within each zigzag, minor wave B may exhibit alternation in structure and may show an increased duration.
Within intermediate wave (1), minor wave B was a triangle lasting 11 days. Within intermediate wave (2), minor wave B was a zigzag lasting 2 days. Within intermediate wave (3), minor wave B was a regular flat lasting 60 days. Within intermediate wave (4), minor wave B was a regular contracting triangle lasting 40 days. Within intermediate wave (5), minor wave B may be expected to be an expanded flat, combination or running triangle to exhibit some alternation in structure. It may last as long as 40 to 60 days. So far it has lasted 44 days (refer to daily chart) and the structure is incomplete.
At this stage, minor wave B may now be a combination or triangle. These two ideas are separated out in daily and hourly charts below.
This first weekly chart sees the upwards wave labelled primary wave A as a five wave structure. It must be acknowledged that this upwards wave looks better as a three than it does as a five. The fifth weekly chart below will consider the possibility that it was a three.
FIRST DAILY CHART – COMBINATION
Click chart to enlarge.
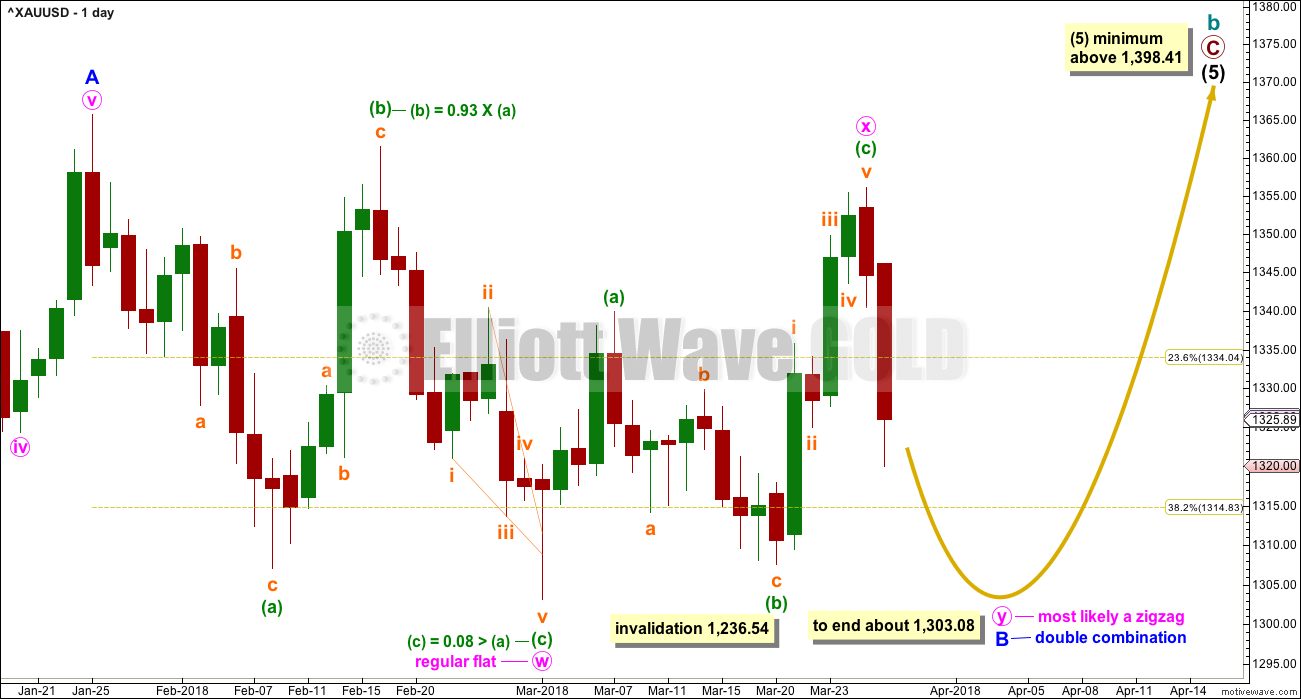
Minor wave B may be a double combination. The first structure in the double may have been a regular flat correction labelled minute wave w.
The double is joined by a three in the opposite direction, a zigzag labelled minute wave x.
The second structure in the double may be a zigzag labelled minute wave y. It would most likely end about the same level as minute wave w, at about 1,303.08, so that the whole structure takes up time and moves price sideways. That is the purpose of double combinations.
When minute wave y is a complete zigzag, then the probability of the combination being over would be very high. While double combinations are very common structures, triples are extremely rare.
While minute wave y may also be a flat correction, in my experience double flats are fairly rare.
Minute wave y may also be a triangle but the expected pathway at this stage would be the same as the triangle wave count below, so it will not be separated out. A triangle within a combination is also in my experience uncommon.
FIRST HOURLY CHART – COMBINATION
Click chart to enlarge.
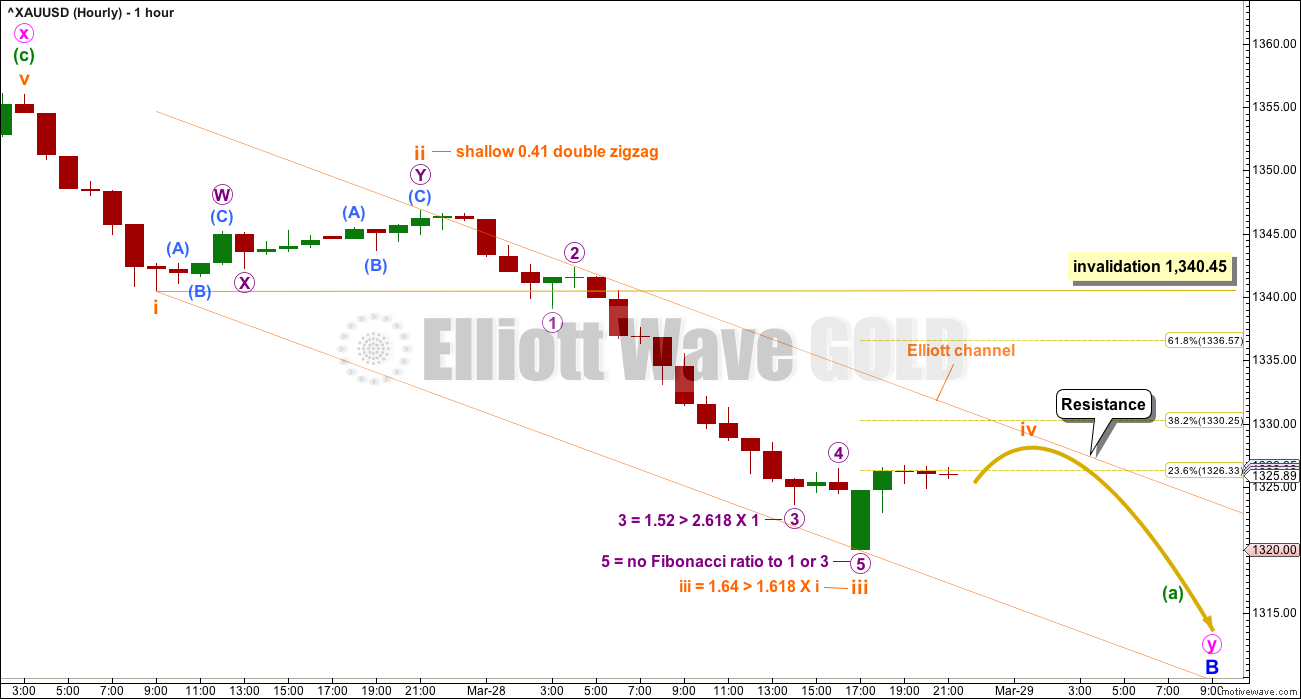
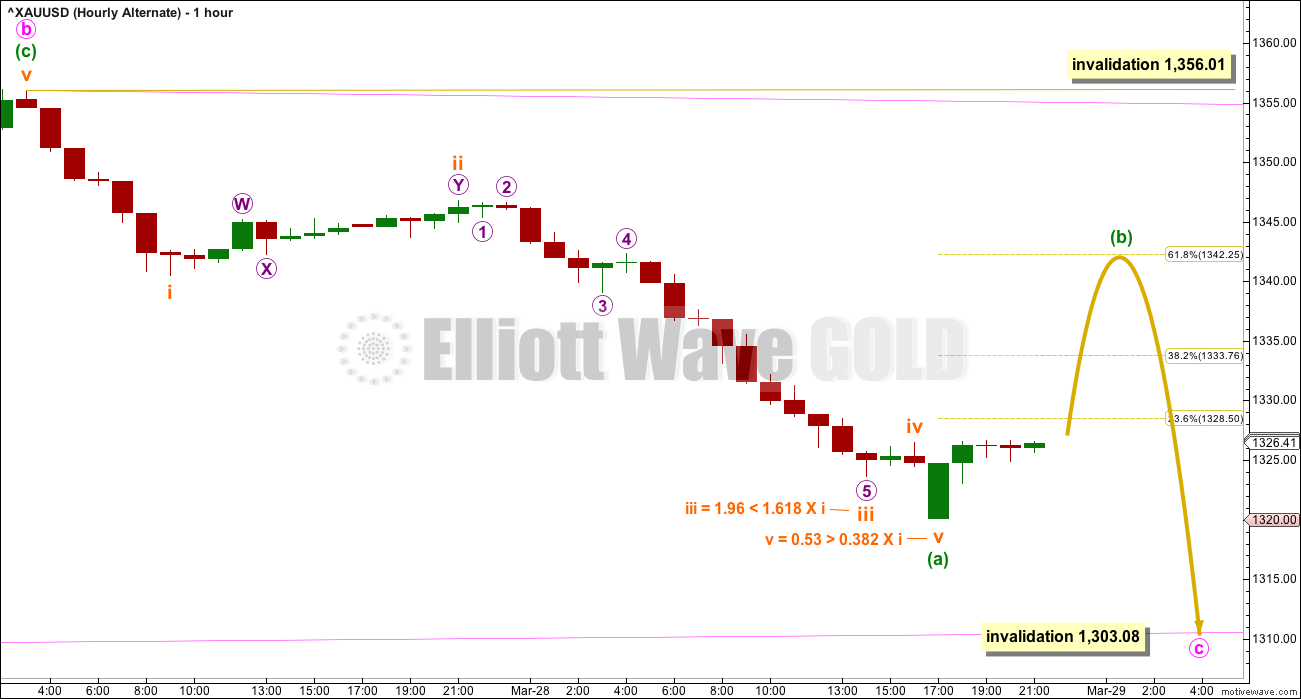
At this stage, an impulse lower looks likely to be unfolding. This may be minuette wave (a) within a zigzag for minute wave y.
Within the impulse, subminuette wave iv may not move up into subminuette wave i price territory above 1,340.45. Subminuette wave iv may end about resistance at the upper edge of the Elliott channel.
When minuette wave (a) is a completed five wave impulse, then a big bounce for minuette wave (b) may be expected to last about one to a few days.
SECOND DAILY CHART – TRIANGLE
Click chart to enlarge.
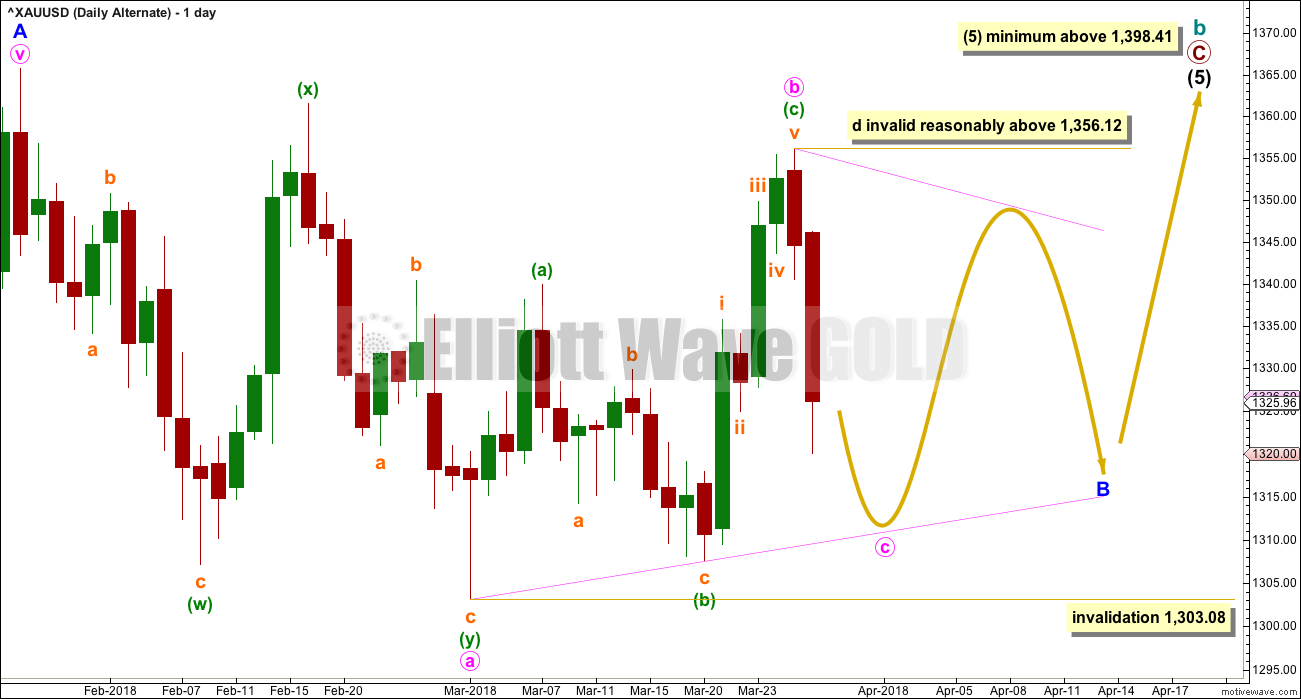
This alternate daily chart is identical to the first daily chart up to the high labelled minor wave A. Thereafter, it looks at a different structure for minor wave B.
Minor wave B may be an incomplete triangle, and within it minute wave a may have been a double zigzag. All remaining triangle sub-waves must be simple A-B-C structures, and three of the four remaining sub-waves must be simple zigzags. One remaining sub-wave may be a flat correction.
Minute wave b may be unfolding upwards as a single zigzag, and within it minuette wave (b) may not move beyond the start of minuette wave (a) below 1,303.08.
This alternate wave count expects weeks of choppy overlapping movement in an ever decreasing range.
Triangles normally adhere very well to their trend lines. The triangle trend lines are commonly tested within the triangle sub-waves. Minuette wave (b) within minute wave b may have found support at the a-c trend line, and this indicates where minute wave c may end.
Minute wave c of the triangle may not move beyond the end of minute wave a below 1,303.08.
Minute wave d of a contracting triangle may not move beyond the end of minute wave b above 1,356.12. Minute wave d of a barrier triangle should end about the same level as minute wave b; the triangle will remain valid as long as the b-d trend line remains essentially flat. In practice, this means minute wave d can end slightly above 1,356.12. This invalidation point is not black and white; it involves an area of subjectivity.
Contracting triangles are the most common type. Barrier triangles are not common, but nor are they rare.
SECOND HOURLY CHART – TRIANGLE
Click chart to enlarge.
The first hourly chart works for the triangle in the same way: it is possible that minuette wave (a) may be an incomplete impulse with only subminuette wave v to complete lower.
It is also possible that minuette wave (a) could be over at today’s low (this alternate idea is considered in this chart).
If minuette wave (a) is complete, then minuette wave (b) should continue for one to a few days, so that it shows up on the daily chart giving minute wave y a three wave look to it.
Minuette wave (b) may reach up to either the 0.382 or 0.618 Fibonacci ratios of minuette wave (a). Neither may be favoured.
Thereafter, minuette wave (c) downwards should move lower to make new lows below the end of minuette wave (a).
Minuette wave (b) may not move beyond the start of minuette wave (a) above 1,356.01.
BEARISH ELLIOTT WAVE COUNT
FIFTH WEEKLY CHART
Click chart to enlarge.
There were five weekly charts published in the last historic analysis. This fifth weekly chart is the most immediately bearish wave count, so this is published as a bearish possibility.
This fifth weekly chart sees cycle wave b as a flat correction, and within it intermediate wave (B) may be a complete triple zigzag. This would indicate a regular flat as intermediate wave (B) is less than 1.05 the length of intermediate wave (A).
If cycle wave b is a flat correction, then within it primary wave B must retrace a minimum 0.9 length of primary wave A at 1,079.13 or below. The most common length of B waves within flats is from 1 to 1.38 times the length of the A wave. The target calculated would see primary wave B end within this range.
I have only seen two triple zigzags before during my 10 years of daily Elliott wave analysis. If this wave count turns out to be correct, this would be the third. The rarity of this structure is identified on the chart.
FIFTH DAILY CHART
Click chart to enlarge.
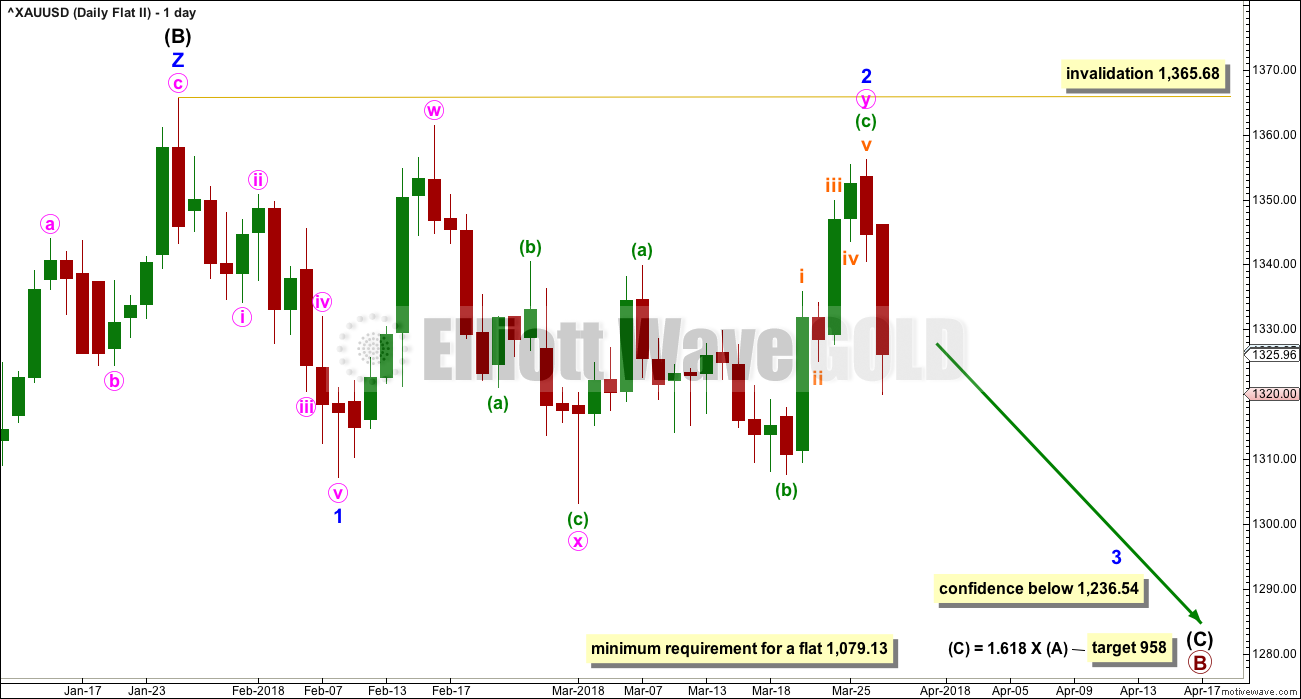
If a new wave down at intermediate degree is beginning, then the first wave of minor wave 1 must subdivide as a five, which may only be an impulse or a leading diagonal.
Minor wave 1 may have been a complete impulse over on the 8th of February. But this downwards wave does not look very good as a five. It can be made to fit at lower time frames, but this movement fits better as a zigzag. The probability of this wave count is reduced.
This wave count has very substantially reduced in probability today with a new low below 1,339.89.
I have considered all possibilities I can see of how to label minor wave 2. This labelling does not violate any Elliott wave rules, but it grossly ignores guidelines on the purpose and look of a structure. This is the best labelling I can find for minor wave 2.
Minor wave 2 is here labelled as a double zigzag. Double zigzags should have a strong slope against the prior trend. Here, minor wave 2 should have a strong upwards slope, but it does not have an upwards slope and instead has a slight downwards bias.
Within double zigzags, the X wave has no rule regarding a minimum nor maximum, but it should not make a new price extreme beyond the first zigzag in the double (or second in a rare triple) so that the whole structure has a strong slope. Here, minute wave x makes a new low below the start of minute wave y.
The purpose of a second zigzag in a double is to deepen the correction when the first did not move price deep enough. Here, the first zigzag is extremely deep (so a second was not required) and the second zigzag does not deepen the correction. It is not technically truncated but the effect is the same.
The whole structure for minor wave 2 as labelled here must be judged to have a lower probability than a running flat correction.
This chart has such a low probability that it should not be reasonably considered and will not be published again.
TECHNICAL ANALYSIS
WEEKLY CHART
Click chart to enlarge. Chart courtesy of StockCharts.com.
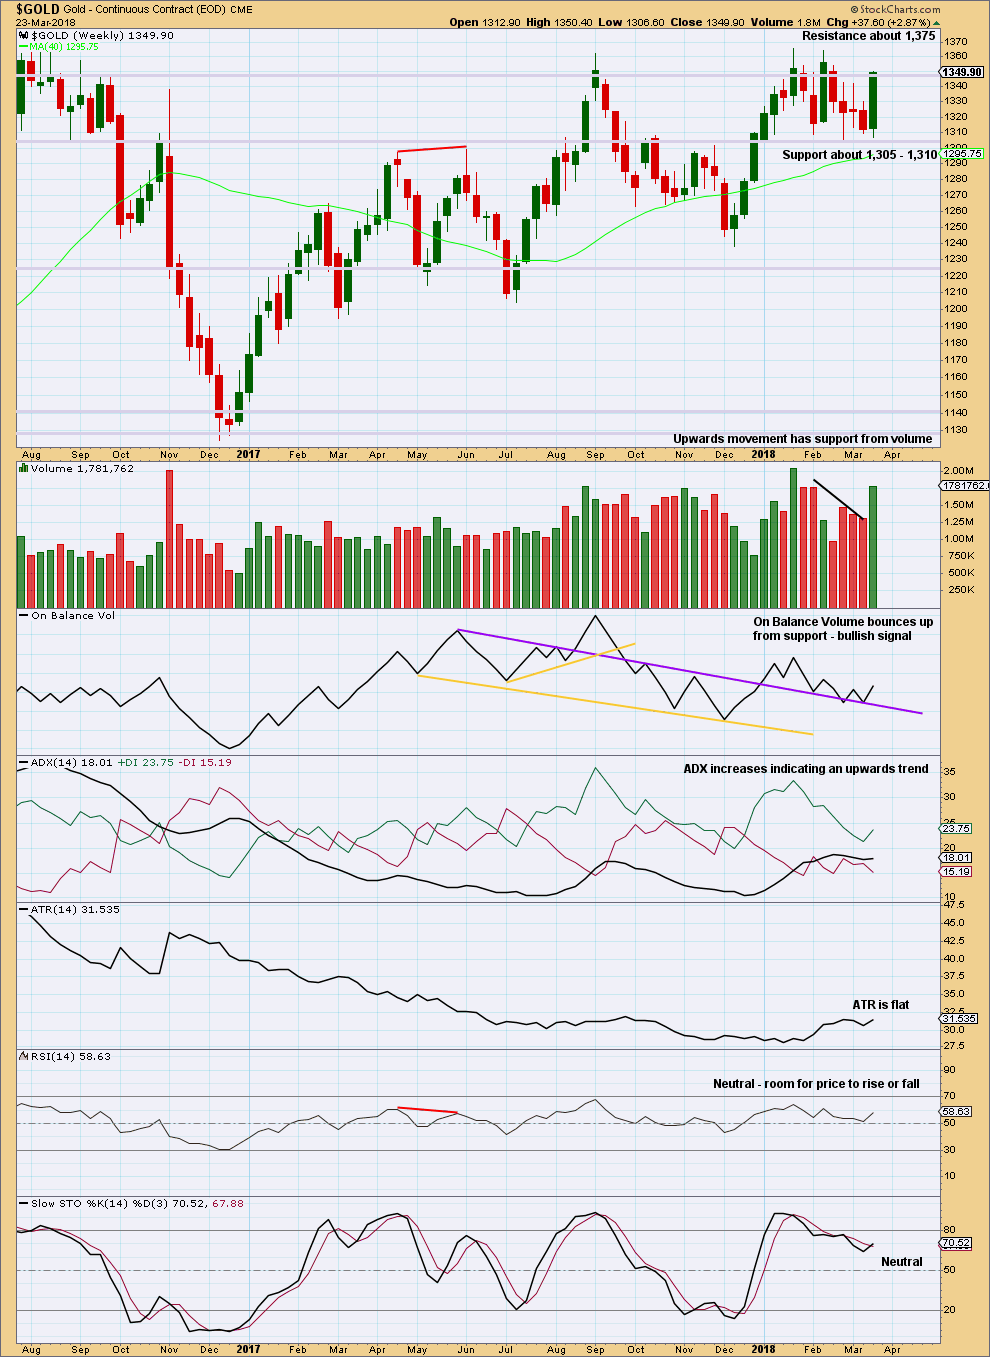
Again, price bounces up off support. Last week’s strong weekly candlestick with an almost shaven head is very bullish. Support from volume and a bullish signal from On Balance Volume all support the Elliott wave analysis which expects upwards movement is incomplete.
Look for final resistance about 1,375.
DAILY CHART
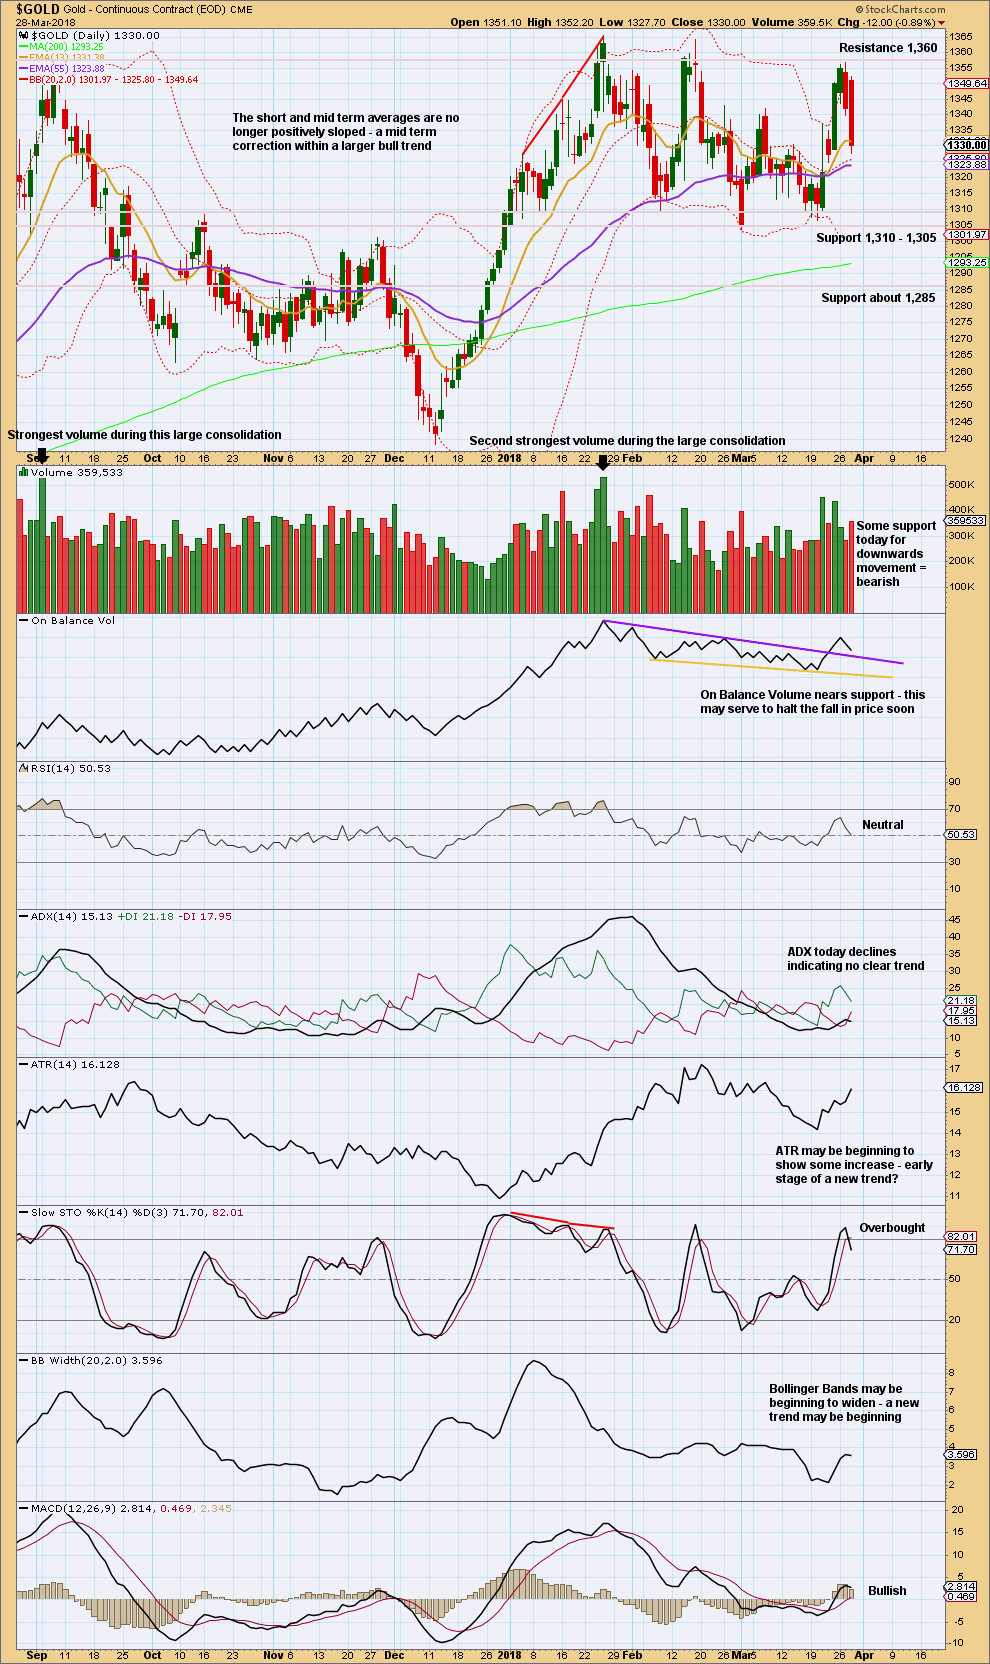
Click chart to enlarge. Chart courtesy of StockCharts.com.
Looking at the bigger picture, Gold has been within a large consolidation since about January 2017 (this chart does not show all of this large consolidation), and during this consolidation it is two upwards days that have strongest volume and an upwards week that has strongest volume. Volume suggests an upwards breakout may be more likely than downwards.
Currently, Gold is within a smaller consolidation that began in early January 2018. This consolidation is delineated by support about 1,310 to 1,305 and resistance (final) about 1,375. It is an upwards day during this smaller consolidation that has strongest volume, suggesting an upwards breakout may be more likely here than downwards.
Price has turned down from resistance and Stochastics reached overbought. Look now for a downwards swing to continue to support. On Balance Volume may halt the fall in price; this may force the downwards swing to be relatively shallow.
GDX WEEKLY CHART
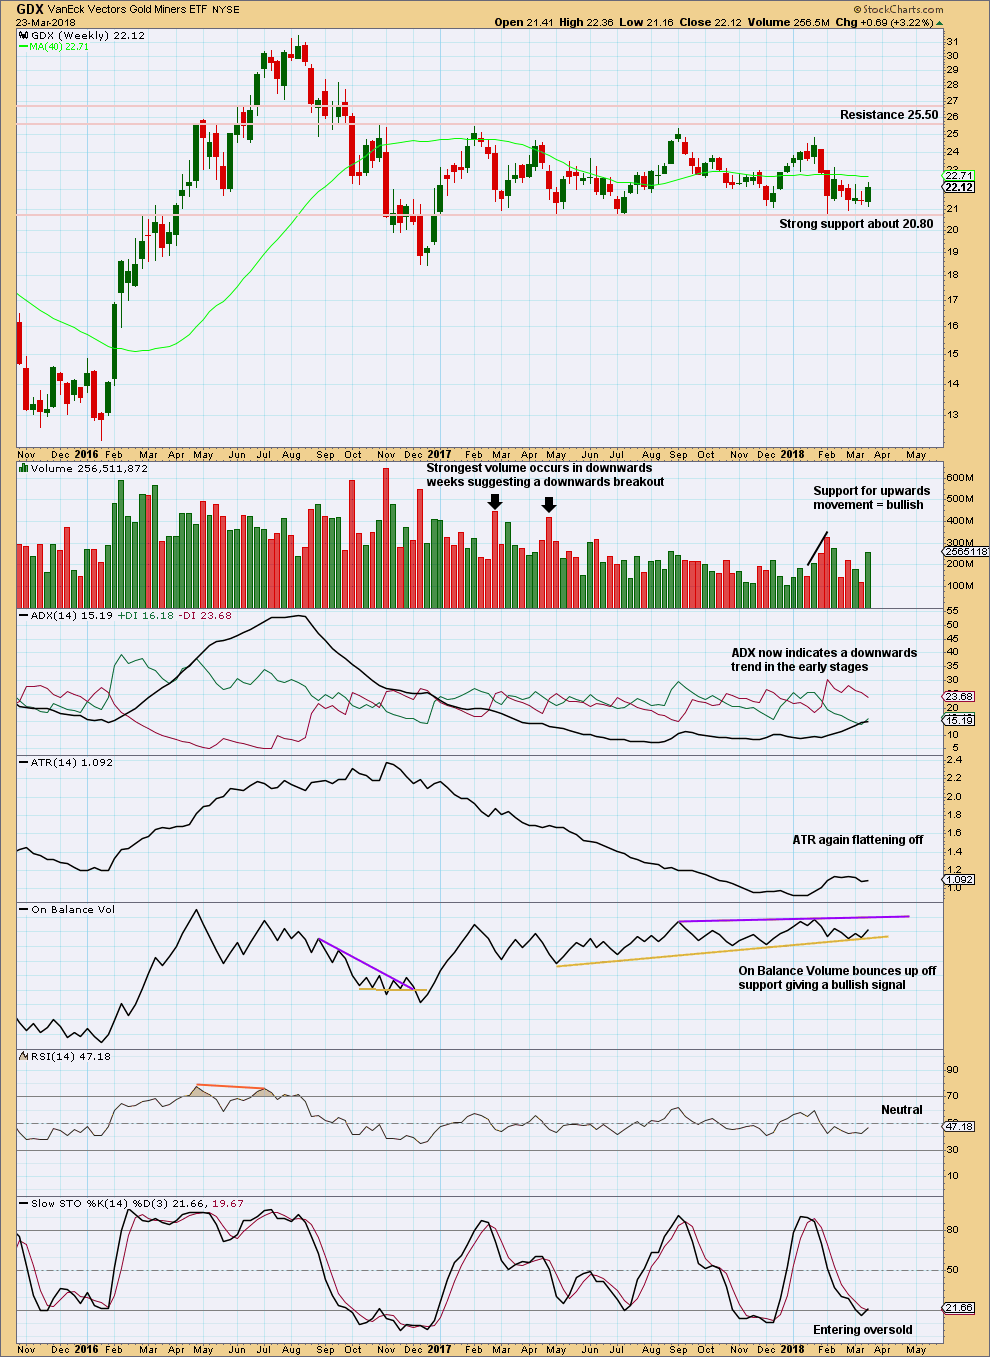
Click chart to enlarge. Chart courtesy of StockCharts.com.
Support about 20.80 has been tested about eight times and so far has held. The more often a support area is tested and holds, the more technical significance it has.
In the first instance, expect this area to continue to provide support. Only a strong downwards day, closing below support and preferably with some increase in volume, would constitute a downwards breakout from the consolidation that GDX has been in for a year now.
Resistance is about 25.50. Only a strong upwards day, closing above resistance and with support from volume, would constitute an upwards breakout.
Bullish volume last week and a bullish signal from On Balance Volume offer support to the view that an upwards swing should continue here to resistance.
GDX DAILY CHART
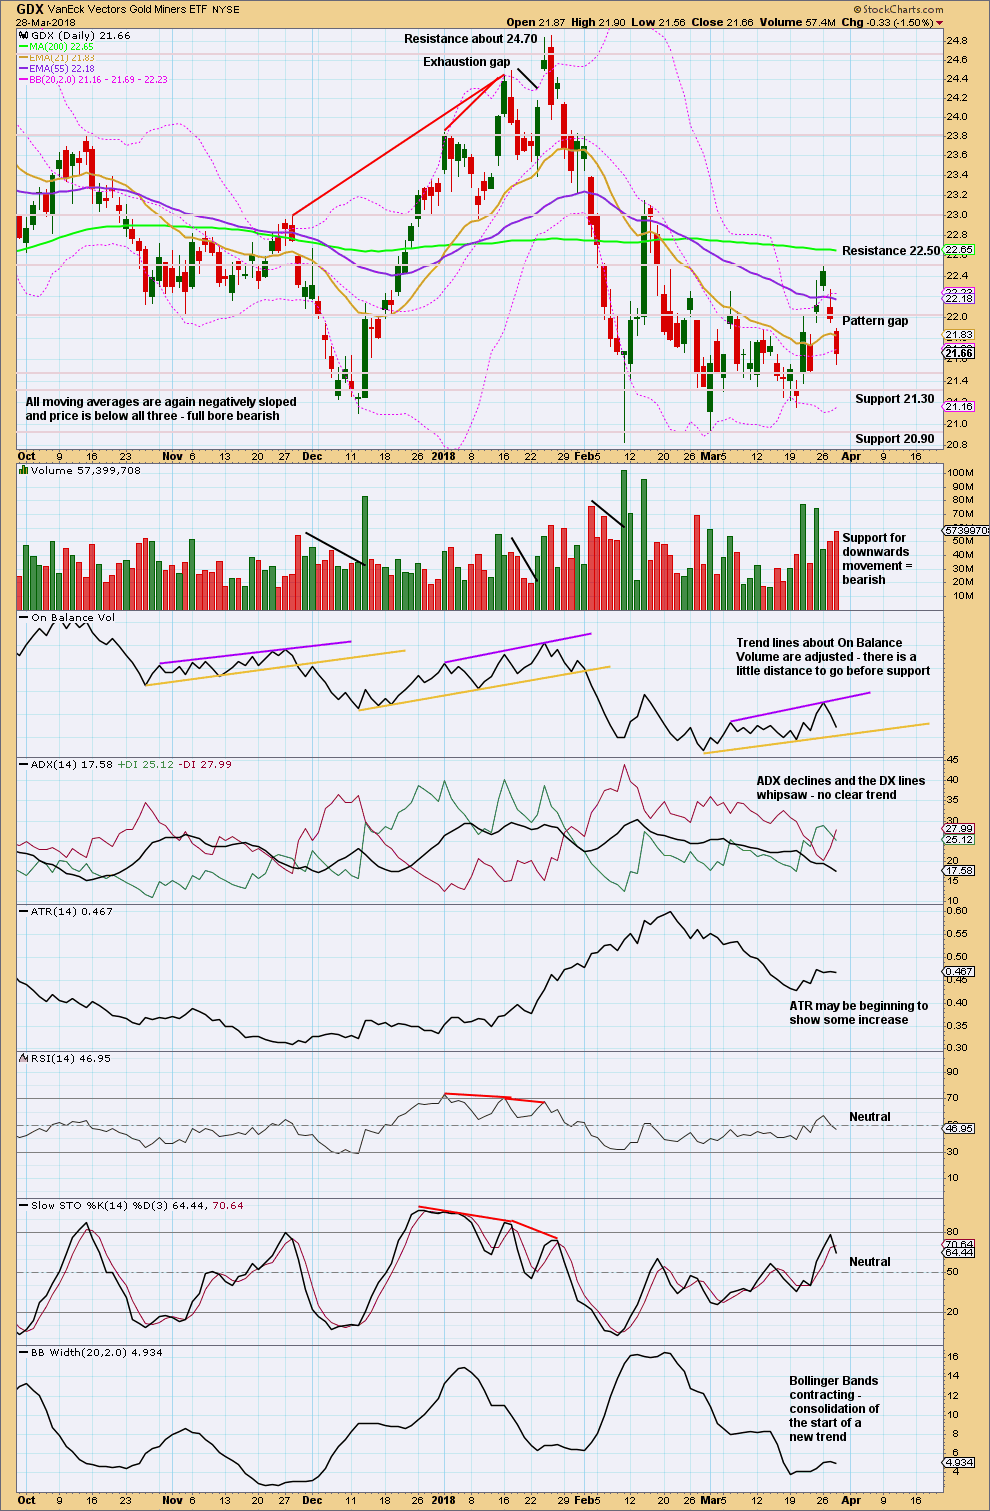
Click chart to enlarge. Chart courtesy of StockCharts.com.
GDX is range bound at both weekly and daily time frames. The smaller consolidation here has resistance now about 22.50 and support about 21.30 and 20.90.
On Balance Volume is range bound also.
During this consolidation, Stochastics is not reaching oversold and overbought. Look for a downwards swing to continue here until On Balance Volume finds support, price finds support, and Stochastics nears oversold (but may not reach it).
Published @ 11:05 p.m. EST.
Plinker: I did get your contact request and I did email back that day. Add me to your contacts: admin@elliottwavegold.com and that should ensure my emails get through.
I have seen your comments on Silver and replied there. From now on I’ll keep checking daily there. It’s been a very long time since anyone showed interest in Silver, so after it moves below the fold after a couple of days I tend to not check it. I’ll stop doing that.
The best way to get hold of me for members is email me. I check my emails at least twice a day.
Or in the comments on the Gold daily analysis. I’m here every afternoon EST and again in the evening EST.
Main hourly updated:
This is now looking slightly less likely than the alternate.
Both hourly charts expect a zigzag is unfolding lower. The difference at the hourly chart time frame is where minuette wave (a) may have ended.
The duration of the current correction labelled subminuette iv on this first hourly chart now indicates this looks less likely.
Second hourly chart updated:
If minuette wave (a) was over at the last low then the current bounce has a better proportion as minuette wave (b).
This looks better.
And while my arrow on that second chart has minuette (b) reaching up to the 0.618 Fibonacci ratio, it doesn’t have to get that high. The 0.382 Fibonacci ratio is a reasonable target also. Neither may be favoured.
Hi Lara,
I am using Chrome to view your analysis. I have tried Mozilla, but use Chrome 90% of time. Like Dreamer, I have tried repeatedly to go to links you mention under Lara’s Wkly. Like Dreamer, I am surmising that the only link that IS active is the ‘Grand Super Cycle’ link. The historic monthly chart & video, alternate monthly and historic example links do NOT work [Not active].
Can we all assume that unless one Is a Member of your Stock Market site, this is currently the Only way one can access these links?
Once you offer your Long term/Swing trade service for SPX as a pay service, if we join this service, but Not your Daily stock mkt. service; will we be able to access all SPX links mentioned above; OR will one have to join Both daily sites to have ability to access All links mentioned above on LT/Swing service?
Thank you…
Yes, the links should all work for members of EWG and EWSM.
If you’re a member of one and not the other then currently the links for the site you’re not a member of won’t work.
And yes, once the service is launched members of it will have access to everything that is linked to.
Am I the only one in here that cares about Silver and Oil as well as Gold? Honestly, I’d rather have more updates on Silver. I think that’s where the big moves are going to be. On Oil, I mean we just had a launch of a Gold backed Petro Yuan. Brics nations are circumventing the USD. There’s a LOT of big things going on that the media is sweeping under the rug and focusing on distractions.
I suspect you may be in a minority there. Silver almost never gets any comments. I still do it once a week. IMO it would actually be best done end of week, then each week I’d have a full weekly candlestick to analyse.
Oil gets more attention. More comments and more requests for it to be done more often.
And from my POV, Silver is actually the most difficult market I’m currently analysing. The volume must be lower than Gold and Oil. Its Elliott wave structures don’t look as good. Its corrections are the worst.
Thank you so much!
Lara, one last try. The links listed below from “Lara’s Weekly” dated 3/24 land on the “members only content” page for EWSM. I am logged in as an EWG member. The first link to the Grand Super Cycle analysis (not shown) works perfect.
Thank you
_____________________________________________________
Last historic analysis with monthly charts is here. Video is here.
An alternate idea at the monthly chart level is given here at the end of this analysis.
An historic example of a cycle degree fifth wave is given at the end of the analysis here.
OOO, I think I see what you’re saying Dreamer. That’s just for S&P. The Gold works fine. I think you must pay a separate membership to see that info. She’s providing teaser info across platforms so you’ll subscribe to both. Go here http://elliottwavestockmarket.com sign up, then you should be able to see monthly cycles.
I missed that you are a member there. I recant my previous statement. Anyhow, now all we are doing is distracting from the message here. Is this the only way to communicate with Lara and Cesar for these issues? I know I sent a contact request and never heard back. Also commented in Silver with no response. Maybe there needs to be an alternate forum.
Your Silver comment I missed, so sorry. After a few days I tend to not check it again. I’ll go over there and respond. And I’ll check it daily from now on.
I’m looking for your contact form request. It should land in Cesar’s email box, and he passes them onto me daily (he’s screening, I get some… odd stuff).
The quickest way to get hold of me is email me at admin@elliottwavegold.com. I check this at least twice a day and the volume is not usually great enough that I miss anything.
Otherwise, I’m here every morning and afternoon (my time, EST in the afternoon and evening) checking comments and replying.
I found your contact request. I emailed you back on the 28th of March.
You were asking about times of charts? It’s all in EST time.
Has my email landed in your junk box perhaps?
I just checked. It was in spam. My apologies.
Brilliant. Glad it’s now there
I really am so sorry Dreamer. I’m going to ask Cesar to look at this again and make sure they’re all working for people who are members of both EWSM and EWG.
To see the content linked to you have to be a member of that website.
If the person clicking isn’t a member, they can’t see it.
When the service is launched then paid members of it will see any and all content linked to.
I really am so sorry for this hassle, and thank you very much for your patience.