
The target for a downwards swing to end was about 1,306. Today price moved lower to reach 1,310.
Summary: The downwards swing may be over at today’s low. In the first instance, a new high above 1,320.61 would offer confidence a low is in place. Reasonable confidence of a low in place may be had if price breaks above the channel on the hourly chart.
If the low is not in place today, then it may be tomorrow about 1,306.
An upwards breakout from the consolidation that began in January may come now within the next one to very few weeks. The target is now at 1,439.
Always trade with stops to protect your account. Risk only 1-5% of equity on any one trade.
New updates to this analysis are in bold.
Grand SuperCycle analysis is here.
Last in-depth historic analysis with monthly and several weekly charts is here, video is here.
There are multiple wave counts at this time at the weekly and monthly chart levels. In order to make this analysis manageable and accessible only two will be published on a daily basis, one bullish and one bearish. This does not mean the other possibilities may not be correct, only that publication of them all each day is too much to digest. At this stage, they do not diverge from the two possibilities below.
BULLISH ELLIOTT WAVE COUNT
FIRST WEEKLY CHART
Click chart to enlarge.
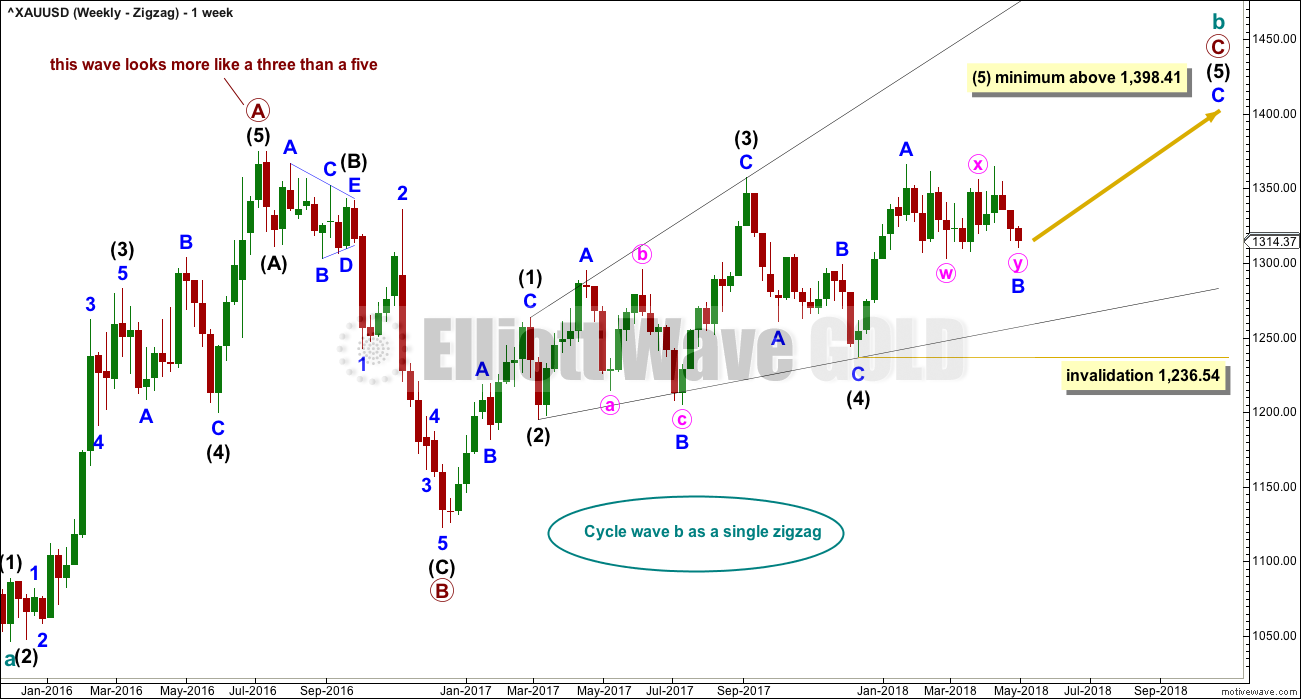
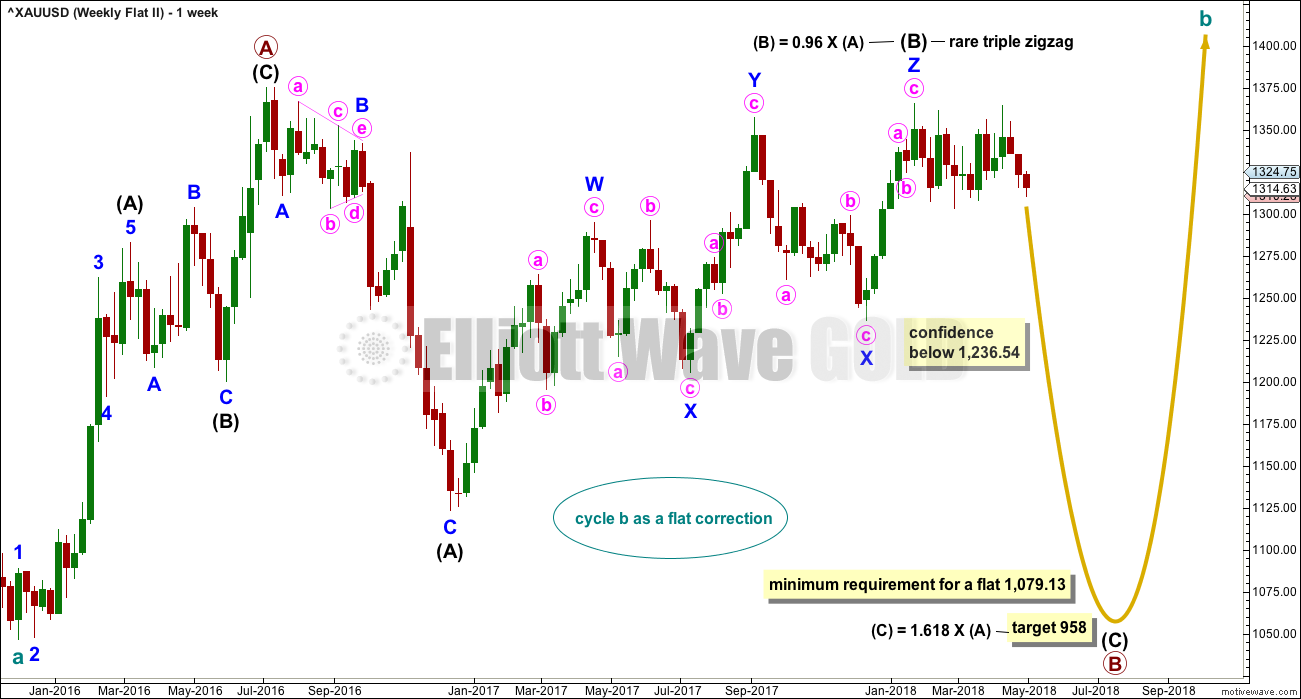
Cycle wave b may be a single zigzag. Zigzags subdivide 5-3-5. Primary wave C must subdivide as a five wave structure and may be either an impulse or an ending diagonal. Overlapping at this stage indicates an ending diagonal.
Within an ending diagonal, all sub-waves must subdivide as zigzags. Intermediate wave (4) must overlap into intermediate wave (1) price territory. This diagonal is expanding: intermediate wave (3) is longer than intermediate wave (1) and intermediate wave (4) is longer than intermediate wave (2). Intermediate wave (5) must be longer than intermediate wave (3), so it must end above 1,398.41 where it would reach equality in length with intermediate wave (3).
Within the final zigzag of intermediate wave (5), minor wave B may not move beyond the start of minor wave A below 1,236.54. However, if it were now to turn out to be relatively deep, it should not get too close to this invalidation point as the lower (2)-(4) trend line should provide strong support. Diagonals normally adhere very well to their trend lines.
Within the diagonal of primary wave C, each sub-wave is extending in price and so may also do so in time. Within each zigzag, minor wave B may exhibit alternation in structure and may show an increased duration.
Within intermediate wave (1), minor wave B was a triangle lasting 11 days. Within intermediate wave (3), minor wave B was a regular flat lasting 60 days. Intermediate wave (5) is expected to be longer in price than intermediate wave (3), and so it may also be longer in duration. Minor wave B within it may last longer than minor wave B within intermediate wave (3).
At this stage, minor wave B may now be a double flat or triangle. These two ideas are separated out in daily charts below.
This first weekly chart sees the upwards wave labelled primary wave A as a five wave structure. It must be acknowledged that this upwards wave looks better as a three than it does as a five. The fifth weekly chart below will consider the possibility that it was a three.
FIRST DAILY CHART – DOUBLE FLAT

Click chart to enlarge.
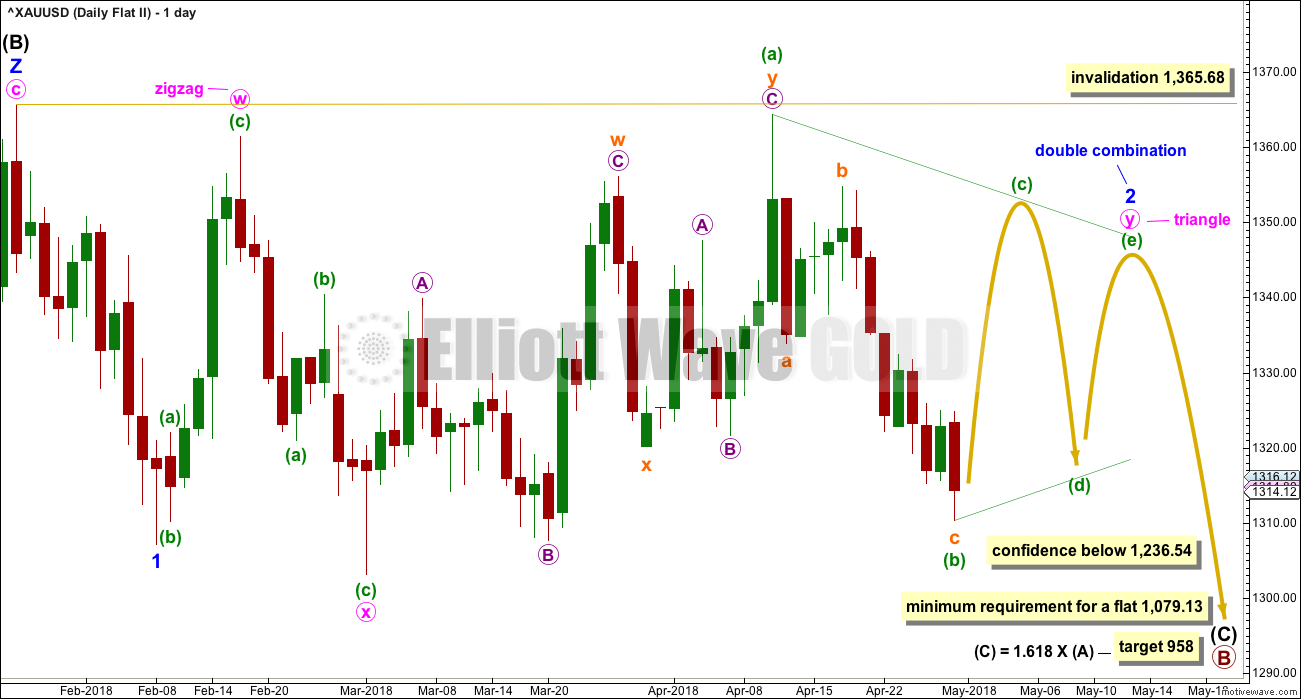
Minor wave B may be a relatively rare double flat correction.
Within this possible double flat, the first flat labelled minute wave w is a regular flat. The second flat labeled minute wave y may be an expanded flat, providing alternation with the first.
Within the expanded flat of minute wave y, minuette wave (b) is within the common range of from 1 to 1.38 times the length of minuette wave (a). If minuette wave (c) is over at today’s low, then it exhibits a Fibonacci ratio to minuette wave (a).
Minute wave y may have ended close to the same level as minute wave w; the double flat has a sideways look and achieves its purpose of taking up time and moving sideways. Minor wave B may have ended just at the area of strong support.
A target is calculated for minor wave C to complete the zigzag of intermediate wave (5). This may be the last upwards wave in a multi year consolidation for cycle wave b.
HOURLY CHART – DOUBLE FLAT
Click chart to enlarge.
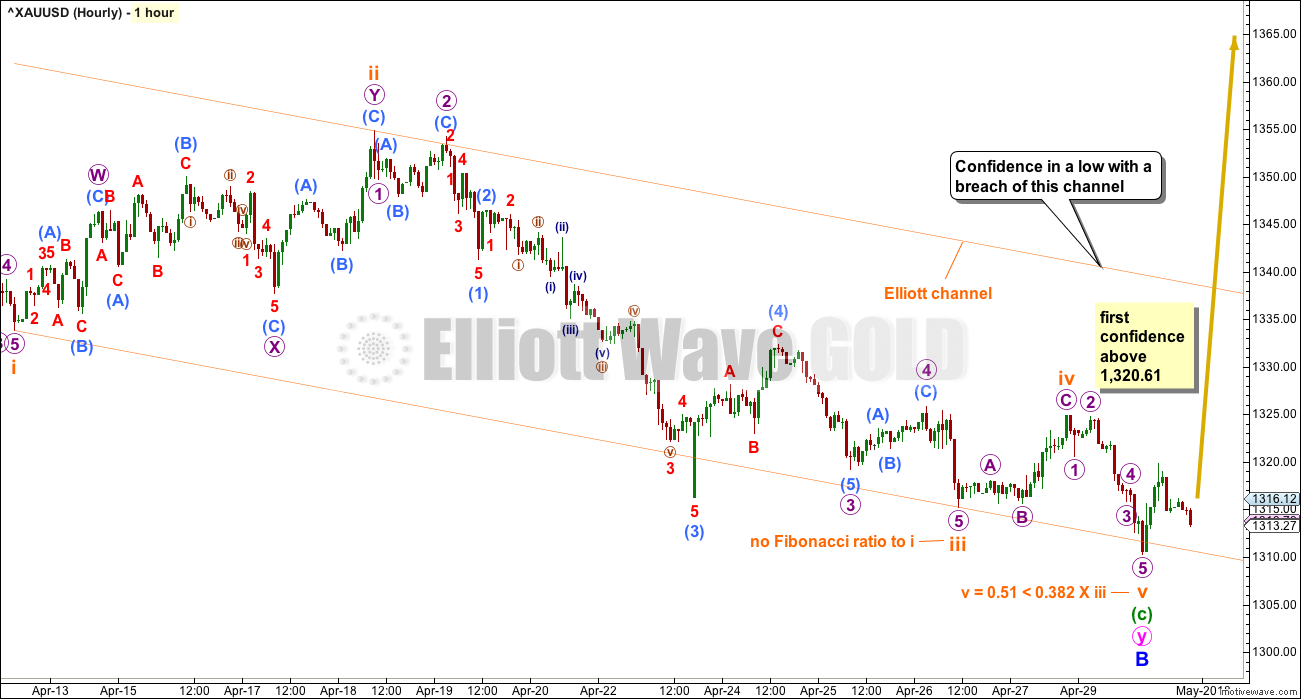
Minuette wave (c) may now be seen as a complete five wave impulse. If subminuette wave v is over at today’s low, then it would exhibit a Fibonacci ratio to subminuette wave iii.
A new high above 1,320.61 would invalidate the alternate hourly chart below and provide first confidence that a low may be in place. Thereafter, a breach of the Elliott channel would provide further confidence.
ALTERNATE HOURLY CHART – DOUBLE FLAT
Click chart to enlarge.
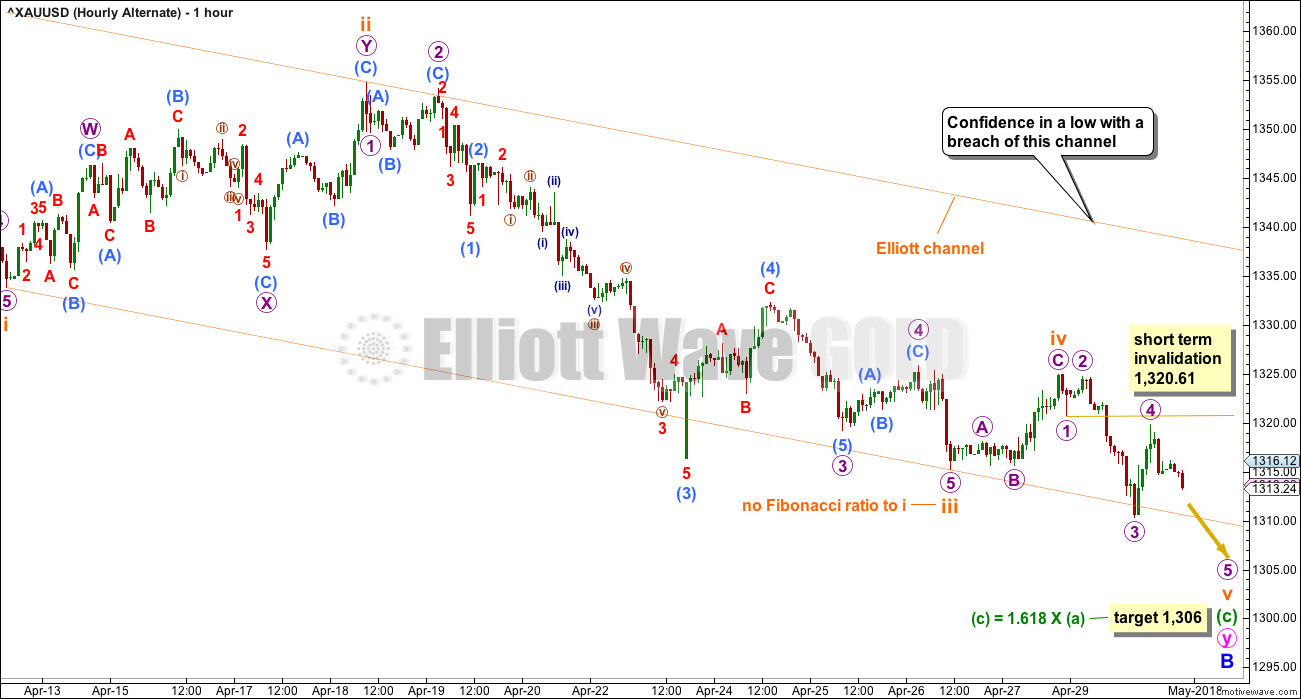
It is also possible that subminuette wave v may not be complete. The last bounce at the end of this session may have been micro wave 4 within an incomplete impulse for subminuette wave v.
Micro wave 4 may not move into micro wave 1 price territory above 1,320.61.
Minuette wave (c) may move a little lower to more closely exhibit a Fibonacci ratio to minuette wave (a).
SECOND DAILY CHART – TRIANGLE
Click chart to enlarge.
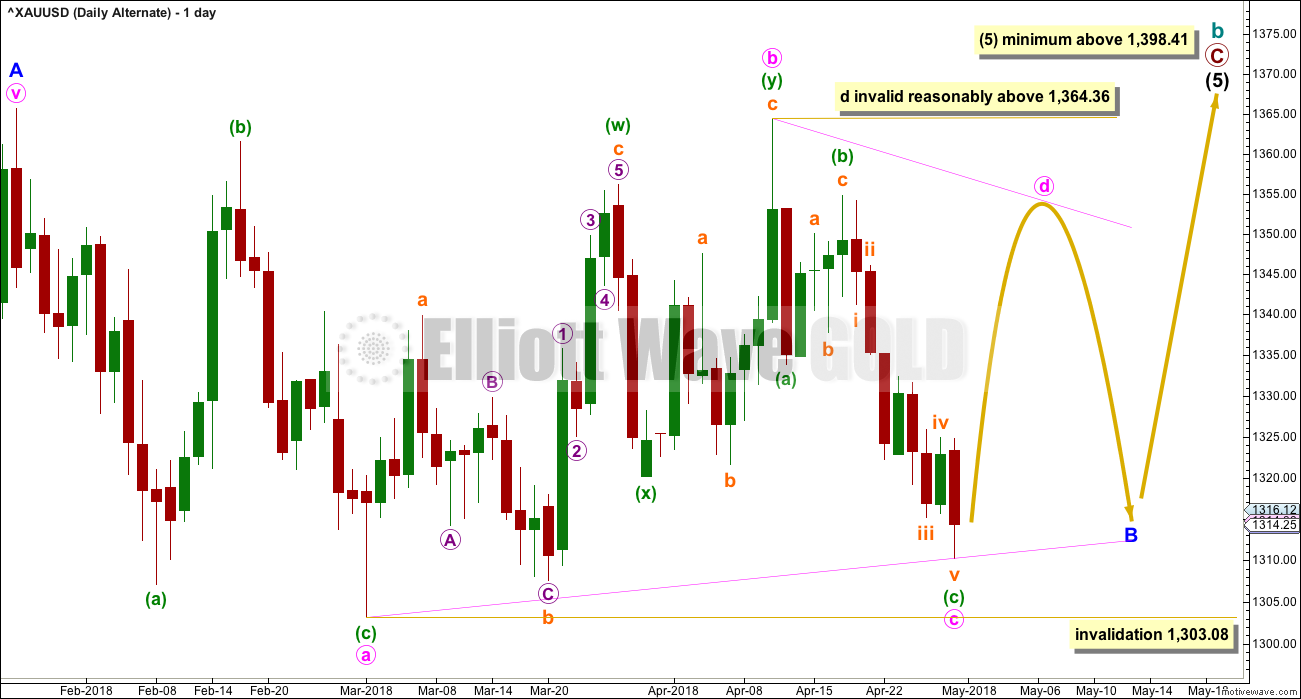
This daily chart is identical to the first daily chart up to the high labelled minor wave A. Thereafter, it looks at a different structure for minor wave B.
A triangle for minor wave B may still be valid. Within a triangle, four of the five sub-waves must sub-divide as zigzags and one sub-wave usually subdivides as a double zigzag; the double zigzag is most commonly wave C of the triangle, but it may be any sub-wave. Here, it may have been minute wave b.
All remaining triangles must be simple A-B-C structures, most likely zigzags.
It is again possible now that minute wave c may have been over. Triangles normally adhere strictly to their trend lines; with downwards movement continuing this week, the lower a-c trend line now has no overshoots nor breaches.
Minute wave c may not move beyond the end of minute wave a below 1,303.08 for both a contracting or barrier triangle. Thereafter, minute wave d may not move above the end of minute wave b at 1,364.36 for a contracting triangle. For a barrier triangle, minute wave d may end about the same level as minute wave b in order for the b-d trend line to look essentially flat.
A final small zigzag downwards for minute wave e would most likely fall short of the a-c trend line.
This wave count still allows for choppy overlapping movement in an ever decreasing range for several weeks. Minor wave B may be as long lasting as a Fibonacci 21 weeks if it is a triangle, as triangles do tend to be very long lasting structures.
BEARISH ELLIOTT WAVE COUNT
FIFTH WEEKLY CHART
Click chart to enlarge.
There were five weekly charts published in the last historic analysis. This fifth weekly chart is the most immediately bearish wave count, so this is published as a bearish possibility.
This fifth weekly chart sees cycle wave b as a flat correction.
If cycle wave b is a flat correction, then within it primary wave B must retrace a minimum 0.9 length of primary wave A at 1,079.13 or below. The most common length of B waves within flats is from 1 to 1.38 times the length of the A wave. The target calculated would see primary wave B end within this range.
Primary wave B may be subdividing as a regular flat correction, and within it both intermediate waves (A) and (B) subdivide as three wave structures. Intermediate wave (B) fits as a triple zigzag.
I have only seen two triple zigzags before during my 10 years of daily Elliott wave analysis. If this wave count turns out to be correct, this would be the third. The rarity of this structure is identified on the chart.
FIFTH DAILY CHART
Click chart to enlarge.
Minor wave 1 may have been a relatively brief impulse over at the low of the 8th of February. Thereafter, minor wave 2 may be an incomplete double combination.
The first structure in the double may be a zigzag labelled minute wave w. The double may be joined by a three in the opposite direction, a zigzag labelled minute wave x. The second structure in the double may be an incomplete triangle labelled minute wave y. This structure may yet take some weeks to complete. In my experience a double combination with a triangle for minute wave y is not very common. This reduces the probability of this wave count, but it remains valid.
This wave count is a good solution for this bearish wave count. All subdivisions fit and there are no rare structures so far within intermediate wave (C).
TECHNICAL ANALYSIS
WEEKLY CHART
Click chart to enlarge. Chart courtesy of StockCharts.com.
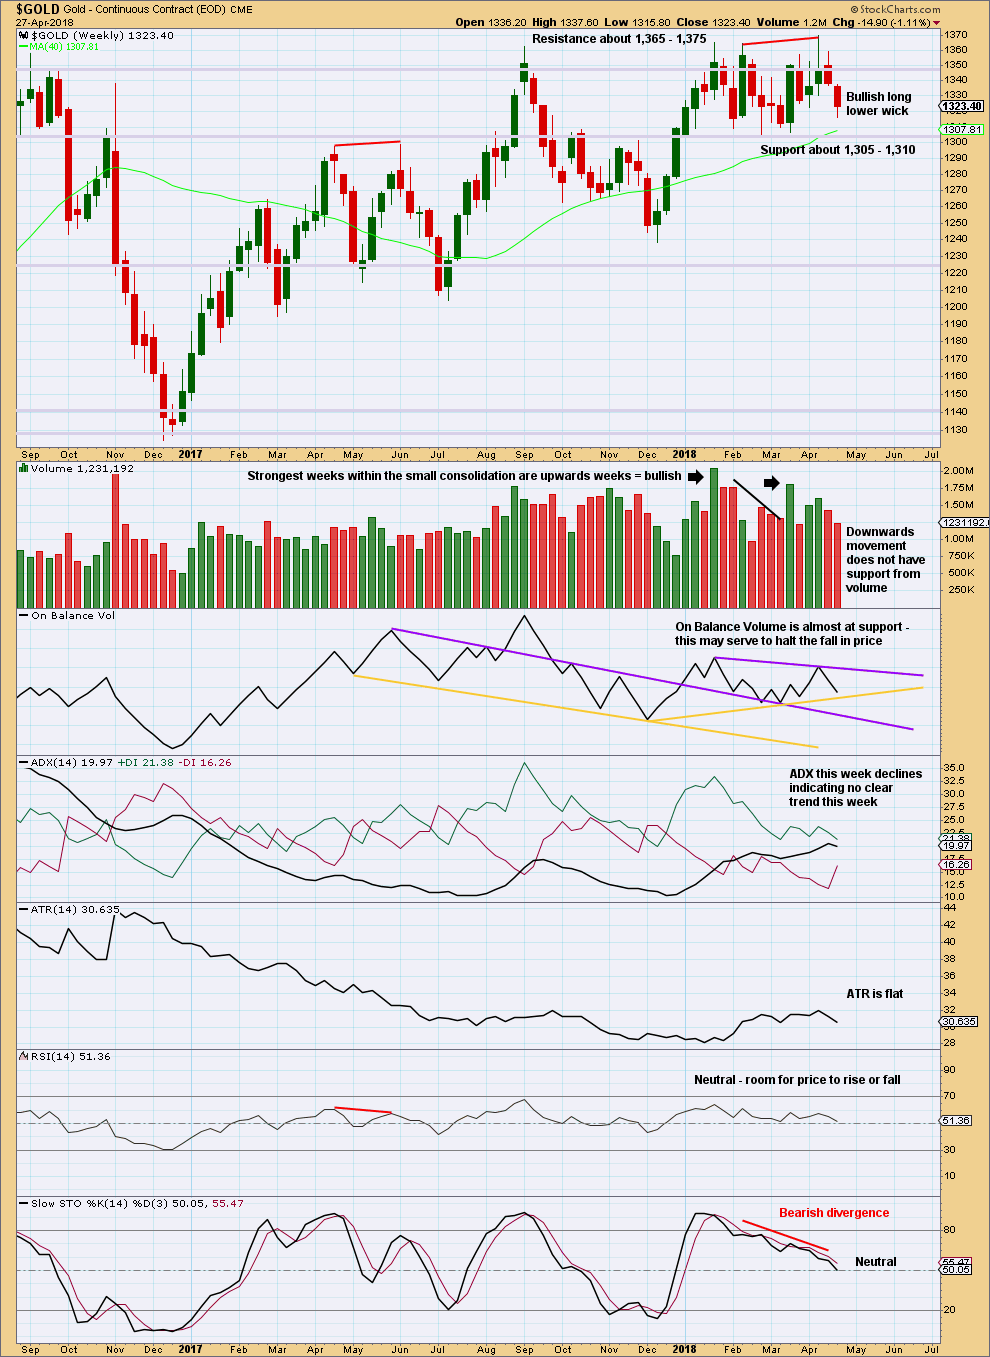
Gold is within a small consolidation with resistance about 1,365 to (final) 1,375 and strong support about 1,310 to 1,305. Volume suggests an upwards breakout is more likely than downwards.
The long lower wick on the last weekly candlestick suggests a bounce for next week, as does support for On Balance Volume.
DAILY CHART
Click chart to enlarge. Chart courtesy of StockCharts.com.
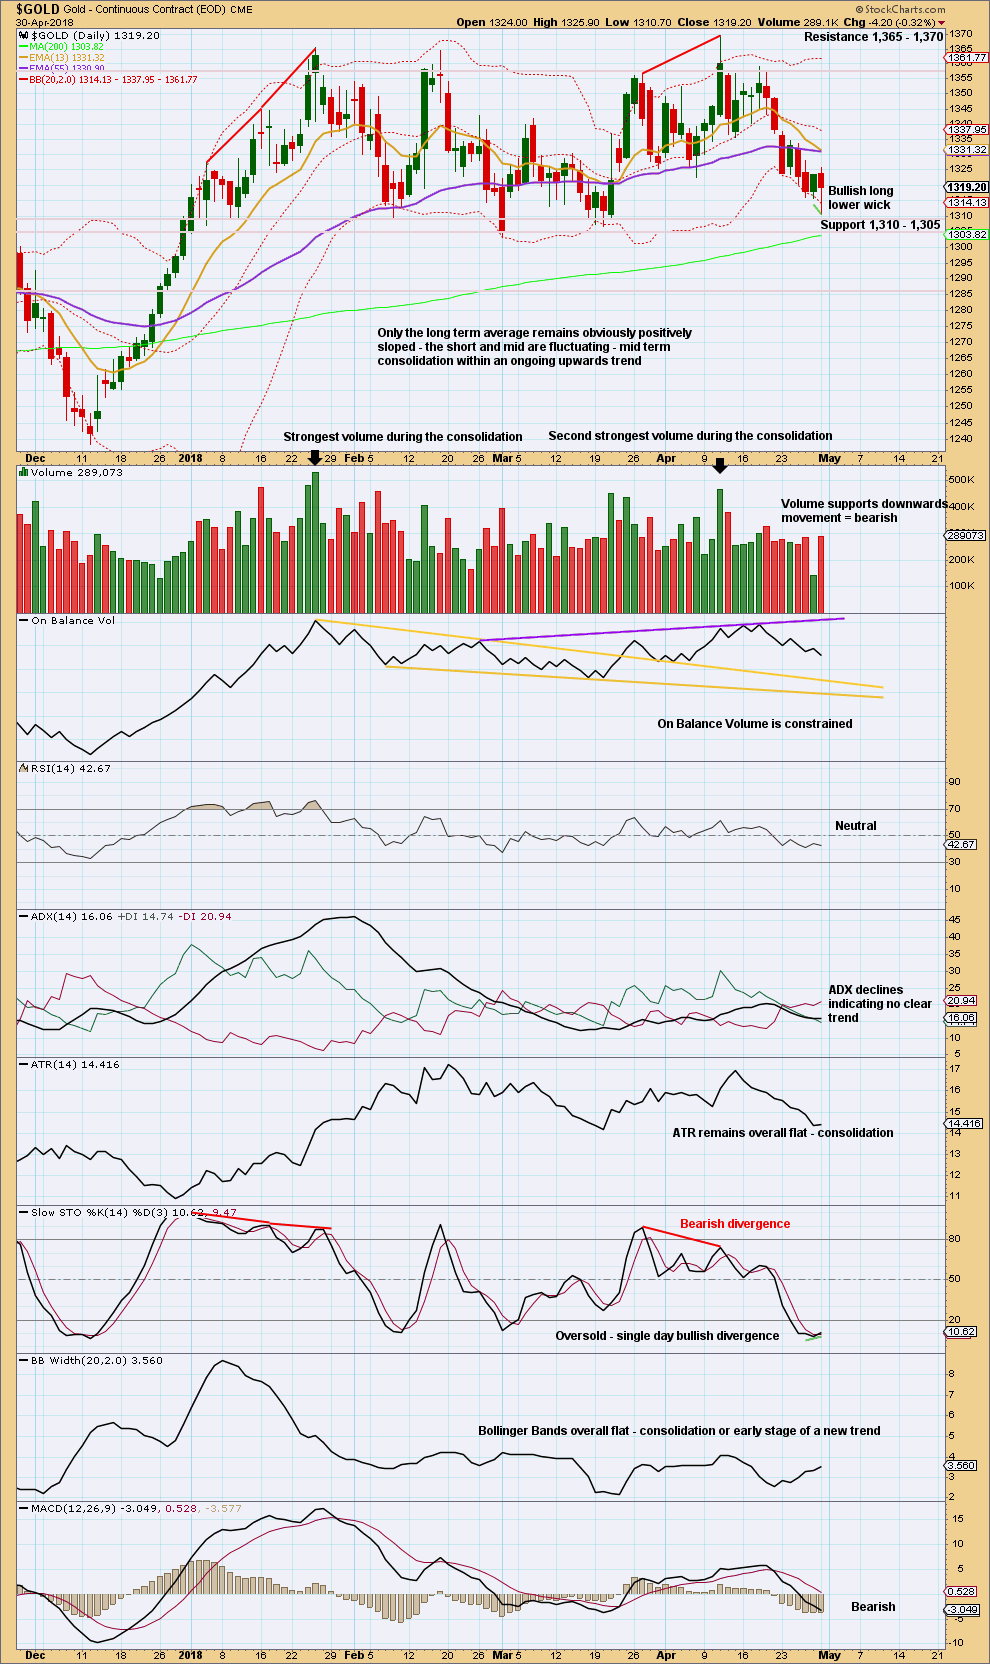
Gold is within a smaller consolidation that began back on about the 3rd of January. This consolidation is delineated by resistance about 1,360 to 1,365 and support about 1,310 to 1,305. It is the upwards days of the 15th of January and the 11th of April that have strongest volume. This strongly suggests an upwards breakout may be more likely than downwards.
Price was at resistance and exhibited divergence with Stochastics at the last high. Price has come to touch the upper edge of the support zone today. Stochastics is oversold and now exhibits a little divergence with price. The long lower wick is bullish. It looks like the downwards swing may be over today. However, it is still entirely possible though that price may move a little lower, deeper into support, before the downwards swing is complete.
GDX WEEKLY CHART
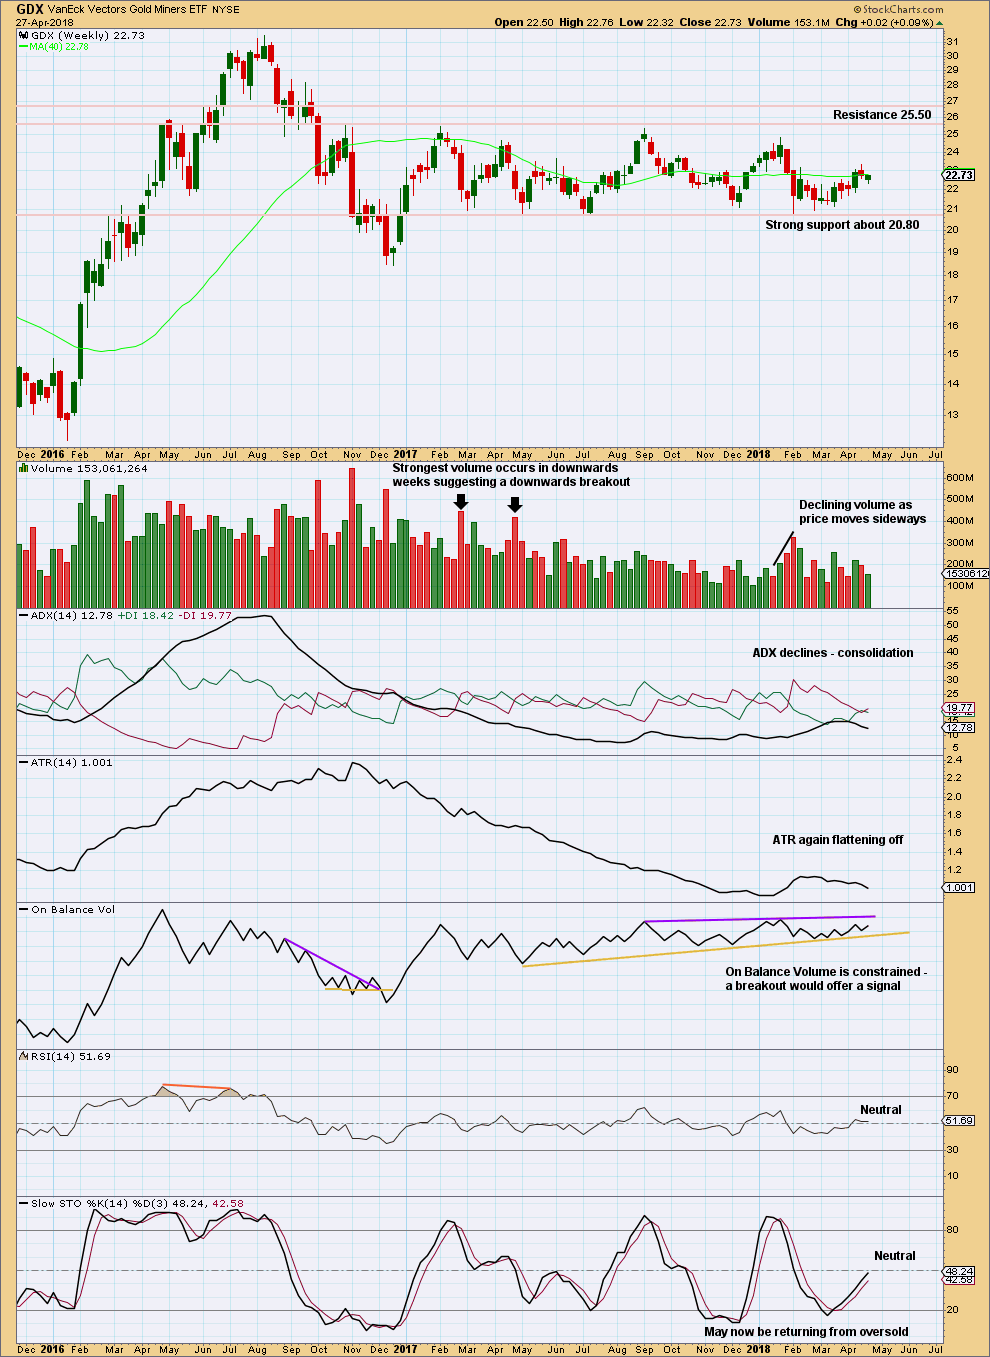
Click chart to enlarge. Chart courtesy of StockCharts.com.
Support about 20.80 has been tested about eight times and so far has held. The more often a support area is tested and holds, the more technical significance it has.
In the first instance, expect this area to continue to provide support. Only a strong downwards day, closing below support and preferably with some increase in volume, would constitute a downwards breakout from the consolidation that GDX has been in for a year now.
Resistance is about 25.50. Only a strong upwards day, closing above resistance and with support from volume, would constitute an upwards breakout.
Overall, a slow upwards swing may be underway. Do not expect it to move in a straight line; it may have downwards weeks within it.
GDX DAILY CHART
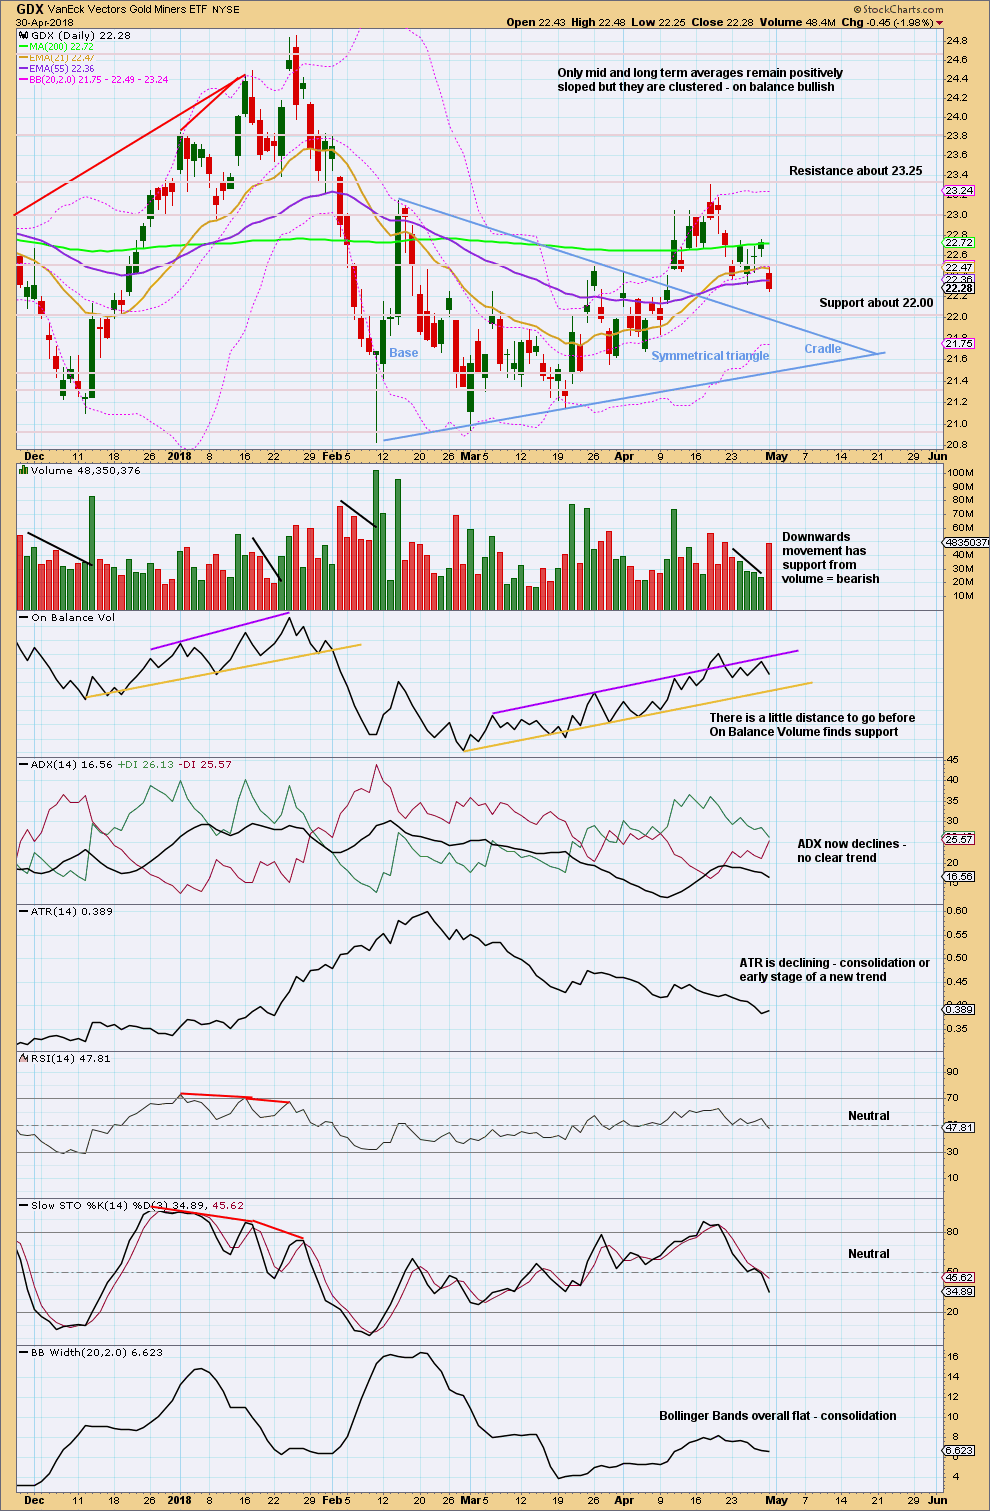
Click chart to enlarge. Chart courtesy of StockCharts.com.
On trading triangles from Dhalquist and Kirkpatrick, page 319:
“The ideal situation for trading triangles is a definite breakout, a high trading range within the triangle, an upward-sloping volume trend during the formation of the triangle, and especially a gap on the breakout. These patterns seem to work better with small-cap stocks in a rising market.
Although triangles are plentiful, their patterns suffer from many false and premature breakouts. This requires that a very strict breakout rule be used, either a wide filter or a number of closes outside the breakout zone. It also requires a close protective stop at the breakout level in case the breakout is false. Once these defensive levels have been exceeded, and price is on its way, the trader can relax for a little while because the failure rate after a legitimate breakout is relatively low. Trailing stops should then be placed at each preceding minor reversal.
…. in symmetrical triangles, the best performance comes from late breakouts in the 73% – 75% distance.
Volume on the breakout seems more desirable in symmetrical triangles.”
In this case, the breakout has come 61% of the triangle length from base to cradle. Volume towards the end of the triangle declined. The breakout is accompanied by a gap and has good support from volume.
Pullbacks occur 59% of the time for symmetrical triangles.
Any long positions entered on a pullback may use the breakaway gap as a place for stops just below 22.41. If that gap is closed, then it may be an exhaustion gap and the breakout may have failed. The gap remains open at this time. If this is correctly labelled as a breakaway gap, then price should bounce up from here. If it is closed, then next support may be about the upper trend line of the triangle.
A profit target is calculated by adding the triangle width to the breakout point. This gives a target at 24.61.
This downwards pullback may be a pullback after the triangle breakout; it may be deep and find support about the upper edge of the triangle trend lines. Look for support now about 22.00. Volume suggests downwards movement may not be over here.
Published @ 10:05 p.m. EST.
I know there have been questions about correlations with USD and gold prices in the past, but this move down has been correlated with the USD…
And today the USD RSI is oversold at 75, and it closed 30 ticks above the bollinger bands… it’s due for a correction it would seem, and that should provide a lift to gold/sliver…
I see this move from the low of 2/16/18 as a 3-3-5 three wave corrective structure, which might have ended today given the RSI…
Anyone have a count or comment on the USD?
Updated daily chart:
with updated target
now two long lower wicks = bullish
updated hourly chart – the alternate was the one
GDX & GDXJ showing relative strength GREEN while gold is falling ‘hard’ and dollar is shooting up. I like what I see…
The silver count is invalidated for sure. Maybe this free fall in silver is an expanded flat B wave? Or maybe minute 2 of the bullish count. If so that’s a very long minute 2?
I posted updated charts on Silver
I saw that. Thanks Lara… intermediate wave 2 makes a lot of sense now 🙂
GDX hourly showing my preferred BUY zone
Brilliant. Thank you very much for sharing Dreamer.
That looks like a solid wave count.
You all have seen this GDX chart before. I’m still going on the assumption that GDX bottomed on 2/9/18 after a long sideways consolidation.
It then looks like price has moved mostly sideways with two 1st and 2nd waves. If this is correct, price may be about to complete Minor wave 2 as early as tomorrow.
Awesome! Thanks again Dreamer 🙂
GDX looks like it wants to go a little lower to complete the correction; therefore I think gold goes a little lower tomorrow as the hourly alternate shows. Prefered buy target for GDX is near 21.85.
Tomorrow may be an excellent day to buy GDX, GDXJ, or their rocked fueled twins, NUGT and JNUG. NUGT and JNUG could go up 150% and more over the next few months! Good luck all 🍀
Can’t wait to start trading this market again. Been waiting for a looooooong time! And also looking forward to reading everyone’s comments again on this forum.
There has been nothing to talk about really for weeks weeks. Yikes!